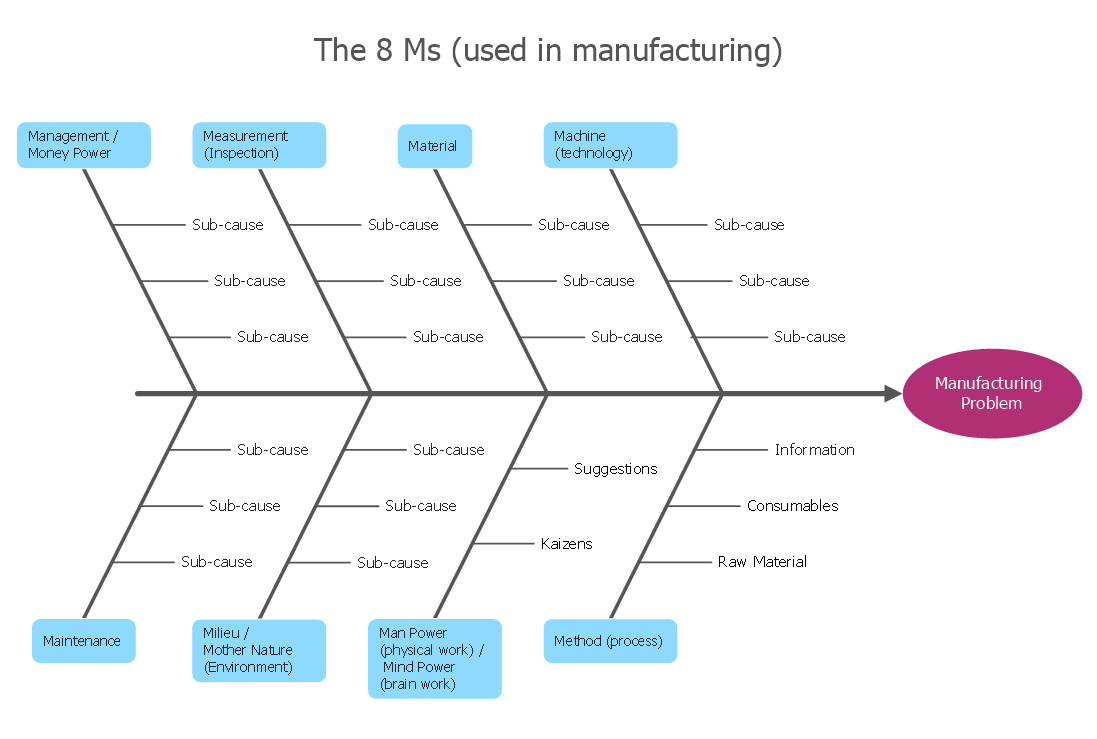
Example 1. How Do Fishbone Diagrams Solve Manufacturing Problems
6 Ms and 8 Ms are globally recognized standards for manufacturing. First you need to define an effect of the analysis and add it as a head of your diagram, all causes listed above on this page are added as the bones (without particular order). If necessary, you can also use on the diagram another terms that better suit for your company.
It is convenient to develop a Fishbone diagram representing 8 Ms or 6 Ms on the base of specialized templates, samples of Fishbone Diagrams Solution or using the predesigned objects from the Fishbone Diagrams library.

Example 2. Design Fishbone Diagrams for Manufacturing in ConceptDraw DIAGRAM
The template you see on this page was created in ConceptDraw DIAGRAM using the tools of the Fishbone Diagrams Solution. It shows the Fishbone Manufacturing 8 Ms diagram and is available from ConceptDraw STORE.
Use the Fishbone Diagrams Solution for ConceptDraw DIAGRAM Solution Park to demonstrate how do Fishbone Diagrams solve manufacturing problems.
All source documents are vector graphic documents. They are available for reviewing, modifying, or converting to a variety of formats (PDF file, MS PowerPoint, MS Visio, and many other graphic formats) from the ConceptDraw STORE. The Fishbone Diagrams Solution is available for all ConceptDraw DIAGRAM or later users.
TEN RELATED HOW TO's:
A layout is a way that furniture is arranged in some place. It’s not difficult to develop a store layout using software with tons of templates and libraries with vector shapes of furniture, doors, walls etc. Create a plan in five minutes and have more time to implement it.
Designing the floor plan for a new store is very important step for a small business. Well thought out and well-done floor plan is the foundation of the store layout. It should provide a basis through which to make out and organize everything else. Sometimes a small stores have a small floor space, so well thought out arrangement of furniture and commercial equipment is crucial to the success of the business. By using the ConceptDraw Floor Plans solution you can make a floor plan for your store quickly and effortlessly.
Picture: Store Layout Software
Related Solution:
ConceptDraw DIAGRAM diagramming and vector drawing software extended with Fishbone Diagrams solution is a perfect tool for software designers and software developers. If you need to create Cause and Effect diagram, Fishbone diagram, Ishikawa diagram from templates and examples, or using the predesigned elements, ConceptDraw DIAGRAM can do this easily.
ConceptDraw DIAGRAM software gives ability to design Fishbone diagrams that identify many possible causes for an effect for problem. Each Fishbone diagram design element included to Fishbone Diagrams library is vector and ready-to-use..png)
Picture: Fishbone Diagram Design Element
Related Solution:
The knowledge and ability to apply various strategies for dealing with problems and difficult situations is very useful in many areas. The Fishbone strategy is one of the most progressive. This graphical technique helps to identify possible causes of problems, to set the goals, and also show internal connections between the different parts of problem. After reviewing all causes and facts, you can easily find right solution.
ConceptDraw DIAGRAM diagramming and vector drawing software extended with Fishbone Diagrams Solution from the Management Area of ConceptDraw Solution Park is a powerful Fishbone Problem Solving tool.
Picture: Fishbone Problem Solving
Related Solution:
Chemical and Process Engineering solution contains variety predesigned process flow diagram elements relating to instrumentation, containers, piping and distribution necessary for chemical engineering, and can be used to map out chemical processes or easy creating various Chemical and Process Flow Diagrams in ConceptDraw DIAGRAM.
Picture: Process Flow Diagram Symbols
Related Solution:
A flowchart is a simple but very functional tool when it comes to understanding a workflow or to removing unnecessary stages from a process. When drawing flowcharts, keep in mind that there are four common types of flowcharts, like document flowcharts and data flowcharts that show control over a data or document flow over a system. To show controls on a physical level, use system flowcharts. In addition, to show controls in a program, you can draw a program flowchart.
This flowchart diagram represents the piece of an article editing process, that involves the author and editor. It was created using the Basic Flowchart notation that consists from the basic flowchart symbols. The start and the end of the process are indicated with "Terminator" symbols. The "Process" symbols show the action steps consisting from making edits and searching for a compromise, when the author does not agree with the suggestions of the editor. The "Process" symbol is the general symbol in process flowcharts. The "Decision" symbol indicates a branching in the process flow. There are two branches indicated by a Decision shape in the current flowchart (Yes/No, Disagree/Agree). This basic flowchart can be used as a repeating unit in the workflow diagram describing the working process of some editorial office.
Picture: Types of Flowcharts
Related Solution:
Also included are standardized hr flowchart symbols, meaning your diagrams will be relevant and understood by all business associates.
Picture: HR Flowchart Symbols
Related Solution:
Data flow diagrams are the graphical tool, used in the visualization of data flow of some data processing systems. It is the valuable process modeling tool. Also designing DFD is the important component of the initial part of any information system development project. The standard symbols are used to represent the interaction of a system components and how various kinds of components influence on data flow. The ConceptDraw Data Flow Diagrams solution is design to assist professional software engineers in making DFDs according to Gane and Sarson, and Yourdon and Coad notations.
Do you imagine yourself as a successful IT specialist? To your mind, they all use data flow diagram examples to learn and to get inspired. Aren’t you still with us?
Picture: Data Flow Diagram Examples
Related Solution:
Electrical plan is a document that is developed during the first stage of the building design. This scheme is composed of conventional images or symbols of components that operate by means of electric energy. To simplify the creation of these schemes you can use house electrical plan software, which will not require a long additional training to understand how to use it. You only need to install the necessary software ant it’s libraries and you’ll have one less problem during the building projection.
Any building contains a number of electrical systems, including switches, fixtures, outlets and other lightening equipment. All these should be depicted in a building electrical plans and included to general building documentation. This home electrical plan displays electrical and telecommunication devices placed to a home floor plan. On the plan, each electrical device is referenced with the proper symbol. Electrical symbols are used for universal recognition of the building plan by different persons who will be working on the construction. Not all possible electric symbols used on a certain plan, so the symbols used in the current home plan are included to a legend. The electrical home plan may be added as a separate document to a complete set of building plans.
Picture: How To use House Electrical Plan Software
Related Solution:
Competitor analysis is a first and obligatory step in elaboration the proper corporate marketing strategy and creating sustainable competitive advantage. Use powerful opportunities of numerous solutions from ConceptDraw Solution Park for designing illustrative diagrams, charts, matrices which are necessary for effective competitor analysis.
Picture: Competitor Analysis
Related Solution:
Electrical Engineering Solution used together with ConceptDraw DIAGRAM drawing facilities makes short a work of drawing various electrical and electronic circuit schemes. A library of vector objects composed from symbols of Analog and Digital Logic elements of electric circuit includes 40 symbolic images of logic gates, bistable switches of bi-stable electric current, circuit controllers, amplifiers, regulators, generators, etc. All of them can be applied in electronic circuit schemes for showing both analog and digital elements of the circuit.
Electrical Engineering Solution used together with ConceptDraw DIAGRAM drawing facilities makes short a work of drawing various electrical and electronic circuit schemes. A library of vector objects composed from symbols of Analog and Digital Logic elements of electric circuit includes 40 symbolic images of logic gates, bistable switches of bi-stable electric current, circuit controllers, amplifiers, regulators, generators, etc. All of them can be applied in electronic circuit schemes for showing both analog and digital elements of the circuit.
Picture:
Electrical Diagram Symbols F.A.Q.
How to Use Electrical ConceptDraw Diagram Software
Related Solution: