Fault Tree Analysis Software
“Fault tree analysis (FTA) is a top down, deductive failure analysis in which an undesired state of a system is analyzed using Boolean logic to combine a series of lower-level events. This analysis method is mainly used in the fields of safety engineering and reliability engineering to understand how systems can fail, to identify the best ways to reduce risk or to determine (or get a feeling for) event rates of a safety accident or a particular system level (functional) failure. FTA is used in the aerospace, nuclear power, chemical and process, pharmaceutical, petrochemical and other high-hazard industries; but is also used in fields as diverse as risk factor identification relating to social service system failure. FTA is also used in software engineering for debugging purposes and is closely related to cause-elimination technique used to detect bugs.” [from Wikipedia]
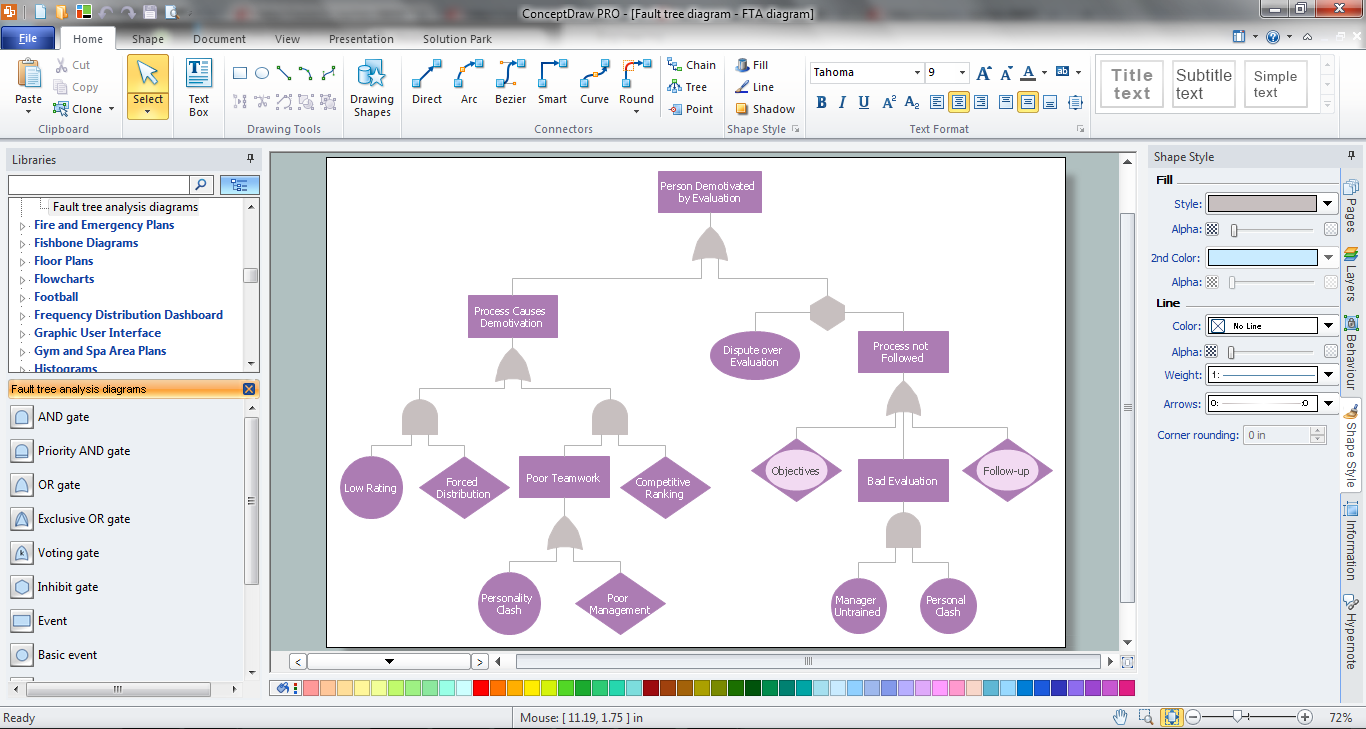
ConceptDraw DIAGRAM extended with Fault Tree Analysis Diagrams Solution from the Industrial Engineering Area of ConceptDraw Solution Park is the best Fault Tree Analysis Software.
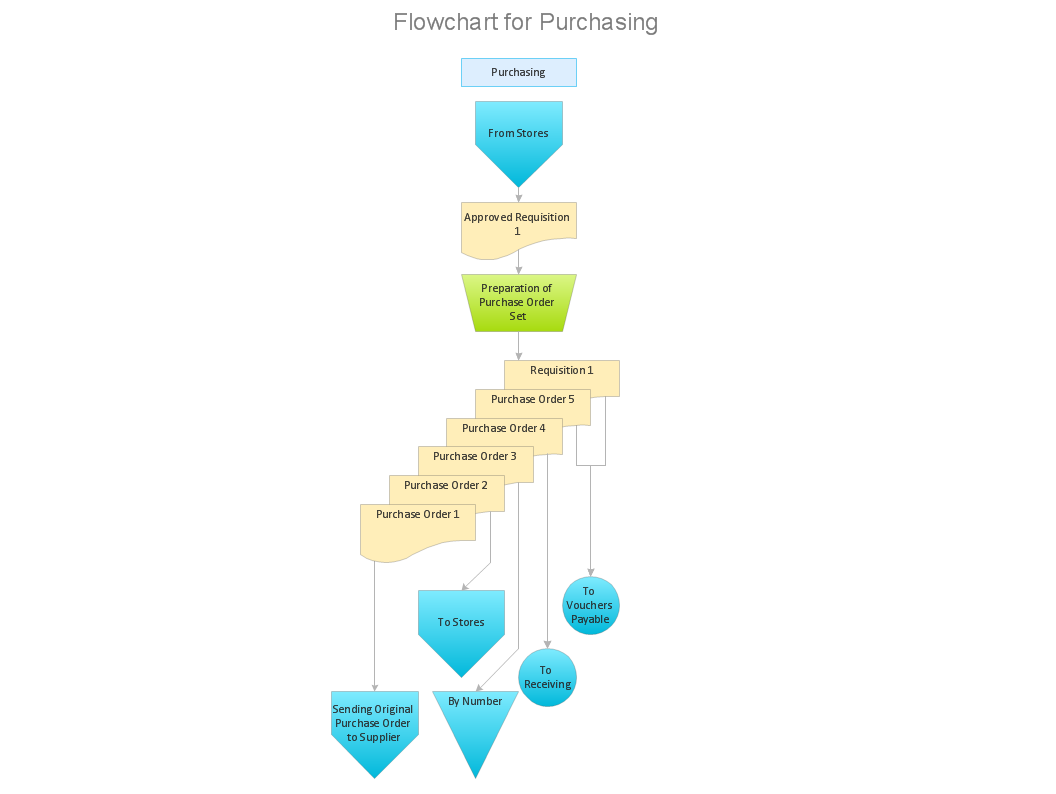
Example 1. Fault Tree Analysis Software
First of all, Fault Tree Analysis Diagrams Solution provides a set of samples which are the good examples of easy drawing professional looking Fault Tree Analysis Diagrams.

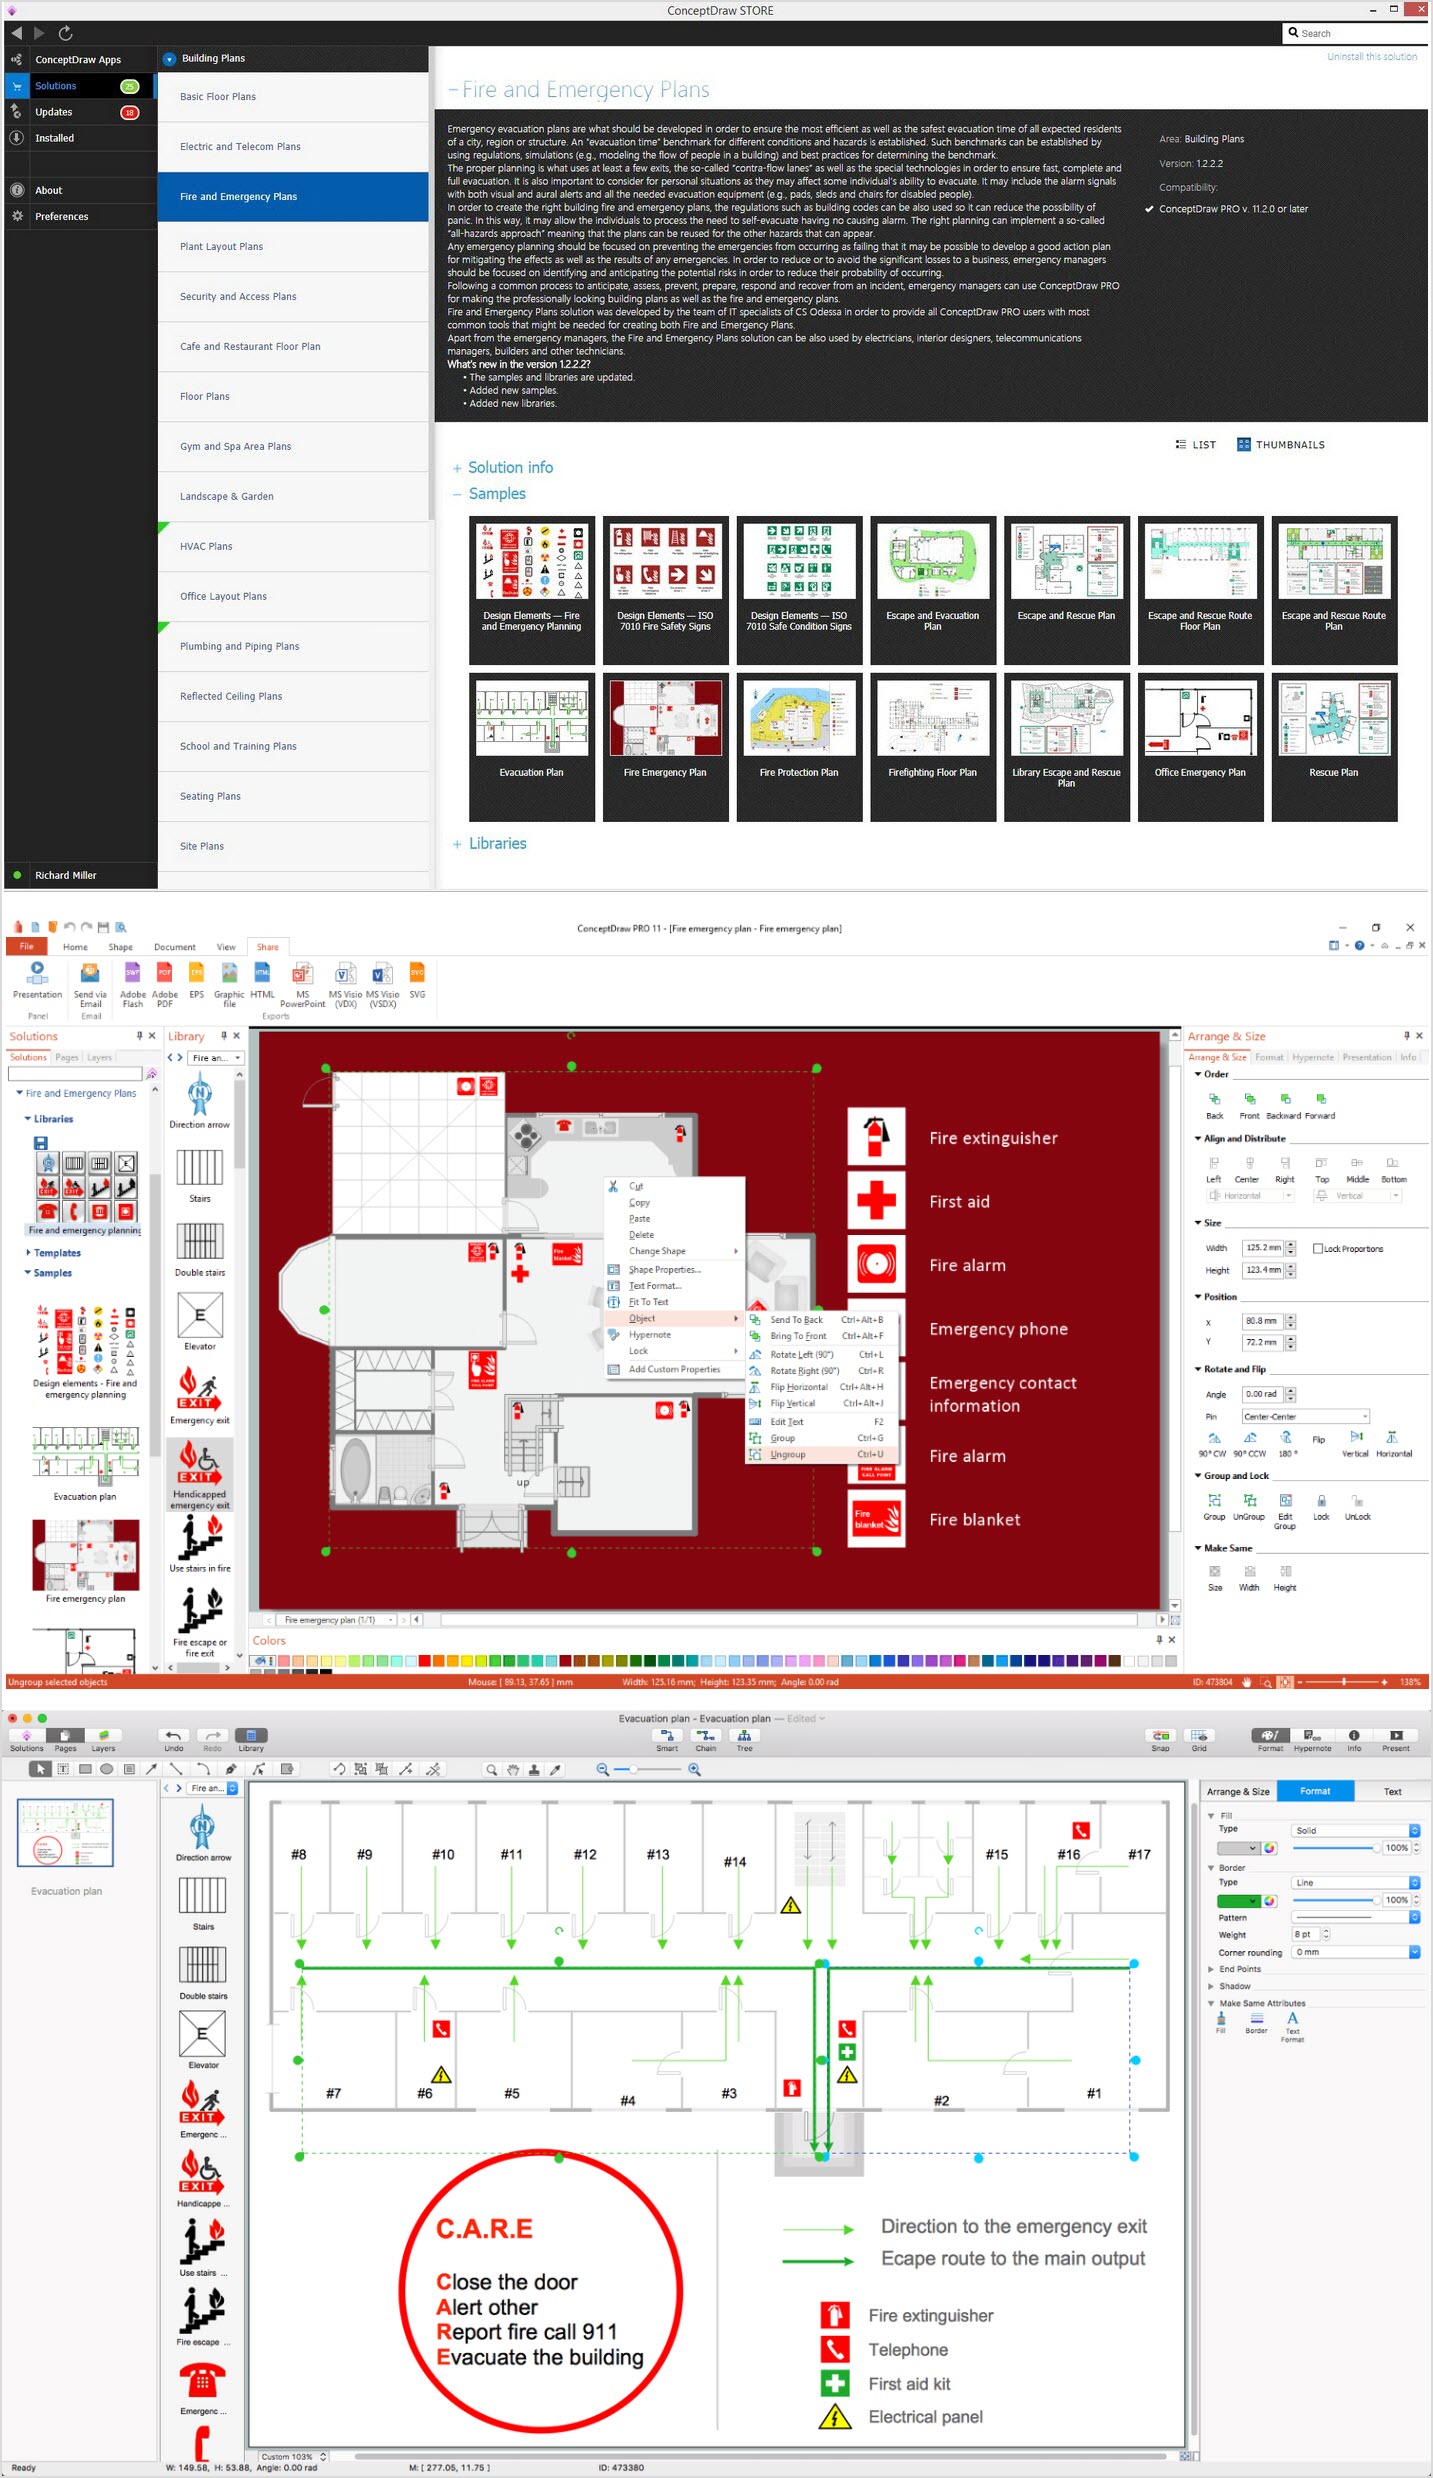
Example 2. Fault Tree Analysis Diagrams Solution in ConceptDraw STORE
All examples, samples, and templates included in Fault Tree Analysis Diagrams Solution for ConceptDraw DIAGRAM fault tree analysis software are available for viewing and editing from ConceptDraw STORE.
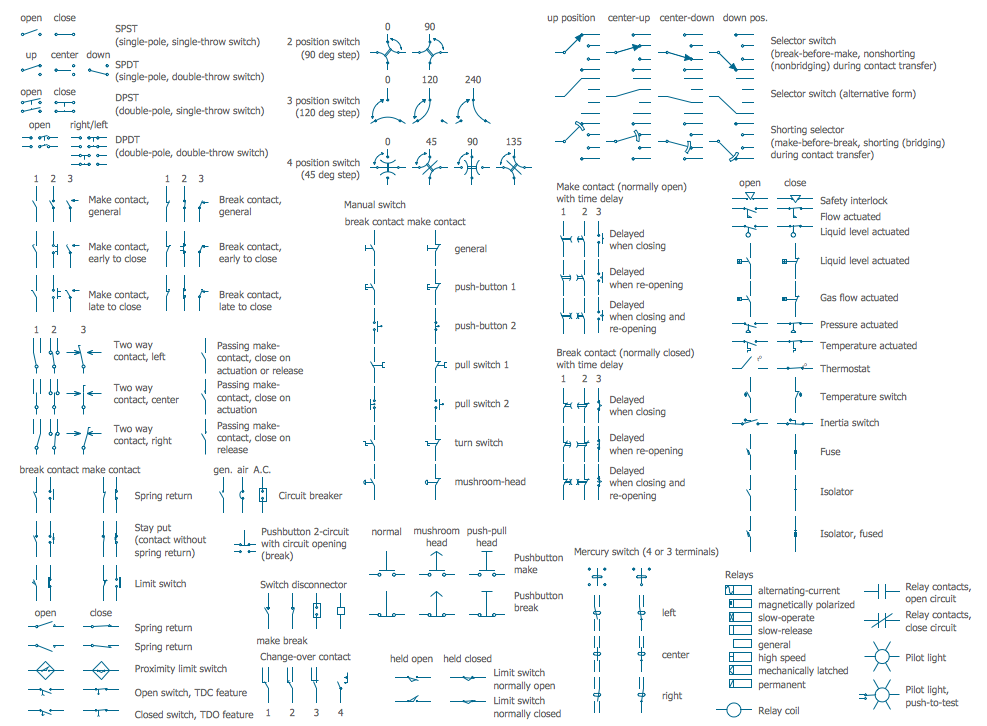
Fault Tree Analysis Diagrams symbols:
AND gate — The output event occurs if all input events occur.

Priority AND gate — The output event occurs if all input events occur in a specific sequence.

Inhibit gate — The input event occurs if all input events occur and an additional conditional event occurs.

Event

OR gate - The output event occurs if at least one of the input events occurs.

XOR gate - The output event occurs if exactly one input event occurs.

Voting gate - The output event occurs if k or more of the input events occur.

Basic event - A basic initiating fault (or failure event).

Undeveloped event — An event which is no further developed. It is a basic event that does not need further resolution.

House event — An event that is normally expected to occur. In general, these events can be set to occur or not occur, i.e. they have a fixed probability of 0 or 1.

Conditional event — A specific condition or restriction that can apply to any gate.

Transfer symbol — Indicates a transfer continuation to a sub tree.

Pay also attention for the Fault Tree Analysis Diagram library of predesigned vector elements. They will help design Fault Tree Diagrams without efforts.

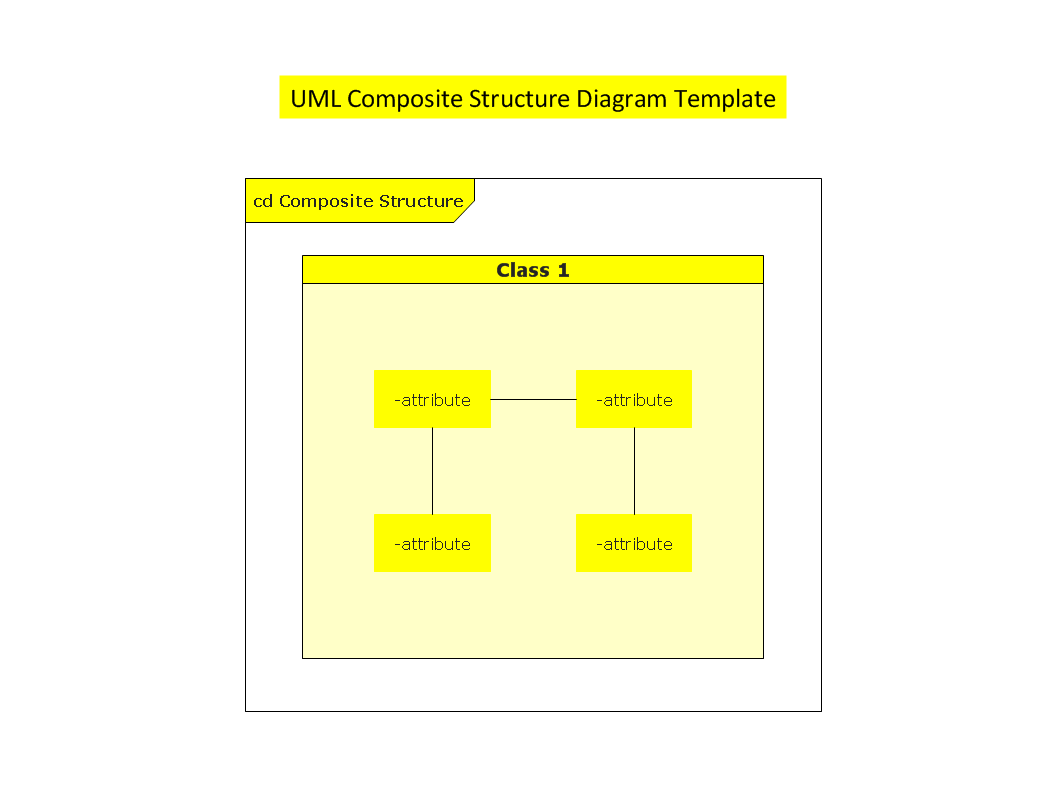
Example 4. Fault Tree Analysis Diagram
The following features make ConceptDraw DIAGRAM the best Fault Tree Analysis Software:
- You don't need to be an artist to draw professional looking diagrams in a few minutes.
- Large quantity of ready-to-use vector objects makes your drawing diagrams quick and easy.
- Great number of predesigned templates and samples give you the good start for your own diagrams.
- ConceptDraw DIAGRAM provides you the possibility to use the grid, rules and guides. You can easily rotate, group, align, arrange the objects, use different fonts and colors to make your diagram exceptionally looking.
- All ConceptDraw DIAGRAM documents are vector graphic files and are available for reviewing, modifying, and converting to a variety of formats: image, HTML, PDF file, MS PowerPoint Presentation, Adobe Flash, MS Visio.
- Using ConceptDraw STORE you can navigate through ConceptDraw Solution Park, managing downloads and updates. You can access libraries, templates and samples directly from the ConceptDraw STORE.
- If you have any questions, our free of charge support is always ready to come to your aid.
TEN RELATED HOW TO's:
While creating flowcharts and process flow diagrams, you should use special objects to define different statements, so anyone aware of flowcharts can get your scheme right. There is a short and an extended list of basic flowchart symbols and their meaning. Basic flowchart symbols include terminator objects, rectangles for describing steps of a process, diamonds representing appearing conditions and questions and parallelograms to show incoming data.
This diagram gives a general review of the standard symbols that are used when creating flowcharts and process flow diagrams. The practice of using a set of standard flowchart symbols was admitted in order to make flowcharts and other process flow diagrams created by any person properly understandable by other people. The flowchart symbols depict different kinds of actions and phases in a process. The sequence of the actions, and the relationships between them are shown by special lines and arrows. There are a large number of flowchart symbols. Which of them can be used in the particular diagram depends on its type. For instance, some symbols used in data flow diagrams usually are not used in the process flowcharts. Business process system use exactly these flowchart symbols.
Picture: Basic of Flowchart: Meaning and Symbols
Related Solution:
A software tool that saves your time on making decisions now has the ability to make decisions with remote team via Skype.
Picture: Decision Making Software For Small Business
Related Solution:
While creating flowcharts and process flow diagrams, you should use special objects to define different statements, so anyone aware of flowcharts can get your scheme right. There is a short and an extended list of basic flowchart symbols and their meaning. Basic flowchart symbols include terminator objects, rectangles for describing steps of a process, diamonds representing appearing conditions and questions and parallelograms to show incoming data.
This diagram gives a general review of the standard symbols that are used when creating flowcharts and process flow diagrams. The practice of using a set of standard flowchart symbols was admitted in order to make flowcharts and other process flow diagrams created by any person properly understandable by other people. The flowchart symbols depict different kinds of actions and phases in a process. The sequence of the actions, and the relationships between them are shown by special lines and arrows. There are a large number of flowchart symbols. Which of them can be used in the particular diagram depends on its type. For instance, some symbols used in data flow diagrams usually are not used in the process flowcharts. Business process system use exactly these flowchart symbols.
Picture: Basic of Flowchart: Meaning and Symbols
Related Solution:
Local area network connects computers and other network appliances within an area, such as office building or a campus. It can be difficult to provide such network without a predesigned plan. For these purposes you can use network diagram software, which helps you to create LAN network diagrams and office network diagrams quickly and effortless. This will speed up your work and you can save the diagram for the future network improvements.
The following diagram illustrates a network topology of the small office. LAN configuration has a star topology. The local network joins 8 computers among which are several desktop PCs, laptop, two iMacs and iBook. The end-point devices are divided into three groups. Each group is connected to its hub. There is a network printer and a modem, which are interconnected with other devices through a network server. Each computer on the LAN can access the server through a corresponding hub.
Picture: Network Diagram Software. LAN Network Diagrams. Physical Office Network Diagrams
Related Solution:
The HR Management Software is an incredibly powerful tool for those who need to analyze or present human resource process flows in a visually effective manner.
Picture: HR Management Software
Related Solution:
Pyramid chart example is included in the Pyramid Diagrams solution from Marketing area of ConceptDraw Solution Park.
Picture: Pyramid Diagram
Related Solutions:
You need to draw Authority Matrix Diagram quick and easy? Design it with ConceptDraw DIAGRAM!
ConceptDraw DIAGRAM extended with Seven Management and Planning Tools solution from the Management Area is the best Authority Matrix Diagram Software.
Picture: Authority Matrix Diagram Software
Related Solution:
ConceptDraw DIAGRAM is a powerful drawing tool that changes the way diagrams are produced.
Diagrama de Topologia or Topology Diagram helps you see the big picture as you develop a service.
Picture: Diagrama de Topologia
Related Solution:
The world-best Entity Relationship Diagram software suitable for professional ERD drawing is ConceptDraw DIAGRAM software extended with the Entity-Relationship Diagram (ERD) solution. This solution contains all libraries, templates and samples you may need for professional ERD drawing.
Picture: Entity Relationship Diagram Software
Related Solution:
ConceptDraw DIAGRAM diagramming and vector drawing software offers the Marketing Diagrams Solution from the Marketing Area with extensive drawing tools, predesigned vector shapes, templates and samples for fast and easy drawing marketing charts and diagrams, marketing schemes and flow charts, various marketing illustrations, etc.
Picture: Marketing Charts
Related Solution: