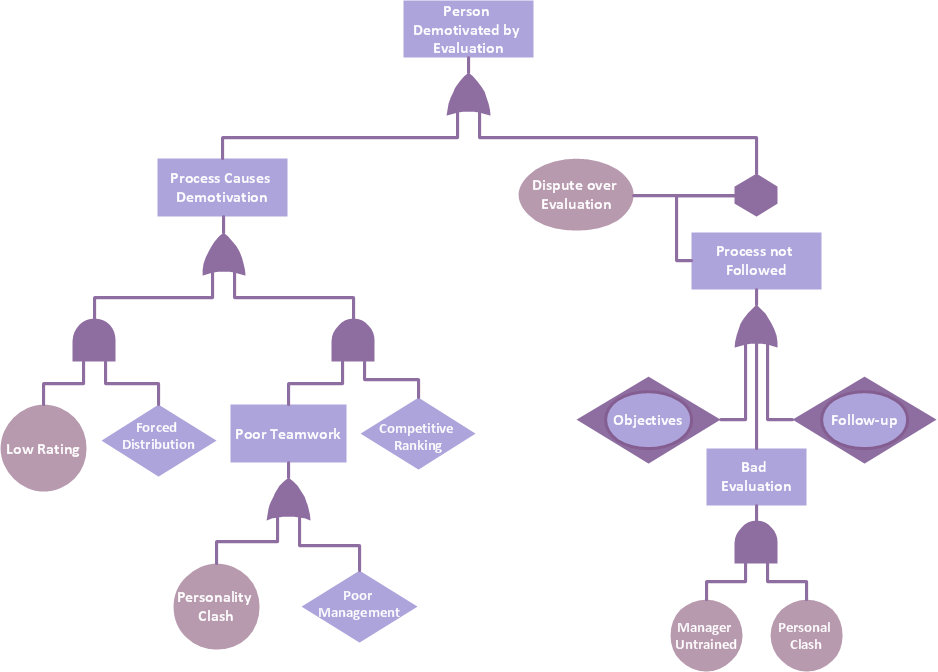
Sample 1. Fault tree analysis (FTA) diagram.
ConceptDraw DIAGRAM diagramming software provides vector shapes and connector tools for quick and easy drawing diagrams for business, technology, science and education.
Use ConceptDraw DIAGRAM enhanced with solutions from ConceptDraw Solution Park to create diagrams to present and explain structures, process flows, logical relationships, networks, design schemes and other visually organized information and knowledge.
TEN RELATED HOW TO's:
Create your own flow charts of settlement processes using the ConceptDraw DIAGRAM diagramming and vector drawing software extended with the Cross-Functional Flowcharts solution from the Business Processes area of ConceptDraw Solution Park.
Download easy flowchart software to create settlement process flowcharts show steps of monthly settlement with your business quickly and easily.
Picture: Settlement Process Flowchart. Flowchart Examples
Related Solution:
One of the most visible trends in today's information technology (IT) industry is the placement of databases to the cloud. Microsoft Azure is one of such useful cloud services which is quite popular among applications developers and offers them extensive and effective Azure management tools.
ConceptDraw DIAGRAM diagramming and vector drawing software enhanced with Azure Architecture Solution from the Computer and Networks area of ConceptDraw Solution Park offers all needed tools for designing Azure management illustrations and Azure Architecture Diagrams.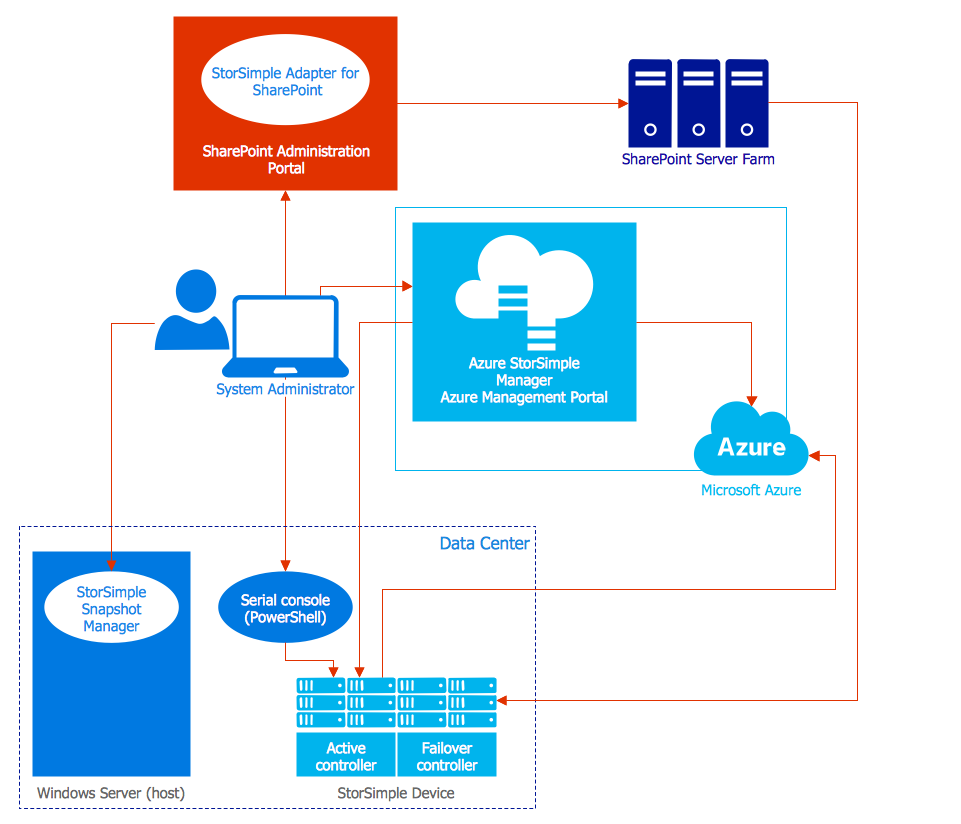
Picture: Azure Management
Related Solution:
Many professionals have to solve problems every day. Designing of the process algorithm contribute to understand where the problem is in the process. A Flowchart is a graphical tool that most usable for breaking down processes.
Definition of flowchart - a diagram that shows step-by-step progression through a procedure or system especially using connecting lines and a set of conventional symbols.
All the icons, symbols and connectors needed for creating standardized notation flowcharts are contained within Software Flow Chart.
Picture: Software Flow Chart
Related Solution:
Value Stream & Process Flow Diagramming Software is a very popular Lean Manufacturing tool that allows to see and visualize in details the company's processes and current state, the flow of material and information, and thus gives the possibility to analyze the efficiency of company's processes and then develop improved processes. Value stream maps are also a good way to define the steps that do not add value to the end product, in other words waste in a company's processes.
Picture: Value Stream & Process Flow Diagramming Software
Related Solution:
This sample shows the UML Class Diagram that was created in ConceptDraw DIAGRAM on the Mac and then was opened for editing in MS Visio.
Using the 13 libraries of the Rapid UML Solution for ConceptDraw DIAGRAM you can create your own visual vector UML diagrams quick and easy.
Picture: UML Diagram Visio
Related Solution:
ConceptDraw DIAGRAM with the Workflow Diagrams solution delivers a complete set of samples and templates. This set contains basic workflow examples you may use to start drawing your own workflow or to get closer with workflow idea.
Picture: Basic Workflow Examples
Related Solution:
ConceptDraw DIAGRAM extended with Seven Management and Planning Tools Solution from the Management Area of ConceptDraw Solution Park is the best software for drawing all types of diagrams from the Seven Management and Planning Tools: Affinity Diagram, Relations Diagram, Prioritization Matrix, Root Cause Analysis Tree Diagram, Involvement Matrix, PERT Chart, and Risk Diagram (PDPC).
Picture: PDPC
Related Solution:
If you want to find a way to understand complex things in minutes, you should try to visualize data. One of the most useful tool for this is creating a flowchart, which is a diagram representing stages of some process in sequential order. There are so many possible uses of flowcharts and you can find tons of flow charts examples and predesigned templates on the Internet. Warehouse flowchart is often used for describing workflow and business process mapping. Using your imagination, you can simplify your job or daily routine with flowcharts.
Warehouse flowcharts are used to document product and information flow between sources of supply and consumers. The flowchart provides the staged guidance on how to manage each aspect of warehousing and describes such aspects as receiving of supplies; control of quality; shipment and storage and corresponding document flow. Warehouse flowchart, being actual is a good source of information. It indicates the stepwise way to complete the warehouse and inventory management process flow. Also it can be very useful for an inventory and audit procedures.
Picture: Flow Chart Example: Warehouse Flowchart
Related Solution:
Business process maps help you evaluate and manage quality in a work process chain, placing an emphasis on corporate performance and optimization.
Business Mapping Software a versatile collection of libraries and templates, that allow you to create business process and SIPOC diagrams, using the Six Sigma methodology.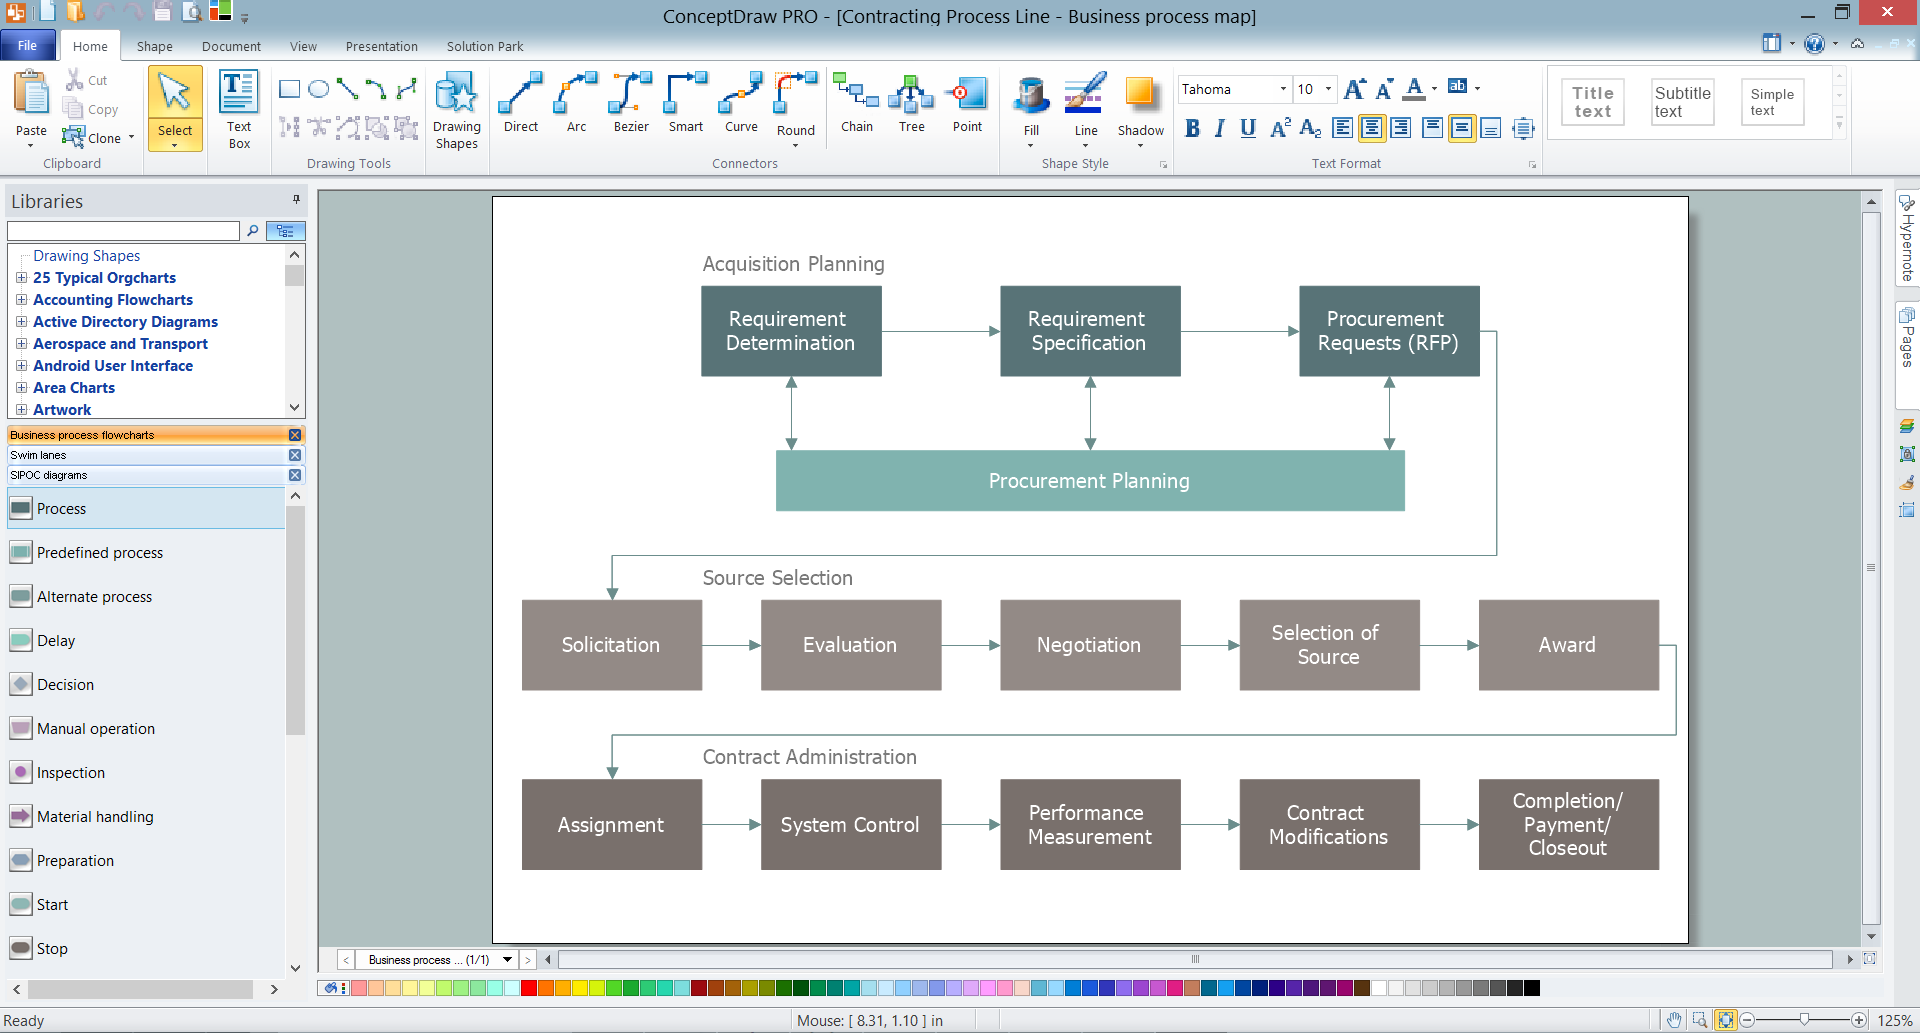
Picture: Business Mapping Software
Related Solution:
Risk Diagram (PDPC) - ConceptDraw OFFICE suite is a software for Risks Diagram making. This diagram identifies possible risks in accomplishing corrective actions. With the Risks Diagram, one analyzes each action separately in a tree of all actions and develops a preventive action in response of each potential obstacles or circumstances which may be a risk.
Picture: CORRECTIVE ACTIONS PLANNING. Risk Diagram (PDPC)