Basic Workflow Examples
Deigned examples
ConceptDraw DIAGRAM with the Workflow Diagrams solution delivers a complete set of samples and templates. This set contains basic workflow examples you may use to start drawing your own workflow or to get closer with workflow idea.
ConceptDraw DIAGRAM is a professional drawing tool for workflow diagram. The part of this tool is the Workflow Diagrams solution that contains several well-designed examples. They carry the simple entrance to workflow process diagram.
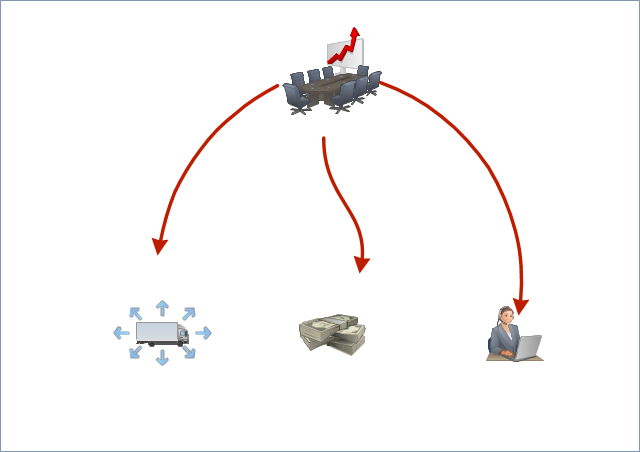
Pic.1 Business Process
...
...
...
See also Samples:
TEN RELATED HOW TO's:
The ConceptDraw Flowchart component includes a set of samples and templates. This geathered as flowchart maker toolbox which focused on drawing flowcharts of any industry standards.
Picture: Flowchart Components
Related Solution:
Professional diagramming software for mac helps you create Cause and Effect diagram known as Fishbone diagram or Ishikawa diagram from ConceptDraw Business Solution.
You will be offered to use templates, samples or draw your diagram using ConceptDraw Arrows10 Technology
Picture: Draw Diagram on Mac
ConceptDraw DIAGRAM extended with Workflow Diagrams solution from the Business Processes area is a powerful workflow diagram software which offers you a variety of workflow examples.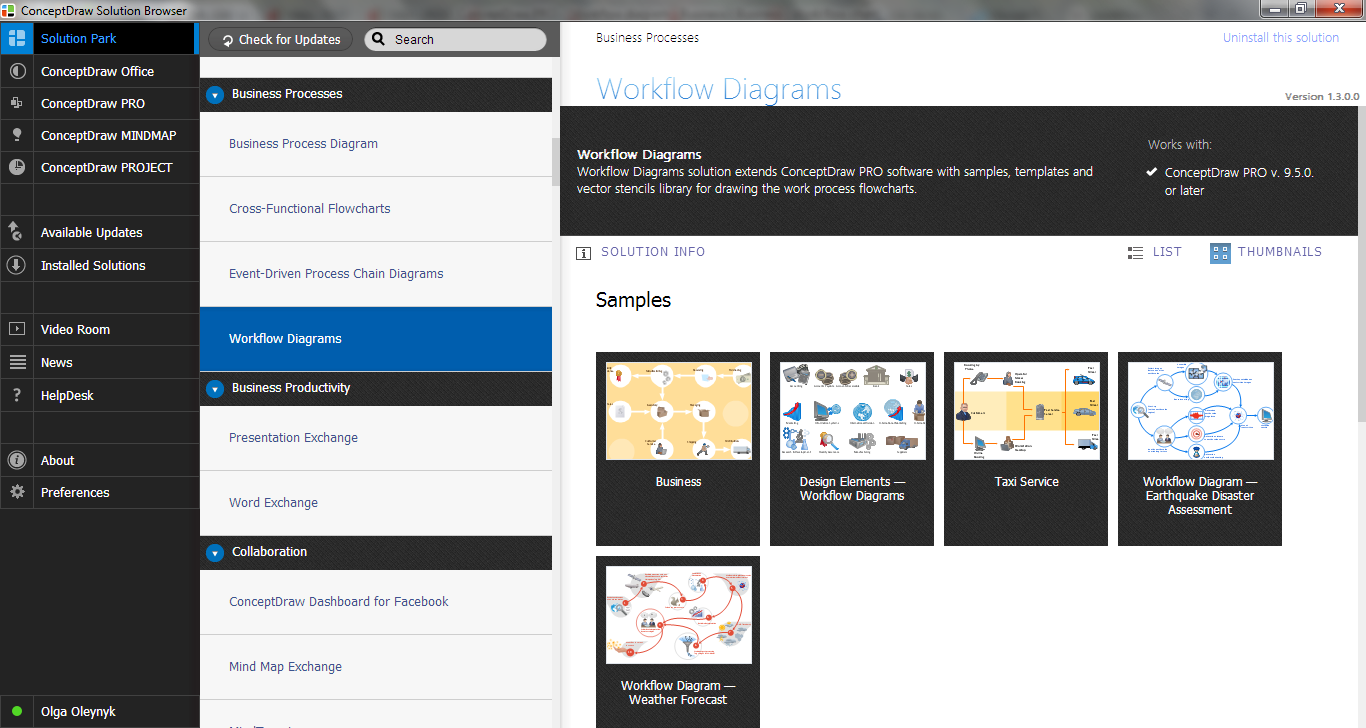
Picture: Workflow Examples
Related Solution:
The art of arranging furniture and other decorations in space is called interior design. Some sites, like sport fields have tight restrictions in dimensions, but there's still a lot of work for a designer. You can help yourself to design such a plan with ConceptDraw DIAGRAM solution Sport Field Plans that contains elements of sport equipment and recreation plans.
This drawing represents the set of vector graphic objects that compose the Sport fields and Recreation library, supplied by ConveptDraw Sport Fields Plans solution. It can be used for drawing interior designs and layouts of sport fields and recreation zones. By using ConceptDraw with Sport Field Plans solution you can create professional plans for different sport fields: basketball, volleyball, football, tennis, golf, etc. Moreover, the use of this solutions enables making a site plans including green zone, pools, parkings - in short, what makes the recreation area, that usually accompanies sports facilities.
Picture: Interior Design. Sport Fields — Design Elements
Related Solution:
When thinking about data visualization, one of the first tools that comes to mind is a flowchart design. You can find flowchart symbols, shapes, stencils and icons easily on the Internet, but it might take time to systematize this information. Nevertheless, once you start flowcharting, you’ll love its simplicity and efficiency.
This diagram consists from standard flowchart symbols, approved by ANSI (American National Standard Institute) for drawing flowcharts. A flowchart is a diagram that represents a step-by-step algorithm of any process, displaying the process stages as boxes that are connected with arrows. Flowchart design makes it clear and readable.
Flowchart designed using ConceptDraw DIAGRAM flowchart software allows to make attractive and clear process presentation, it makes interpretation of the business process flow fresh and versatile. Great flowchart design view is a big advantage over the diagram created manually on a paper.
Picture: Flowchart Design: Principles, Layout, Symbols and Best Practices
Related Solution:
Successful quality management implemented in a company of any size is a critical component of a company organization.
Picture: What is a Quality Management
Related Solution:
ConceptDraw PROJECT is an effective tool for new and experienced users with a fine balance of usability and powerful functionality.
Picture: ConceptDraw PROJECT Software Overview
Sometimes it's difficult to find a path in work processes or to understand the requirements, especially when you are a newcomer. To get your thoughts straight, create a workflow diagram, and put everything on it. This will not only help you to get into the workflow, but also show it’s weaknesses.
This illustration captures the workflow process of payment an invoice for the electricity consumed by certain enterprise. It was drawn in ConceptDraw DIAGRAM using its solution for Workflow Diagrams. Making a workflow charts means that you need to depict consistently all processes engaged to the workflow process. Then, you should connect them with symbols meaning study and analysis. Next, add symbols of decisions. A work flow diagram made precisely and correctly can help to clarify your work flow to any person.
Picture: Workflow Diagram
Related Solution:
Workflow Diagram created by using special software based on graphic mastering technology Arrows10. Its automatics follows the global concept of business graphics and diagramming. The practical effectiveness of Arrows10 technology used in ConceptDraw DIAGRAM are around the quick auto-arrows behaving as expected and connecting boxes of workflow diagram from workflow symbol to process flow symbol.
ConceptDraw DIAGRAM is a workflow diagram software contains specific features help you to draw diagrams faster, such as RapidDraw, or Arrows10. There is also a rich set of samples and templates to give you an example of data may be visualized as workflow diagram.
Picture: Workflow Diagram Data
Related Solution:
Purchasing Workflow Chart as a methods for documenting accounting information systems. Symbols and Methods for designing Accounting System.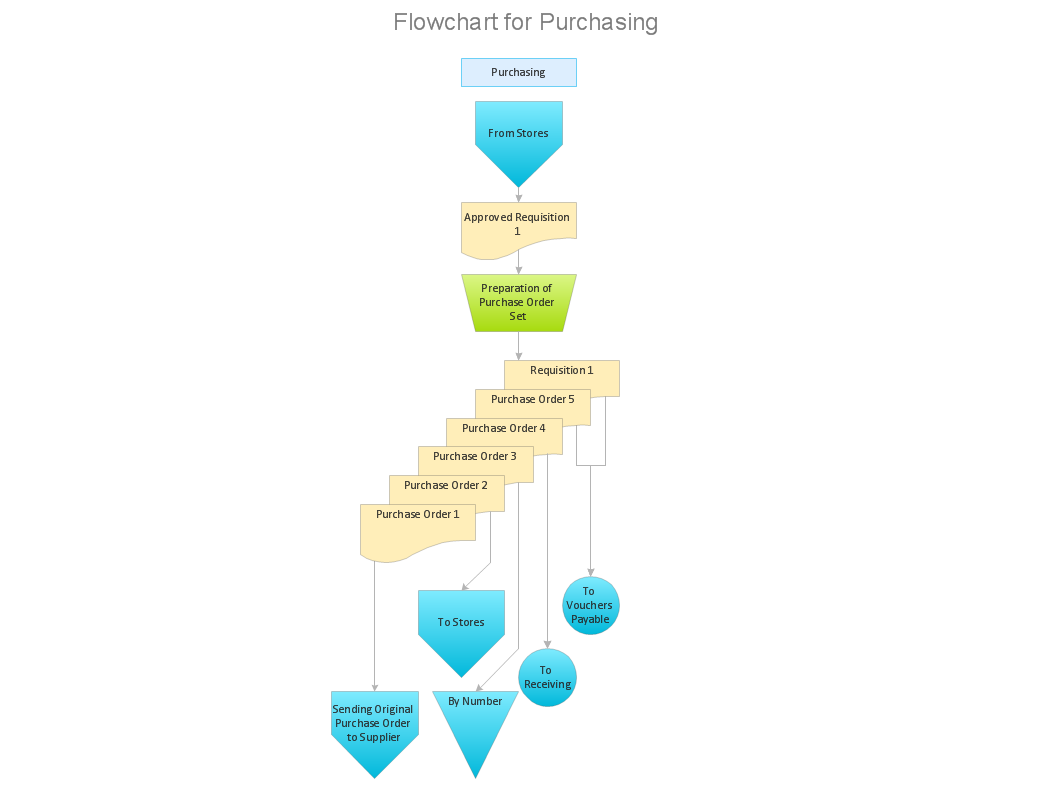
Picture: Workflow to Make a Purchase.Accounting Flowchart Example
Related Solution:
ConceptDraw
DIAGRAM 18