Workflow Diagram Software Mac
Workflow diagramming
Business Process Model and Notation, or BPMN, is well-known to be a graphical representation for specifying the business processes in a business process model, being developed by the Business Process Management Initiative and maintained by the Object Management Group. The Business Process Model and Notation is simply a standard for business process modelling, providing a graphical notation for specifying the business processes in a Business Process Diagram, based on a flowcharting technique very similar to activity diagrams from Unified Modelling Language, also known as UML. The aim of using BPMN is to support the business process management within some particular organization. It can be used by both business users as well as technical users in a way of providing a notation that is intuitive to the business users, yet able to represent complex process semantics.
The primary goal of Business Process Model and Notation is to provide a standard notation readily understandable by all business stakeholders, which includes the business analysts creating and refining the processes as well as the technical developers responsible for implementing these processes. The business managers are usually also involved in such processes, monitoring and managing them. Nowadays, there are a few competing standards for such business process modelling languages used by the modelling tools and processes. In 2014, BPMN was complemented by a new standard for building the so called “Decision Model and Notation standard” — the decision models.
BPMN was developed in order to support only the concepts of modelling, applicable to business processes, while other types of modelling done by organizations for non-process purposes were out of scope for BPMN. The examples of modelling excluded from BPMN are, nowadays, the organizational structures and the functional breakdowns, as well as “data models”. BPMN is known to be used to show the flow of data, such as messages, as well as the association of the data artifacts to activities, having its models consisting of the simple diagrams constructed from a fixed set of the design symbols. Using such models means simplifying the understanding of the business activities' flow and process for both business developers and business users. There are four basic element categories, used in BPMN, which are flow objects (such as events, activities and gateways), connecting objects (message flow, sequence flow, association), swim lanes (lane, pool), and artifacts (group, data object, annotation), used for enabling the creation of the simple business process diagrams, which also permit making new types of flow objects in order to make the diagrams more understandable.
The weaknesses of BPMN can relate to support for routine work, confusion and ambiguity in sharing BPMN models, support for knowledge work and support for decision-making business rules. Despite of the mentioned weaknesses, the Business Process Models are very widely used, especially in a way of the business process workflow diagrams, using the ConceptDraw DIAGRAM business process workflow diagrams software, that works on Mac providing the design objects as well as the pre-made examples of already existing business process workflow diagrams, such as the one, explaining the business process of purchasing the goods, when the money’s received and the manufacturing process takes place, getting through quality assurance to make sure that the final product is good enough for the customer. Going through “inventory” stage, the goods appear to be packed and shipped to the customer. The distributing process can involve logistic procedures, such as storing the produced goods at the warehouses and delivering them locally. In case the goods go abroad, they might be checked as the customs clearance point, but after being confirmed as safe at the customs and after paying all taxes, they can be simply taken by the client if he prefers to pick them up himself, meeting the requirements of his contract with the shipper.
ConceptDraw DIAGRAM is a Workflow Diagram Software, which can be used both on Windows and Mac, being a great alternative to MS Visio, but for Mac OS. Once you distil a particular business activity into a set of linear, then you can call this self-contained process a “workflow” one. This term is used for describing the transformation of materials through goods and services provided to a customer base.
The mentioned “workflows” can represent the abstract concepts as well as the development phases of a system, and, of course, the real-time processes, for example the processes of production or manufacturing, customs clearance, delivery or distribution, storing at the warehouses on the way to the customer, etc. The described representations all can be displayed in the way of creating the workflow diagram as well as the process flow diagram.
ConceptDraw DIAGRAM software is known to be the best Mac software for drawing such business process as well as workflow diagrams within any business activity. Rich with a set of samples and templates of the pre-made diagrams, having also the specific features for drawing such diagrams faster, makes this software very comfortable in use for its users to draw their own great looking as well as smart looking workflow diagrams.

Pic.1 Workflow Diagram Software Mac OS X
Using the ConceptDraw DIAGRAM professional Mac OS X software for drawing workflow diagram means ensuring yourself in getting the final professionally looking result within only a few hours, or even minutes, depending on the fact if you use the available for all ConceptDraw DIAGRAM users “Workflow Diagrams solution” with its stencil libraries and templates or not as well as how familiar you are now with the mentioned application. The solutions from this site can be also found in the ConceptDraw STORE application, as this tool was developed especially for the ConceptDraw DIAGRAM users to make their work with drawing the flowcharts, charts, diagrams, maps, schemes and other schematics, including the business process workflow diagrams, in a very short period of time getting a very good looking result.

Pic.2 Workflow diagram sample: business process.
This example shows a workflow diagram that clearly illustrates stages a business consists of and relations between all parts of business.
No other workflow software Mac OS X gives you all this:
- Design and document using a wide range of pre-drawn workflow symbols and smart connectors.
- Great value for the money, only $199 dollars.
- Free technology support.
- Free examples and built-in templates to help you draw workflow rapidly.
See also Samples:
NINE RELATED HOW TO's:An abstract representation is usually the first thing you will need while developing a database. To understand the ways that databases are structured, you should look through entity-relationship diagram examples and see the notations features and attributes. With an entity-relationship model you can describe a database of any complexity. This Entity-relationship diagram is a tool for software developers. It enables every element of database to be managed, communicated and tested before release. This ERD was created using symbols advocated by Chen's notation. Because of a linguistic origin of the Chen’s notation, the boxes representing entities could be interpreted as nouns, and the relationships between them are in verb form, shown on a diagram as a diamond. Picture: Entity Relationship Diagram ExamplesRelated Solution:Sales process management is a business discipline which focuses on the development and practical application of various sales techniques, and on the management of sales operations of the company.
It is effective to use professional software for the sales process management. ConceptDraw DIAGRAM diagramming and vector drawing software extended with Sales Flowcharts solution from the Marketing area of ConceptDraw Solution Park is the best choice.
 Picture: Sales Process ManagementRelated Solution:This sample was created in ConceptDraw DIAGRAM diagramming and vector drawing software using the Workflow Diagrams Solution from the Software Development area of ConceptDraw Solution Park.
This sample shows the Workflow Diagram that clearly illustrates stages a BPM consists of and relations between all parts of business. The Workflow Diagrams are used to represent the transferring of data during the work process, to study and analysis the working processes, and to optimize a workflow.
 Picture: Software Work Flow Process in Project Management with DiagramRelated Solution:The Event-driven Process Chain ( EPC ) Diagrams allows users present business process models in terms of work flows. The EPC diagram can show various ways for improvement throughout an organisation.
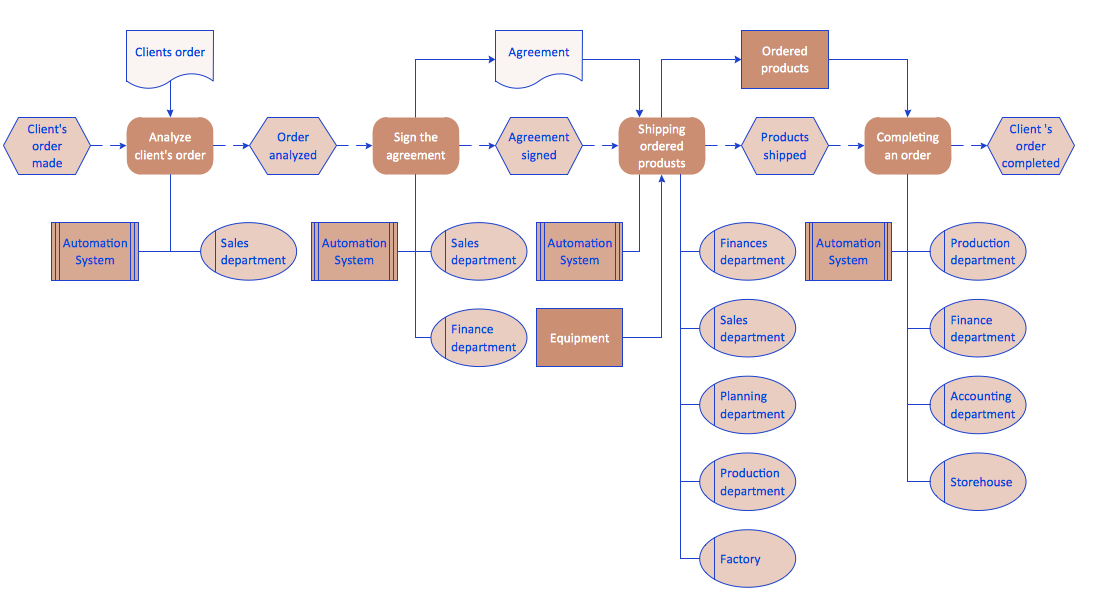 Picture: EPC Diagrams Illustrate Business Process Work FlowsRelated Solution:You need design the Marketing Organization Chart and look for effective software? Now it's incredibly easy to do this in ConceptDraw DIAGRAM which was supplied with Marketing Diagrams Solution from the Marketing Area of ConceptDraw Solution Park.
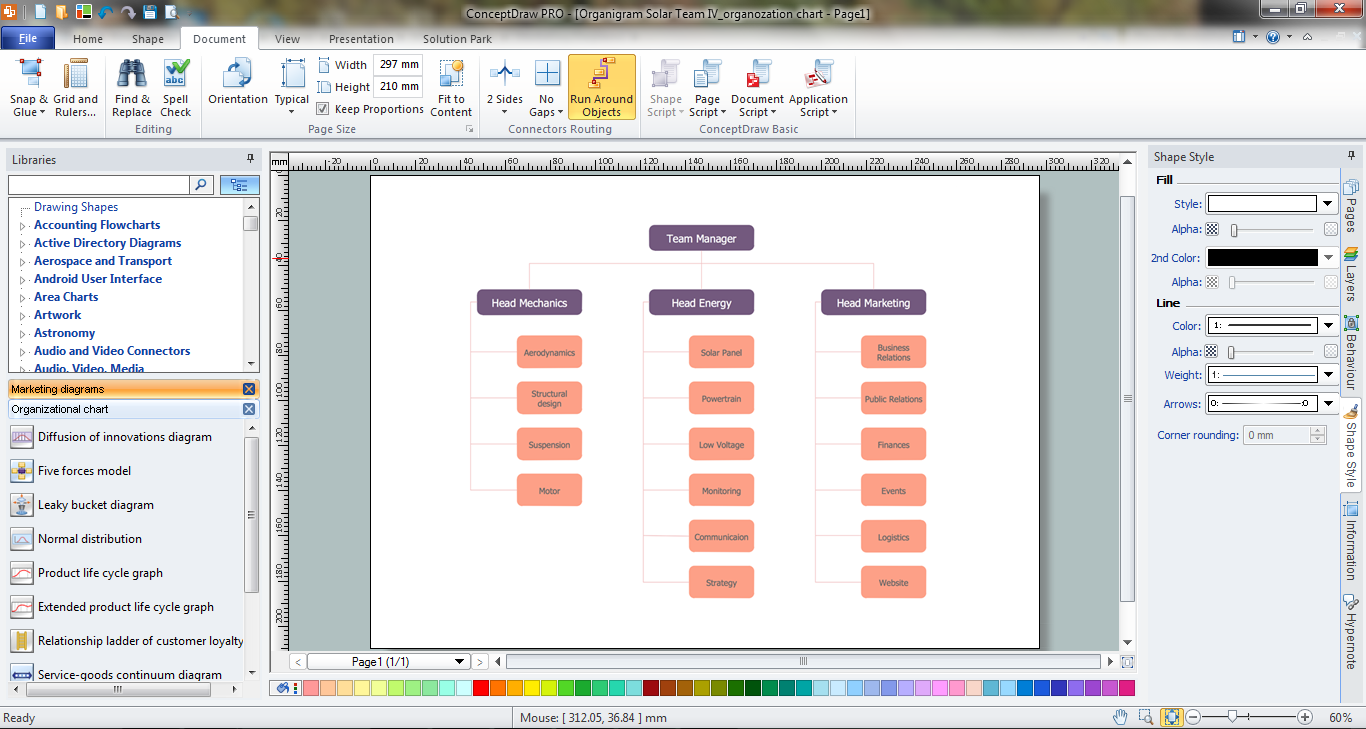 Picture: Marketing Organization ChartRelated Solution:The first step to optimize a workflow is to get its visual depiction. Then you can analyse and optimize the workflow making changes to your workflow diagram. We recommend to use ConceptDraw DIAGRAM software extended with the Workflow Diagram solution to visualize and optimize your workflow. It allows you produce easy-to-change scalable vector graphic workflow and then present it to your team or partners.
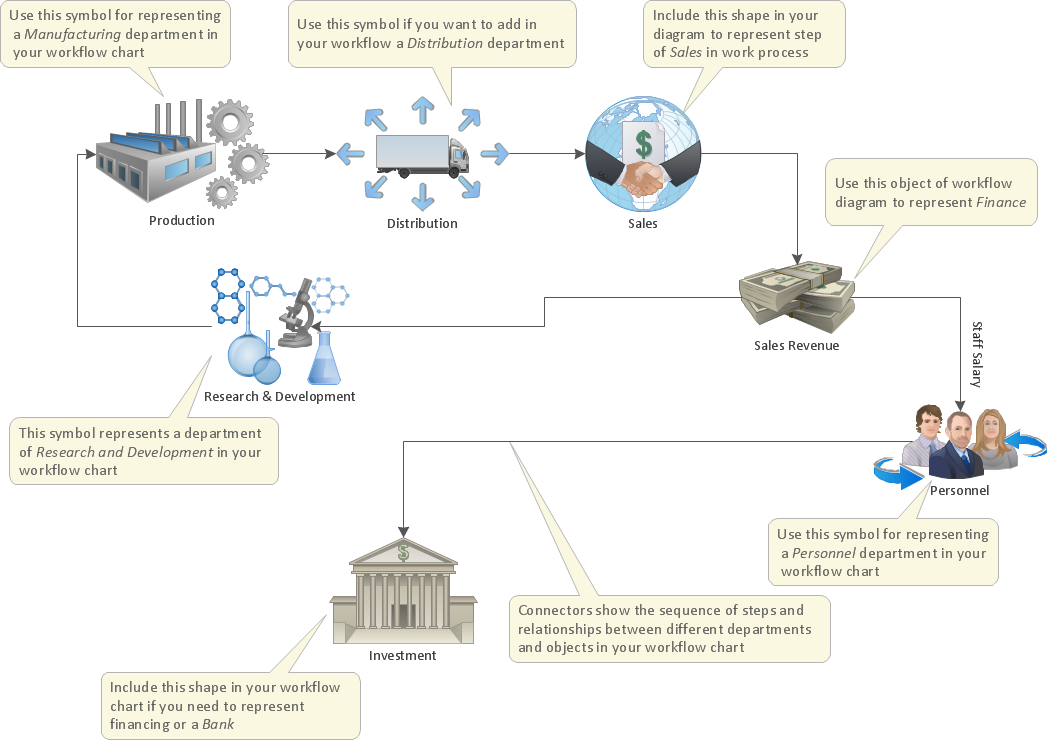 Picture: Optimize a WorkflowRelated Solution:In order to be successful, you have to promote your business on the market. One of the ways for planning this promotion is to create a social media DFD Flowchart which will contain all the details of your business strategy. Social media is a very influential tool, and it's a mistake to ignore it. The following flowchart represents a best way to estimate social media posts, and gives a strategy of responses. This flowchart is designed in the format of cross-functional flowchart. With this format, we can divide the process into three distinct phases. This approach helps to generate well-considered and balanced response on social networks activities. Using ConceptDraw solution for Social Media Response, your reaction to social media posts will positively mirror the values and mission of your business.
 Picture: How to Create a Social Media DFD FlowchartRelated Solution:ConceptDraw DIAGRAM is a powerful tool for drawing business communication ideas and concepts, simple visual presentation of numerical data in the Mac environment.
 Picture: Best Multi-Platform Diagram SoftwareRelated Solution:Activity Network Diagram - This sample was created in ConceptDraw DIAGRAM diagramming and vector drawing software using the Seven Management and Planning Tools solution from the Management area of ConceptDraw Solution Park. This sample shows the PERT (Program Evaluation Review Technique) chart of the request on proposal. A request for proposal (RFP) is a request of the company or the organization to potential suppliers to submit the business proposals for service or goods that it is interested to purchase. The RFP is represented on the initial procurement stage and allows to define the risks and benefits.
 Picture: Activity Network Diagram MethodRelated Solution:ConceptDrawDIAGRAM 18