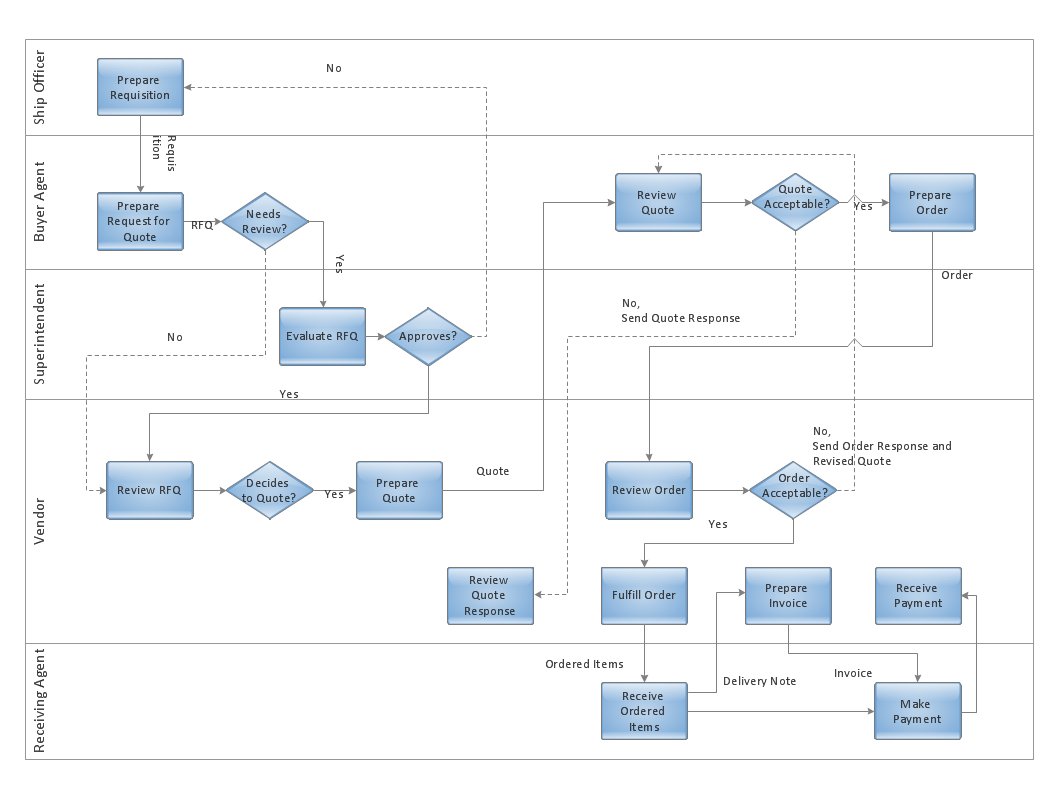
Sample 1. Deployment flowchart: Trading process.
Cross-functional (deployment) flowcharts visualize what functional units (people, departments or functional areas) are responsible for the business process operations.
The flowcharts are divided into rows/columns of functional units. Blocks of various shapes represent the process steps, and are placed in rows/columns of the responsible functional units.
These flowcharts are used to display the relationships of processes and responsible functional units.
See also Samples:
TEN RELATED HOW TO's:
Developing a software project supposes architecture first. To make it proper, you can use data flow diagram model in your current project.
The data flow diagram represents the Model of small traditional production enterprise that is made using Yourdon and Coad notation. It shows how the data is transfered through a process. According to the notation of Yourdon and Coad a process is represented by circles and data stores are drawn using parallel lines. This DFD was created using the ConceptDraw Data Flow Diagrams solution. Using this solution one can visualize data flow accordingly to the rules of two basic notations used for data flow modeling.
Picture: Data Flow Diagram Model
Related Solution:
Definition, examples, layout options, best practices, and common mistakes for cross functional flowcharts (swimlane diagrams).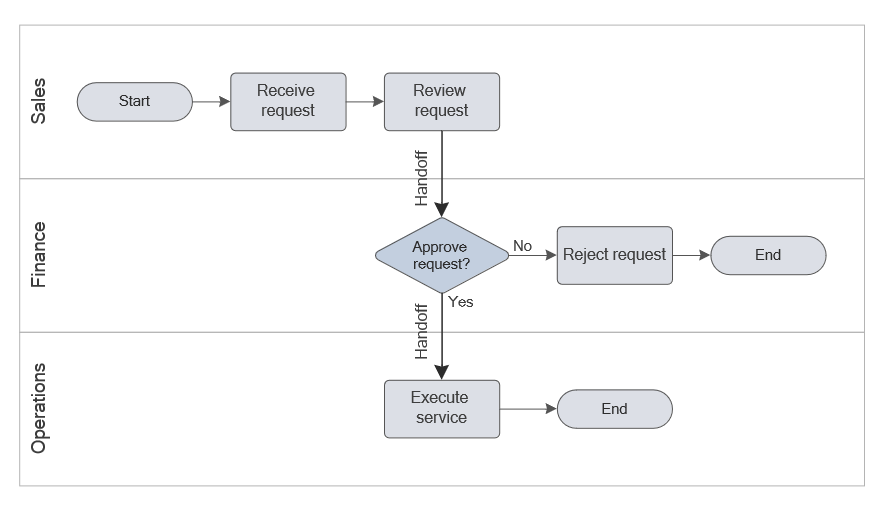
Picture: Cross Functional Flowchart (Swimlane Diagram): Definition, Structure, Examples, and How to Create
Related Solution:
Explore practical flowchart examples including business process diagrams, workflow charts, swimlane flowcharts, and IT troubleshooting flows. Review common patterns and start from ready templates.
Picture: Flowchart Examples
Related Solution:
ConceptDraw DIAGRAM is a powerful business and technical diagramming software tool that enables you to design professional-looking graphics, diagrams, flowcharts, floor plans and much more in just minutes. Maintain business processes performance with clear visual documentation. Effectively present and communicate information in a clear and concise manner with ConceptDraw DIAGRAM.
Picture: ConceptDraw DIAGRAM
In Cross-Functional Flowchart first step is to determine how many lanes you want to represent and what the lane titles will be. The choice of vertical or horizontal swim lanes landscape comes down to personal choice or just plain “what fits best”.
With ConceptDraw, we make that simple by including different swim lanes templates.
Professional looking examples and templates of Swimlane Flowchart which help you create Cross Functional Flowcharts rapidly.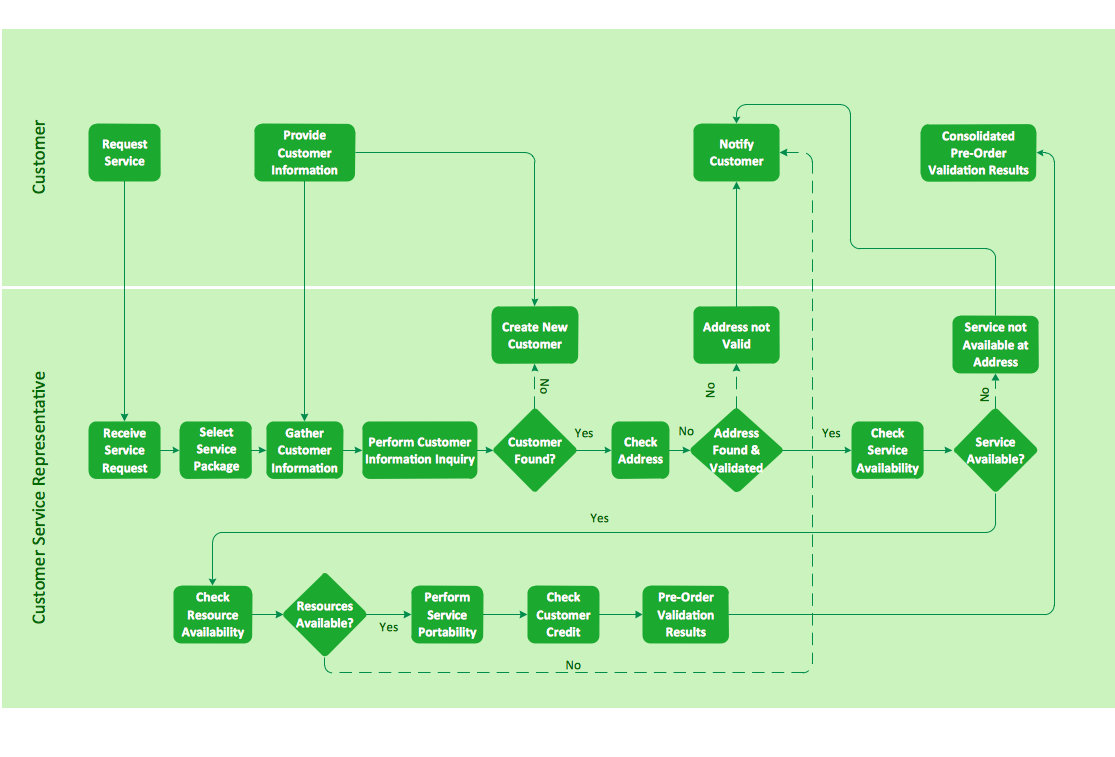
Picture: Cross-functional flowchart landscape, U.S. units
Accounting flowchart is a pictorial way to represent the flow of data in an organization and the flow of transactions process in a specific area of its accounting or financial department. Accounting Flowcharts solution contains the full set of standardized accounting flowchart symbols which will help you design in minutes various types of Accounting Flowcharts including such popular diagrams which represent the whole accounting process: Purchasing Flowchart, Receiving Flowchart, Voucher Payable Flowchart, Treasurer Flowchart, Payment Flowchart.
Picture: Accounting Flowchart Purchasing Receiving Payable and Payment
Related Solution:
Event-Driven Process Chain Diagrams for improvement throughout an organisation.
ConceptDraw DIAGRAM - software that reduces the time needed to create a business process model.
Picture: Graphical Symbols to use in EPC diagrams
Related Solution:
The Circular Arrows Diagrams are very popular in management and marketing. They are the useful way to visualize a sequence of steps, tasks, or events as a circular flow. But how design the Circular Arrows Diagram quick and easy? You will need a powerful software. ConceptDraw DIAGRAM charting and vector drawing software is exactly what you need. Extended with a multi-functional Business Diagrams solution from the Management Area, ConceptDraw DIAGRAM is the best for drawing the Circular Arrows Diagrams.
Picture: Circular Arrows
Related Solution:
A computer network diagram for a large network can be complicated and difficult both to understand and to draw. To learn how to deal with complex network diagrams, start with a basic network diagram, showing only the primary network devices and the connections between them. There are software tools to help you with that, such as ConceptDraw DIAGRAM , that include templates and examples for simple and common network diagrams.
The ConceptDraw solution for making computer network diagrams delivers over a thousand of vector objects, composed into the forty vector libraries that were developed to support drawing of professional-looking computer network diagrams. This diagram of computer network can be used by system administrator as a basic template for making the custom network diagram. Since the responsibilities of network or system administrator include documenting of computer network, drawing network diagrams is an important part of their work.
Picture: Basic Network Diagram
This sample shows the Flowchart of the testing the work of the lamp and decision making about what to do to lamp will work.
Picture: Samples of Flowchart
Related Solution: