Flowchart Design: Contoh Flowchart
You Need to Draw the Professional Flowcharts?
If you want to find a way to understand complex things in minutes, you should try to visualize data. One of the most useful tools for this is creating a Flowchart, which is a diagram representing stages of some process in sequential order.
A Flowchart is a graphical representation of the algorithm, process, or step-by-step solution of the problem, widely used in software development, engineering, business, analytics, education, science, marketing, manufacturing, government, politics, architecture, administration, and other fields.
Using your imagination, you can simplify your job or daily routine with Flowcharts. There are so many possible uses of Flowcharts and you can find tons of flow chart examples and predesigned templates on the Internet and in ConceptDraw DIAGRAM software.
ConceptDraw DIAGRAM app for drawing Flowchart allows you to draw the Flow Chart of any type and offers a lot of samples and examples of Flowcharts of various types. Find our Flowcharts solution, which includes Contoh flowcharts as well as other professionally looking practical samples and templates that you can modify, print, or publish on the web quickly and simply.

Example 1. Flowchart — Website launch
Flowcharts in Different Industries
Flowcharts are widely utilized across various industries and are invaluable tools in many of them, providing a clear and concise way to visualize processes and workflows. They help to improve efficiency, ensure smooth operations, identify potential issues and bottlenecks, reduce errors and are used as a perfect documentation tool.
Flowcharts play a crucial role in optimizing performance and achieving organizational goals in manufacturing, healthcare, IT, education, business, finance, engineering, and retail. They help to design and analyze mechanical, electrical, and other types of engineering systems, map out the production process, from raw material procurement to finished product delivery, optimize manufacturing processes and production lines, and ensure quality control.
IT professionals use Flowcharts to design and document software development processes, system architecture, and troubleshooting procedures. Flowcharts assist in visualizing algorithms, debugging codes, and managing project timelines. They are also used for network design, database management, and user interface planning.

Example 2. Cross-Functional Flowchart — Credit Approval Process
Flowcharts are used in business, finance sector, project management, risk assessment, and strategic planning. They assist in mapping out business processes, financial transactions, and decision-making workflows, identifying inefficiencies, improving customer service, and ensuring regulatory compliance.
In the retail industry, Flowcharts help to visualize the supply chain, identify areas for improvement, streamline operations, manage inventory, optimize sales processes, order processing, and enhance the customer experience.

Example 3. Flowchart — Planning Process
Flowcharts are used in project planning, design verification, and quality assurance. They help to illustrate complex concepts, standardize procedures, minimize errors, improve overall efficiency, and make educational materials easier for students to understand and memorize.
Being used in the healthcare industry, Flowcharts are essential for illustrating patient care processes, help healthcare providers understand and follow protocols, ensuring patient safety and compliance with regulations. They also help to streamline administrative tasks, manage patient flow, and improve communication among medical staff.

Example 4. Flowchart — Food Security Assessment
Importance of Flowcharts in Process Mapping
Inter alia, Flowcharts are indispensable tools for process mapping across various industries, optimization workflows, and achievement of greater efficiency due to their ability to:
- provide a visual representation of processes and enhance the clarity of complex workflows due to standardized notation;
- standardize procedures and ensure comprehensive understanding and consistency in how tasks are performed;
- document processes according to regulatory compliance, auditing and industry standards and regulations;
- ensure comprehensive reference for employees, especially during training and onboarding;
- support process improvement and effectiveness through analyzing Flowcharts, identification and reducing bottlenecks and inefficiencies, eliminating redundant steps, redesigning workflows, and streamlining operations;
- support evaluation of different scenarios and assessment risks ensuring efficient decision-making;
- improve communication and reduce the risk of misunderstandings.

Example 5. Cross-Functional Flowchart — Order Processing
Cross-functional Flowcharts
Being director and delegating your power it’s always important to observe those who are responsible for their tasks. It is sometimes difficult to keep track of who is responsible for each step. Cross-functional Flowcharts are a special type of diagrams that describe a process in which a number of different people, departments, or functional areas are involved.
Dividing Flowcharts into columns is very useful in order to analyze the number of times a process is handed over to different people. Using Cross-functional Flowcharts to depict each of your employees’ work with the help of ConceptDraw DIAGRAM diagram flow maker is fast and simple as always!
The schematic drawing is perfect for visualizing operations of your business process flow, observing all responsible people from each of the existing departments as well as all operations at once. Diagram relationships between your business process and those who have to make it work smoothly by making horizontal and vertical Flowcharts, such as Top-down flowchart, Process flowchart, Workflow, Block diagram, State change chart, and Process map.
Cross-functional Flowcharts are often used to show the relationships between a business process and the functional units (such as departments) responsible for that process. To be able to make the Cross-functional Flowchart it is better to use a cross-functional flowchart software ConceptDraw DIAGRAM that allows to visualize and communicate the operations of a business process flow step-by-step, with responsible people or departments for each operation.
Find out how to make Flowchart using already existing examples and layouts to do that easily and in short terms. Take it easy as you can make your business work by spreading the right people all over departments and make sure they do their job with the help of our software which will become your best assistant soon!

Example 6. Flowchart — HR Management Process
Steps to Create a Flowchart
Wondering how to create Flowchart? Easily follow the next simple steps:
- define the process boundaries with starting and ending points;
- clearly define each step in the process;
- identify time lags and non-value-adding steps;
- open a ConceptDraw DIAGRAM new document;
- select the Flowchart library and add the proper flowchart elements to the diagram by dragging them from the libraries to the document page;
- add relationships and complete the big picture before filling in the details;
- in order to make a Flow diagram successful we recommend using bright colors, as the colored Flowcharts are visually more attractive;
- use the legend to add additional or explanatory information to your Flowchart.

Example 7. Flowchart — Selection Sorting Method
ConceptDraw DIAGRAM Software for Flowchart Design
Flowcharts solution from the Diagrams area and Cross-Functional Flowcharts solution from the Business Processes area of ConceptDraw Solution Park will help you design the Flowcharts and Cross-functional Flowcharts of any complexity, as well as Contoh flowchart quick and simple. The solutions provide a wide variety of templates and samples. Any of them can be quickly modified according to your needs.
Designing your own Flowcharts de novo or using the predesigned templates or samples as the base, use the vector objects from the Flowchart, Flowcharts Rapid Draw, Cross-Functional Flowcharts, and CH-1 Symbols libraries from the listed solutions.
Our Flowchart and Flowcharts Rapid Draw stencil libraries full of design elements from the Flowcharts solution will be useful for those who intend to draw great-looking Flowcharts including Contoh charts, having the final result looking simply professional and smart.

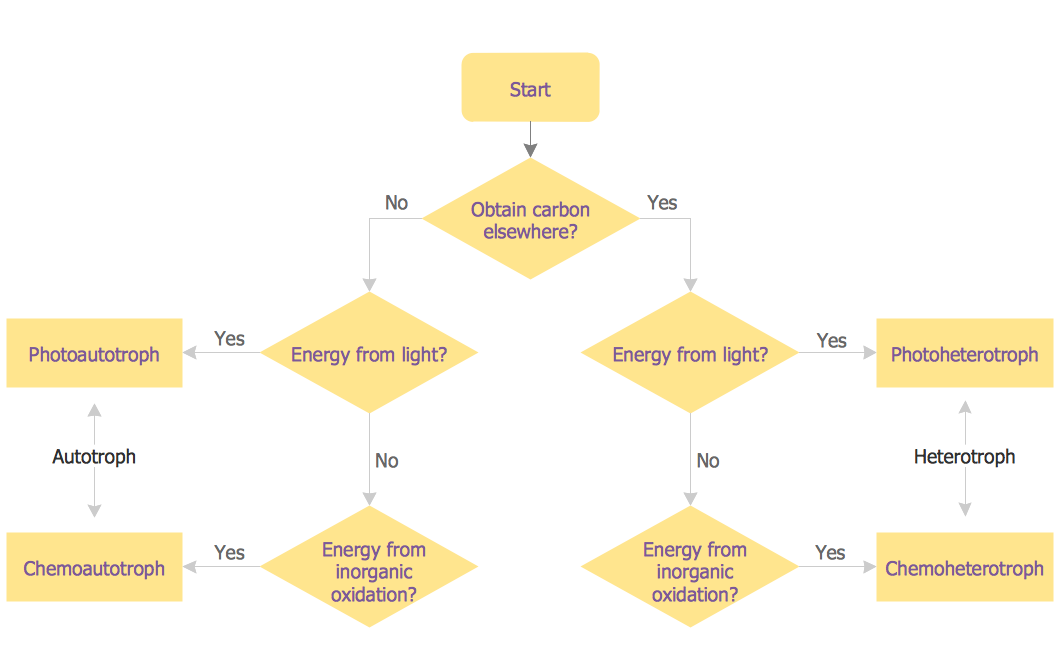
Example 8. Flowchart — Synthetic Object Construction
Conclusion
ConceptDraw DIAGRAM flowchart program contains libraries and templates for Audit flowcharts, Data Flow Diagrams, Cause & Effect Diagrams, Cross-functional Flowcharts, and more Flowchart types. It is the best tool for Flowchart diagram. Using it making any of the needed Flowcharts is always possible in a very short time as long as you have all the needed libraries full of stencil elements in order to make the final result look simply great, sophisticated, and unique.
Use the ConceptDraw DIAGRAM flowchart creator with Flowcharts and Cross-Functional Flowcharts solutions to create your own professional-looking Contoh flowcharts in minutes. The Flowcharts produced with ConceptDraw DIAGRAM are vector graphic documents and are available for reviewing, modifying, and converting to a variety of formats (image, HTML, PDF file, MS PowerPoint Presentation, Adobe Flash, or MS Visio).