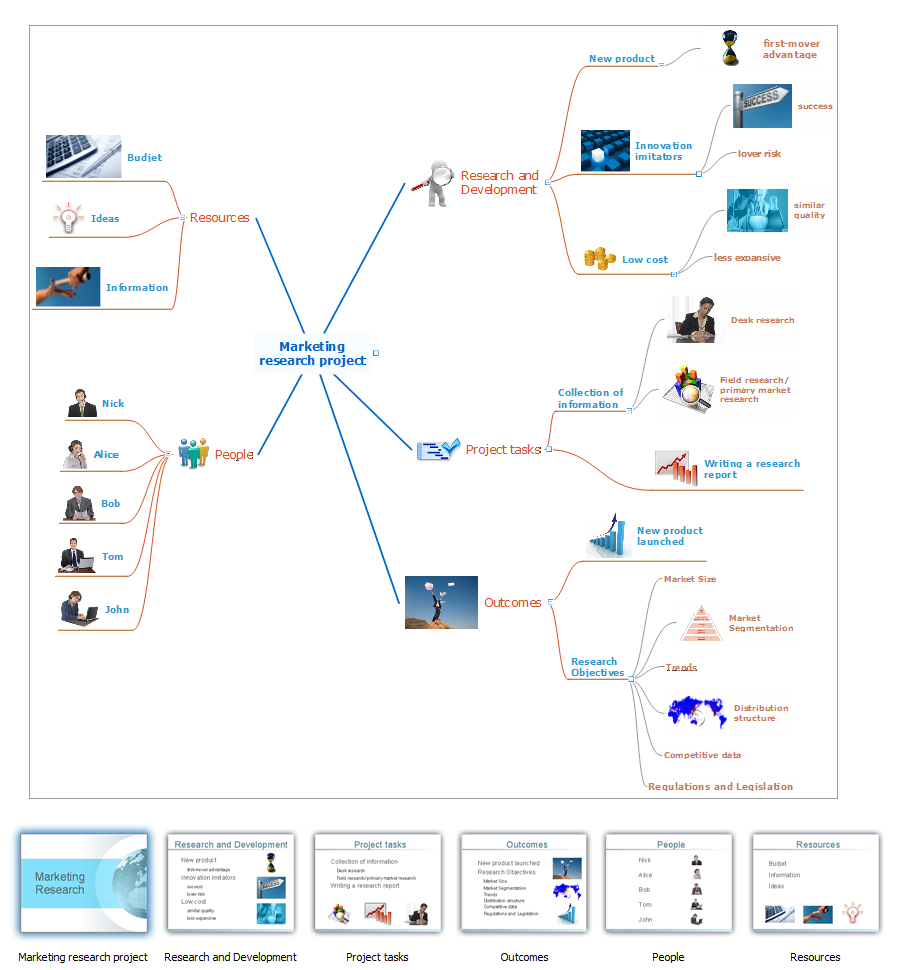
Sample 1. Mind map presentation - Marketing research project.
Presentation Exchange solution extends ConceptDraw MINDMAP with the ability to import presentations from Microsoft PowerPoint, as well as enhancing its existing presentation capabilities.
With the Presentation Exchange solution you can easily extract the content from a PowerPoint presentation to see how it all fits together in a single view. You can review slide content, see how the slides support one another, and refine the story.
TEN RELATED HOW TO's:
If you have doubts about some situation, there are tools that might help you. First used in the Stanford Research Institute in the 60s, SWOT analysis is a great solution and if you need to build a strategy, this tool is very effective. As a result, you will get the clear idea of all the opportunities and threats you might face.
This matrix was build for a TOWS analysis performance. A TOWS analysis includes the same process of listing strengths, weaknesses, opportunities and threats as a SWOT analysis. But, unlike SWOT, TOWS analysis primarily takes into account threats and opportunities and then at least - weaknesses and strengths. This is also a is a strategic planning tool. Beyond making a matrix, the strategy manager should investigate ways the organization can take edge of opportunities and reduce threats by turning to advantage strengths and weaknesses. Making SWOT and TOWS analysis uses the same approach and outputs close results. ConceptDraw SWOT and TOWS Matrix Diagrams solution supplies templates of matrices, that help to list clearly the constituents of SWOT and TOWS analysis.
Picture: SWOT Analysis Solution - Strategy Tools
ConceptDraw MINDMAP is a powerful business and personal productivity software application that provides visual organization and access to information for individuals and organizations.
Picture: ConceptDraw MINDMAP :Brainstorming, Mind Mapping for macOS and Windows
ConceptDraw DIAGRAM diagramming and vector drawing software offers the Timeline Diagrams solution from the Management area which is rich for the timeline examples, samples, templates and ready-to-use vector shapes.
Picture: Timeline Examples
Related Solution:
Create flowcharts, org charts, floor plans, business diagrams and more with ConceptDraw DIAGRAM.
Picture: Simple Diagramming
Related Solution:
ConceptDraw offers you a number of ready-made organizational chart templates which you can use in your drawing. They are grouped in topical sets as organizational chart template files.
Use the Organizational Charts Solution for ConceptDraw DIAGRAM to create your own Organizational Charts of any complexity quick, easy and effective.
The Organizational Charts designed with ConceptDraw DIAGRAM are vector graphic documents and are available for reviewing, modifying, converting to a variety of formats (image, HTML, PDF file, MS PowerPoint Presentation, Adobe Flash or MS Visio XML), printing and send via e-mail in one moment.
Picture: Organizational Chart Templates
Related Solution:
Unfortunately, a man can’t predict the future and no one is safe from natural disasters, such as floods, earthquakes, hurricanes or fires. Nonetheless, what you can do to ensure safety for you and your relatives is to create an emergency plan, so everyone will know what to do if emergency happens. Keep that plan simple and train it several times a year so that no one could forget any details of it.
Fire and emergency plans are important to supply people with a visual safety solution. This diagram presents a set of standard symbols used to depict fire safety, emergency, and associated information. Using clear and standard symbols on fire emergency plans provides the coherence of collective actions , helps to avoid embarrassment, and improves communications in an emergent situation. The fire emergency symbols are intended for the general emergency and fire service, as well as for building plans ,engineering drawings and insurance diagrams. They can be used during fire extinguishing and evacuation operations, as well as trainings. It includes vector symbols for emergency management mapping, emergency evacuation diagrams and plans.
Picture: Emergency Plan
Related Solution:
It is convenient to use a powerful ConceptDraw DIAGRAM software extended with Flowcharts Solution to design flowcharts of various types which will additionally illustrate a definition flowchart.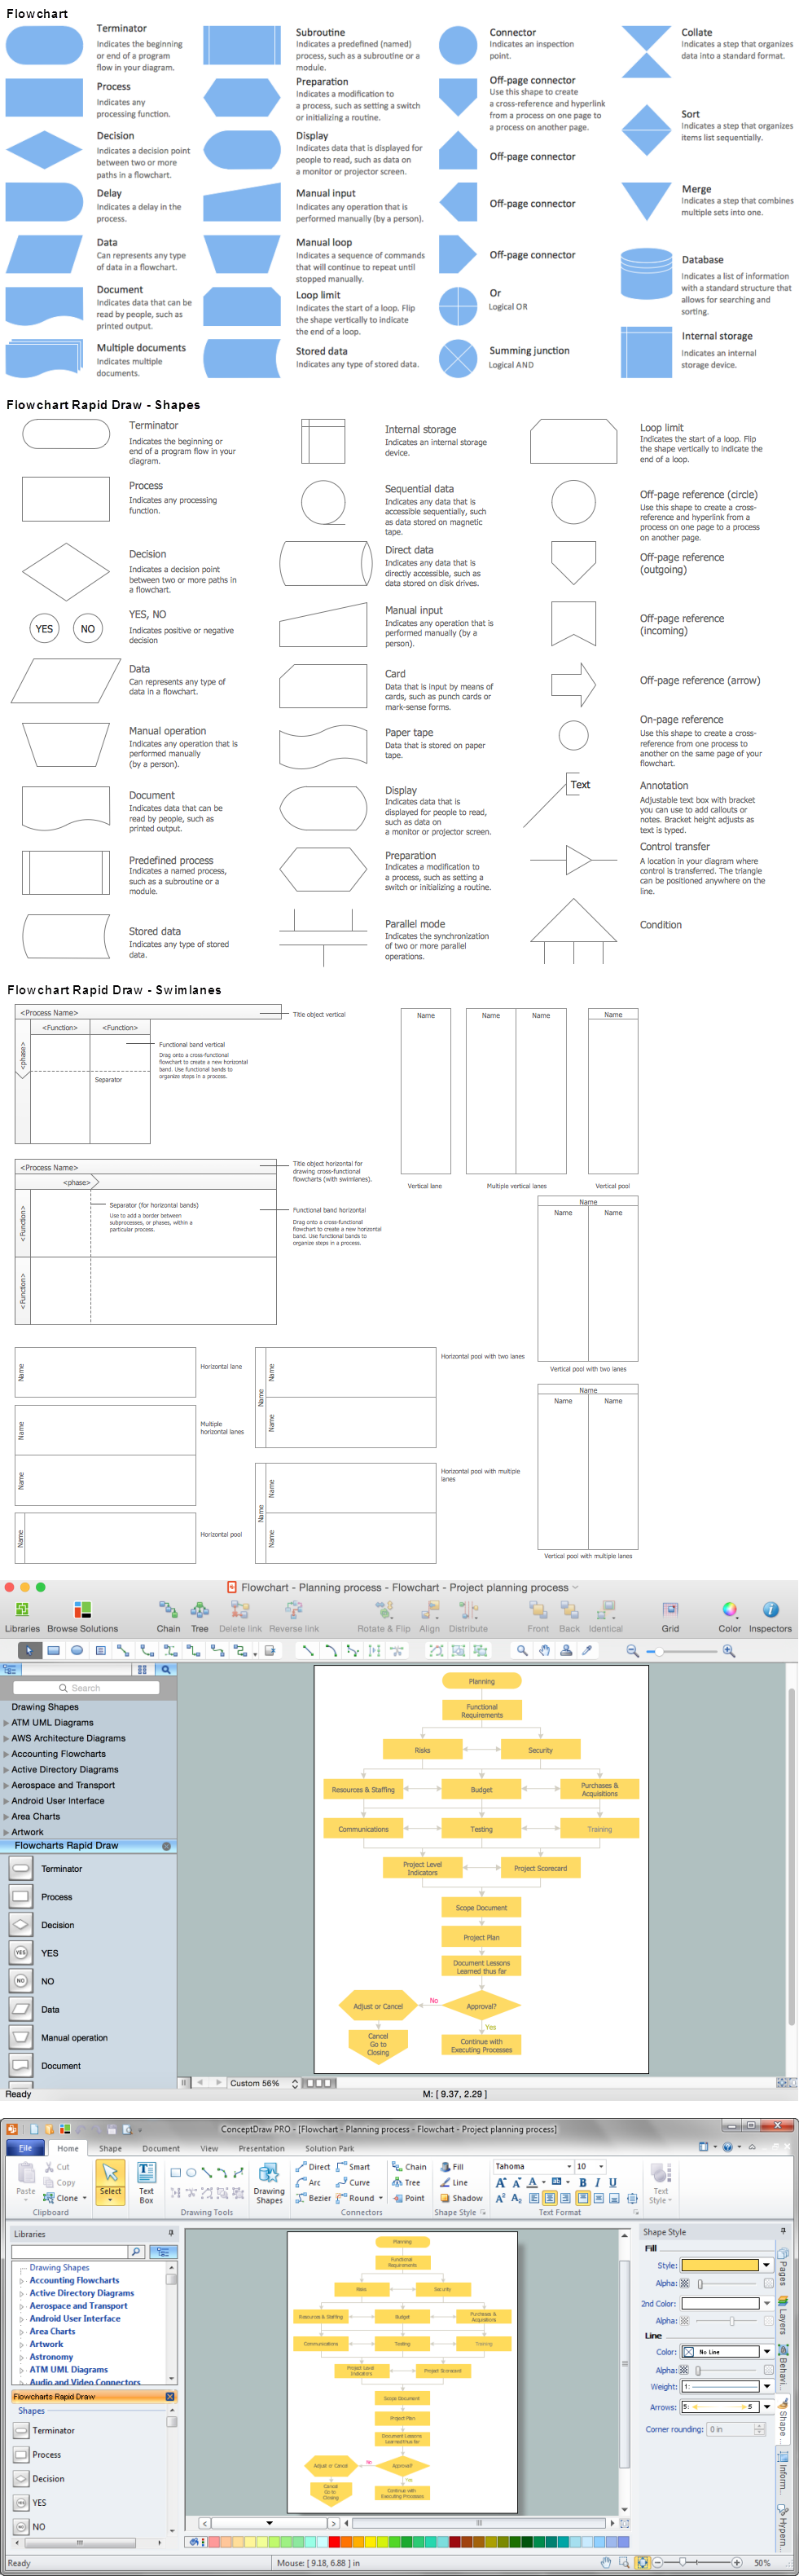
Picture: Definition Flowchart
Related Solution:
Creating diagrams and schemes is a pleasure with proper software. You don’t need any additional skills to create organizational chart quick and effectively with our diagramming tool. Create your ConceptDraw account today and start your diagramming experience.
This is the most regular type of organizational chart - hierarchical. It is created using the ConceptDraw Organizational Charts solution. Its composition can be displayed as a pyramid, with an only person in authority at the top, with sub-levels of management below them. According to hierarchy, an employee communicates only to his immediate head or subordinates. A hierarchical organizational structure may be choice for a businesses that work on multiform markets or any other organization that has a workflow requiring a multilevel structure of middle management.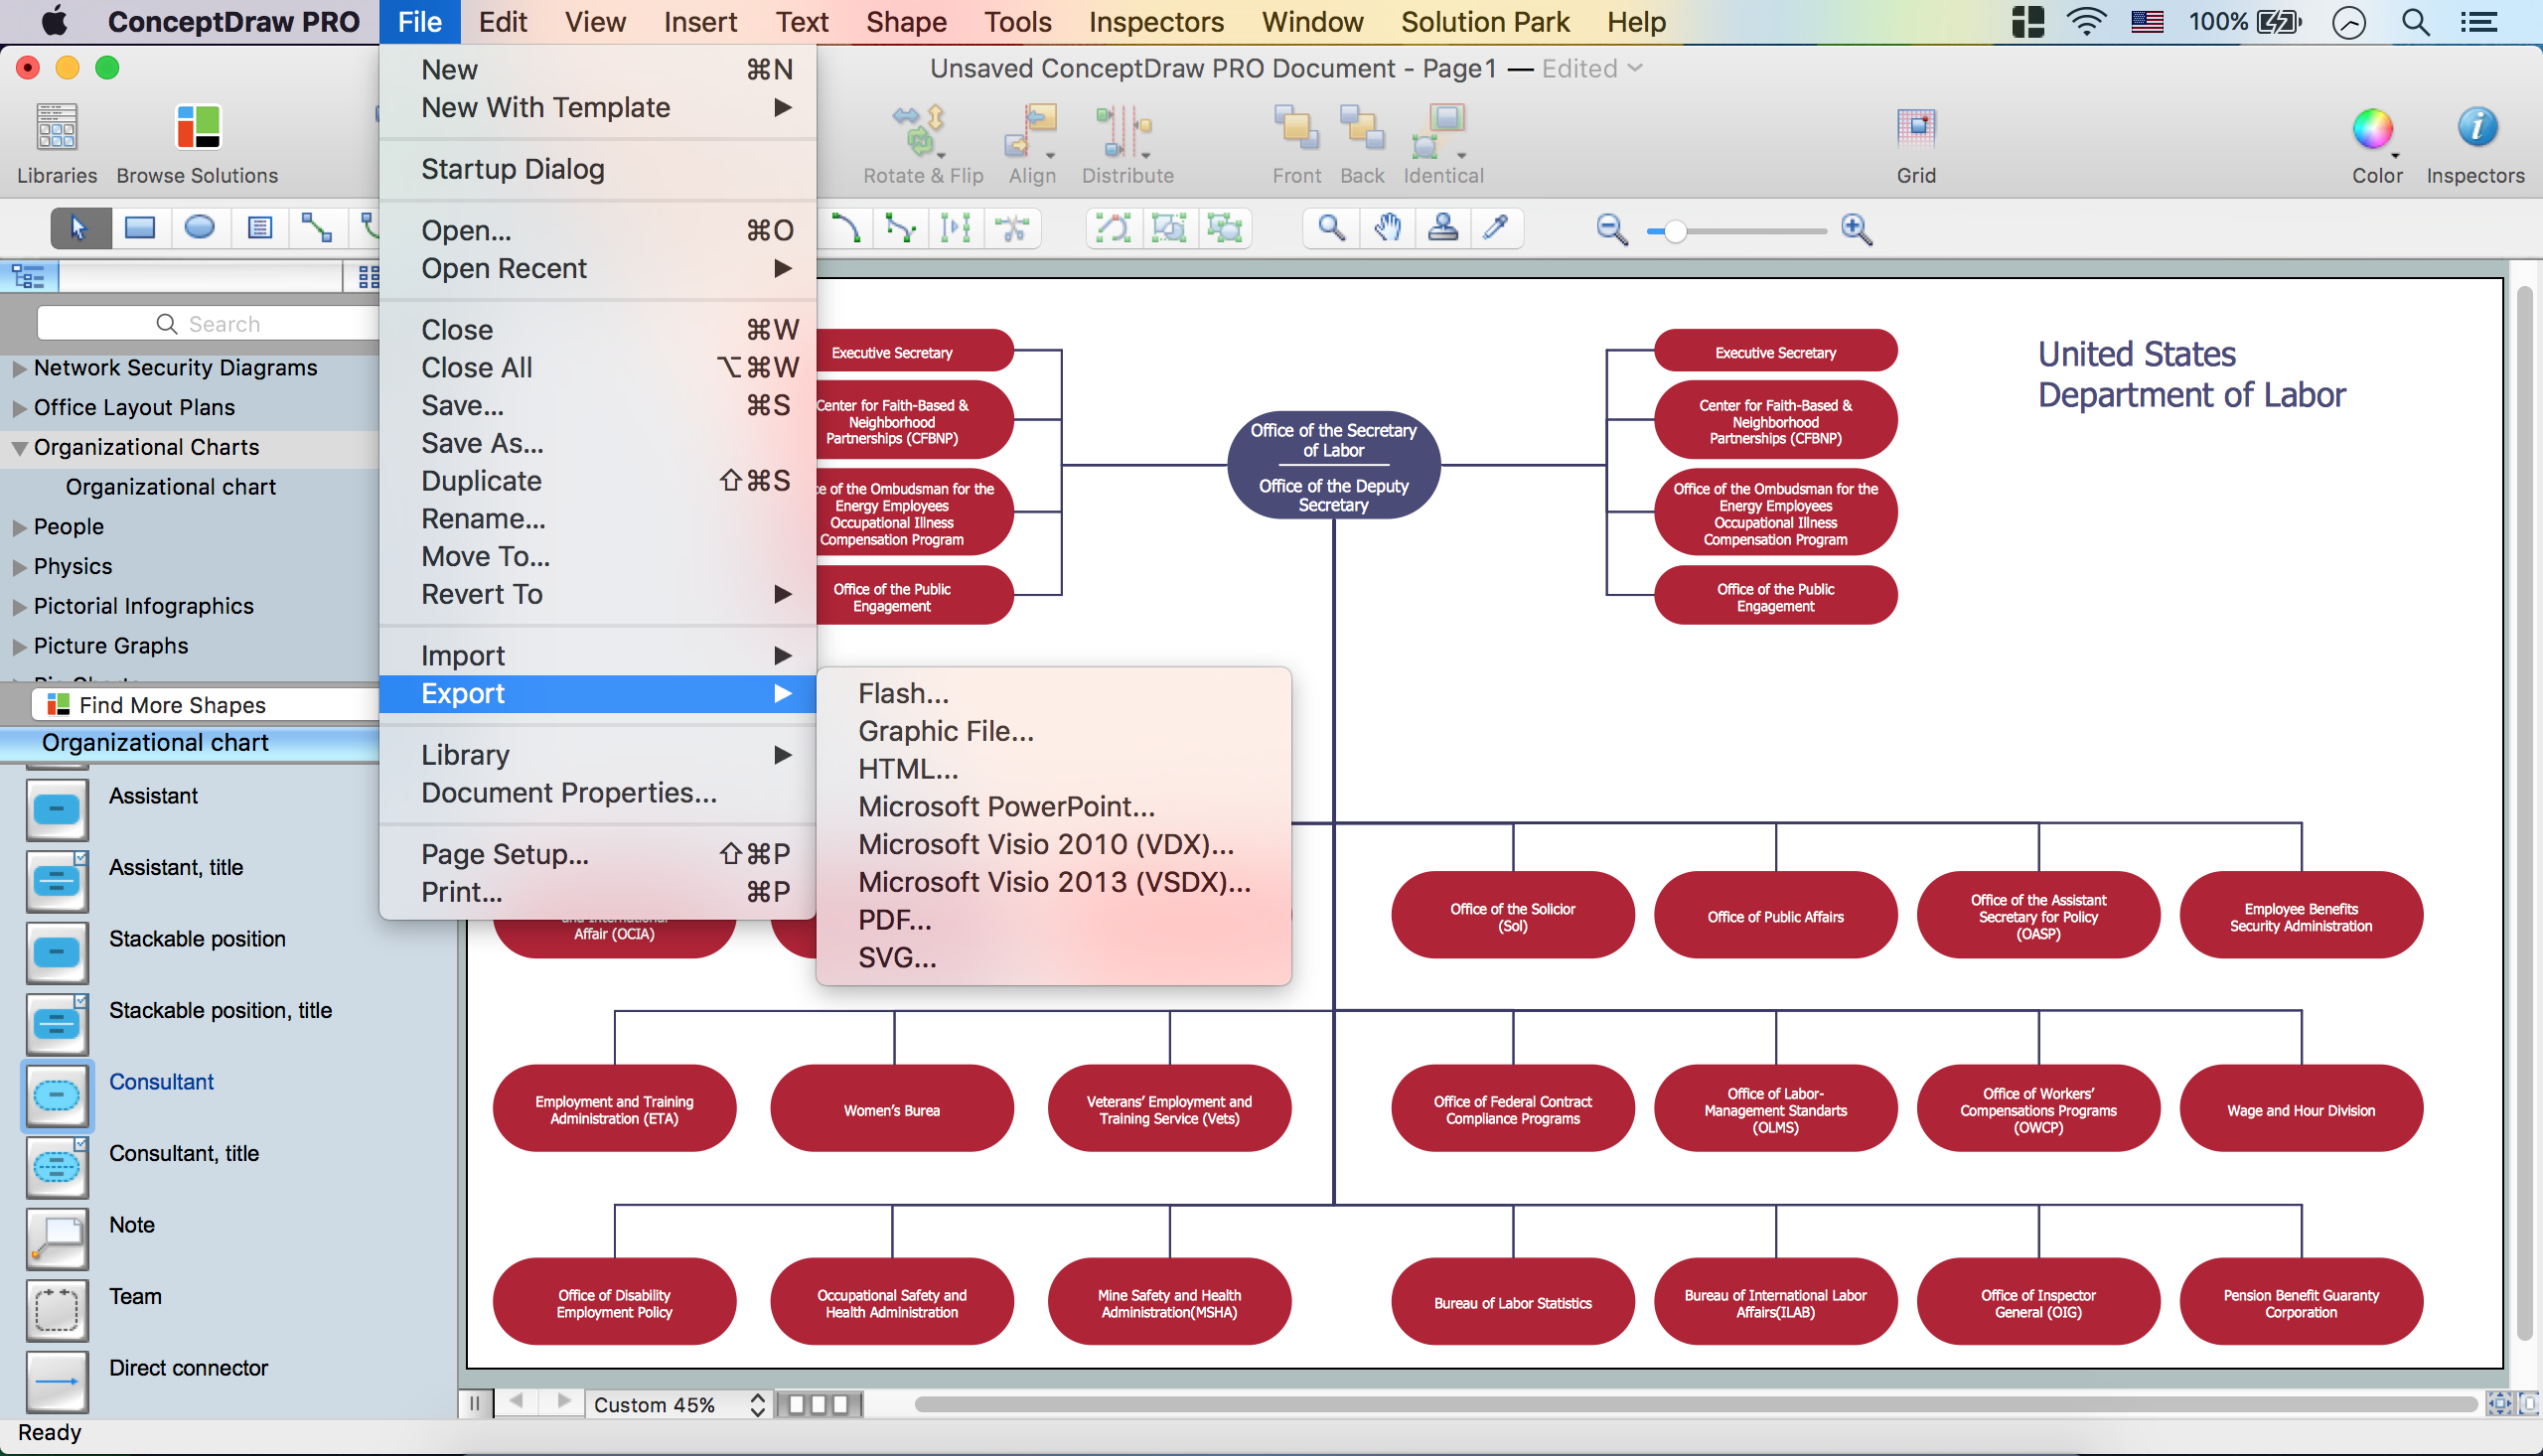
Picture: Create Organizational Chart
Related Solution:
Design efficiently the technical flow charts in ConceptDraw DIAGRAM software for various fields and provide ✔️ clarity, ✔️ accuracy, ✔️ usability, ✔️ simple communication, analysis, and improvement
Picture: Technical Flow Chart Example
Related Solution:
The Total Quality Management Diagram solution helps you and your organization visualize business and industrial processes. Create Total Quality Management diagrams for business process with ConceptDraw software.
Picture: Organizational Structure Total Quality Management
Related Solution: