Flow Chart for Olympic Sports
Sports Selection Flow Chart
ConceptDraw DIAGRAM is a powerful flowcharting software. Flowcharts Solution from the “Diagrams” Area will help you draw the Flow Charts of any complexity and on any theme quick, easy and effective.

Example 1. Flow Charts Software
Olympic Sports are widely popular, and it is also very interesting subject for various articles and illustrations. Using the Flowchart and Flowcharts Rapid Draw libraries with extensive set of objects, you can design the Flow Chart for Olympic Sports in minutes.
The Winter Sports helps you to quickly create your own original winter sports illustrations and infographics, presentation slides, website, flowchart and blog pages.

Example 2. Clipart from the Winter Sports
If needed, you can also add the clipart from the Winter Sports Solution, and don’t afraid to use the colors – they help to make your flow charts more attractive and successful.

Example 3. Sports selection flow chart
This sample was created in ConceptDraw DIAGRAM using the Flowcharts Solution from the Marketing Area and shows the Flow Chart of sport selection. An experienced user spent 10 minutes creating this sample.
Use the Flowcharts Solution for ConceptDraw DIAGRAM to create your own professional looking Flowcharts on any themes quick, easy and effective.
The Flowcharts designed with ConceptDraw DIAGRAM are vector graphic documents and are available for reviewing, modifying, converting to a variety of formats (image, HTML, PDF file, MS PowerPoint Presentation, Adobe Flash or MS Visio), printing and send via e-mail in one moment.
TEN RELATED HOW TO's:
Steps in the Accounting Process - The Accounting Process is a sequence of organization activities that is used for gaining quantitative information about the finances. This complex process consists of a set of sequential steps.
9 steps in the accounting process: Analysis of Business Transactions, Make Journal Entries, Post to Ledger Accounts, Prepare Trial Balance, Make Adjusting Entries, Adjusted Trial Balance, Prepare Financial Statements, Close Accounts, Post-Closing Trial Balance.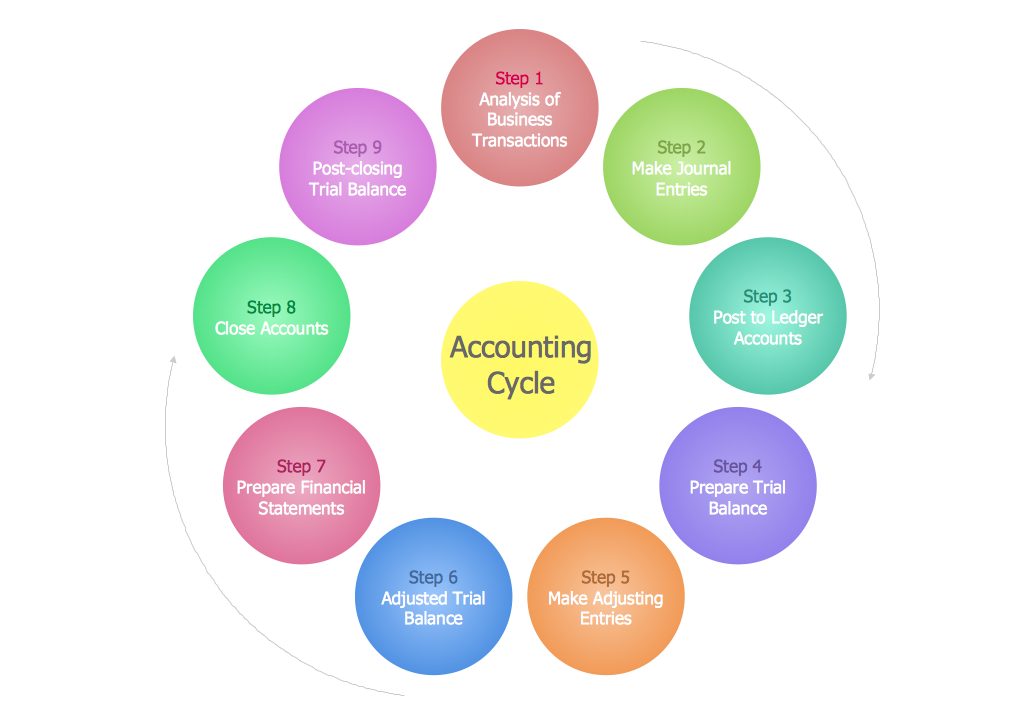
Picture: Steps in the Accounting Process
Related Solution:
To create an Audit Process FlowChart you only need Conceptdaw Software.
Picture: Basic Audit Flowchart. Flowchart Examples
Related Solution:
Nowadays, any architect or landscape designer can't do without a pack of digital tools for designing and projecting. Thus, there will be no problem to develop any landscape architecture plan with ConceptDraw DIAGRAM , especially since there are so many ready-to use templates and examples included. It's just as easy as drawing sketches on paper.
If you using ConceptDarw DIAGRAM there is no needs to have a professional skills on landscape and garden design. As well as you don't need to be an expert in architectural charts and plans drawing. The all you need is the Landscape and Garden solution. This solution contains a unique collection of the professional designed vector objects depicting flower and grass, bushes and trees, garden furniture, pools and accessories. In one word - the full set of graphical elements enabling to focus on the creativeness while creating your landscape and garden plan.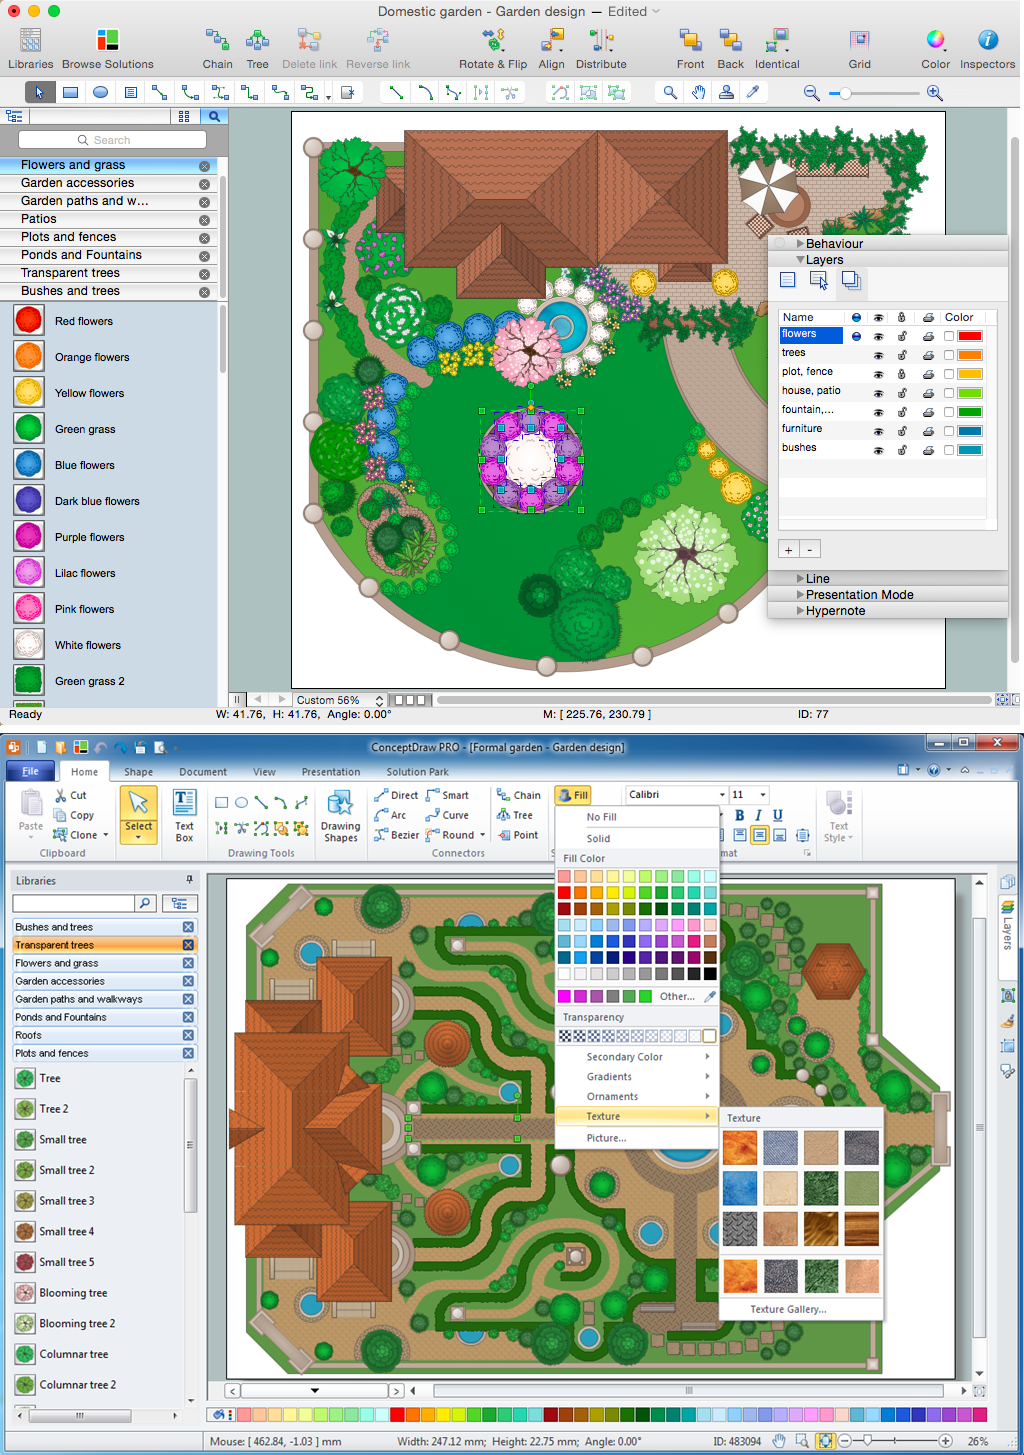
Picture: Landscape Architecture with ConceptDraw DIAGRAM
Related Solution:
When deciding to start your own business, you have to take into account a bunch of different aspects. One of the ways to get inspired is to look through various restaurant floor plans samples or interior photos of already known establishments. This will help you, but keep in mind that a really unforgettable establishment must be unique.
This restaurant floor plan diagram was designed using ConceptDraw Cafe and Restaurant Floor Plan solution. It can be used as a sample while considering a custom restaurant design. With the help of this example you can estimate the amount of furniture best for a dining room or kitchen of the restaurant. In addition, this plan would be useful as a check list when you will consider a list of the furniture and equipment needed for all areas of the future restaurant.
Picture: Restaurant Floor Plans Samples
Related Solution:
You need design the Marketing Plan Infographic and dream to find the useful tools to draw it easier, quickly and effectively? ConceptDraw DIAGRAM offers the unique Marketing Infographics Solution from the Business Infographics Area that will help you!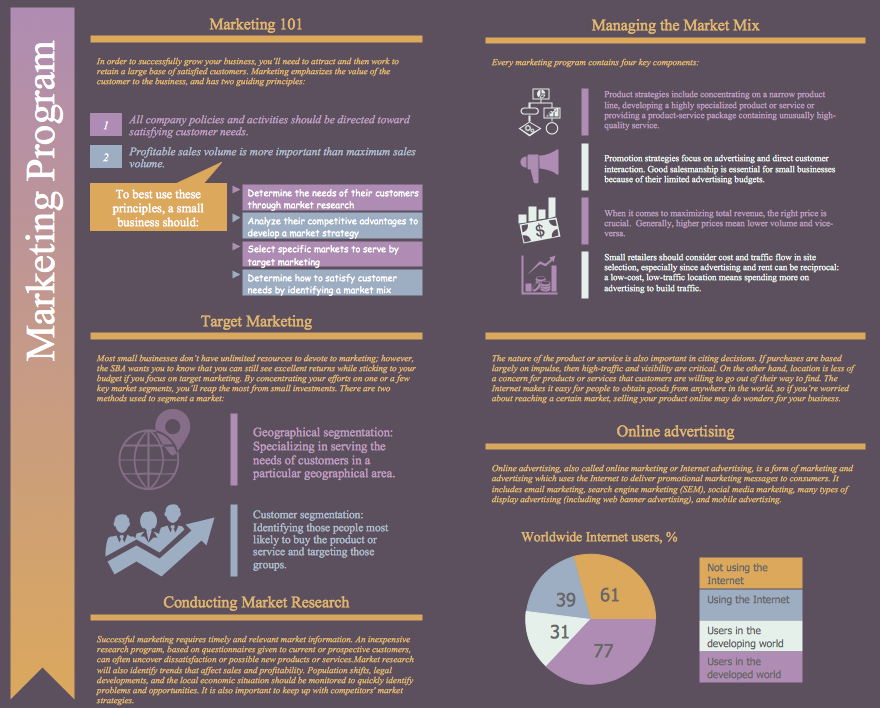
Picture: Marketing Plan Infographic
Related Solution:
Process mapping helps with sharing business results and reorganizing workflow. In almost every case, after creating a sales process flowchart the steps that are redundant become obvious for a manager. It's easy to find a flowchart examples that will help in developing one for your business.
This sales process flowchart consists of a sequence of steps that represent a simple sale process. Each step is shown graphically by a rectangle representing processing steps or an activity, or a diamond representing a decision. These rectangles are linked by arrows, that indicate the direction of the sales workflow. ConceptDraw Sales Flowcharts solution delivers a the full set of classical flowchart notation symbols, along with sales-related icons and pictograms.
Picture:
Sales Process Flowchart
Flowchart Examples
Related Solutions:
The Winter Sports solution from Sport Area of ConceptDraw Solution Park contains winter sports pictogram you may use illustrating any kind of material about Olympic Games or any other sport competitions.
Picture: Winter Sports.Using Winter Sports Design Elements Producing Infographics
Related Solution:
Diagramming is an astonishing way to visualize business processes. The list of the most common business process flowchart symbols is quite long starting from basic flowcharts, continuing with SIPOC diagrams. Business process modeling was never easier than now, with special ConceptDraw Business Process Mapping solution.
To carry out all professional standard requirements for business processes mapping, it is necessarily to follow the special graphical notations. ConceptDraw Business Process Mapping solution offers an exhaustive suite of tools to aid business process mapping. There are three vector libraries SIPOC Diagrams, Business Process Flowcharts, and Swim Lanes that contains totally more than 50 symbols of standard BPM notations. This is all that professionals need to effectively evaluate and manage quality in business processes.
Picture: Business Process Flowchart Symbols
Related Solution:
Do you like infographics and data visualization? Creating infographics is super-easy with ConceptDraw.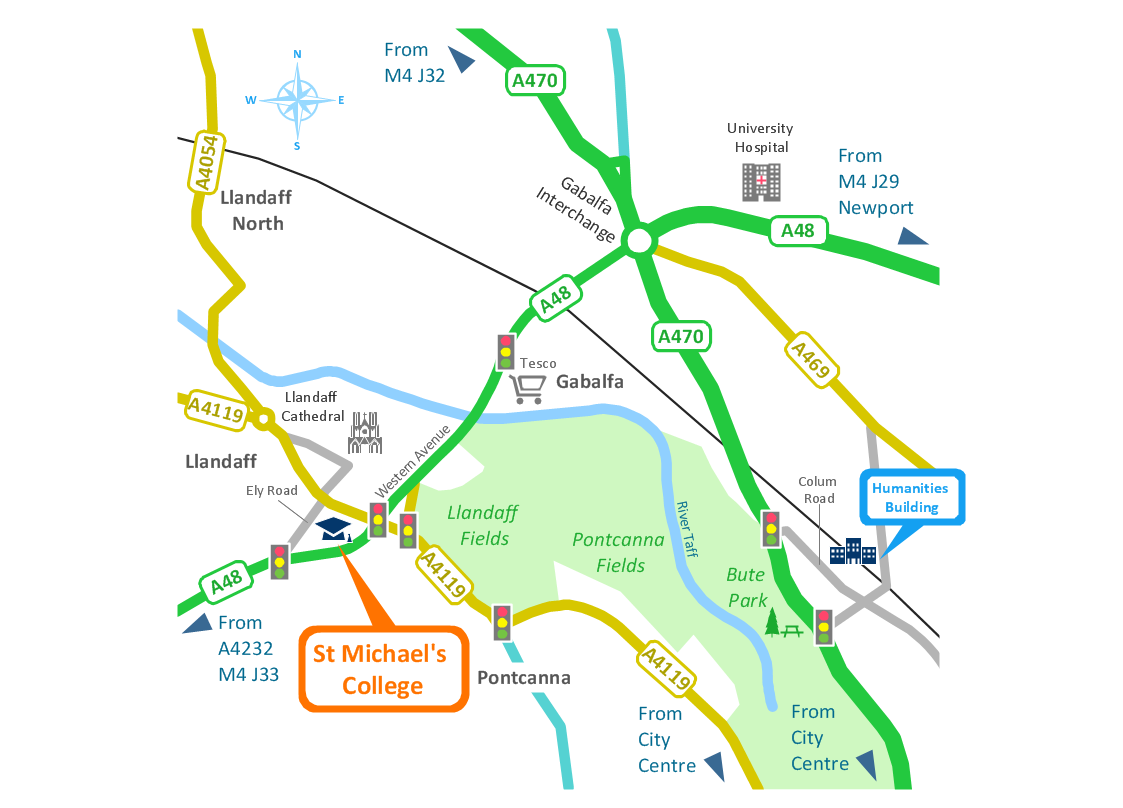
Picture: Spatial infographics Design Elements: Transport Map
ConceptDraw DIAGRAM extended with Pictorial Infographics Solution is the best for Spatial Data Analysis. You have a perfect possibility to make sure this right now.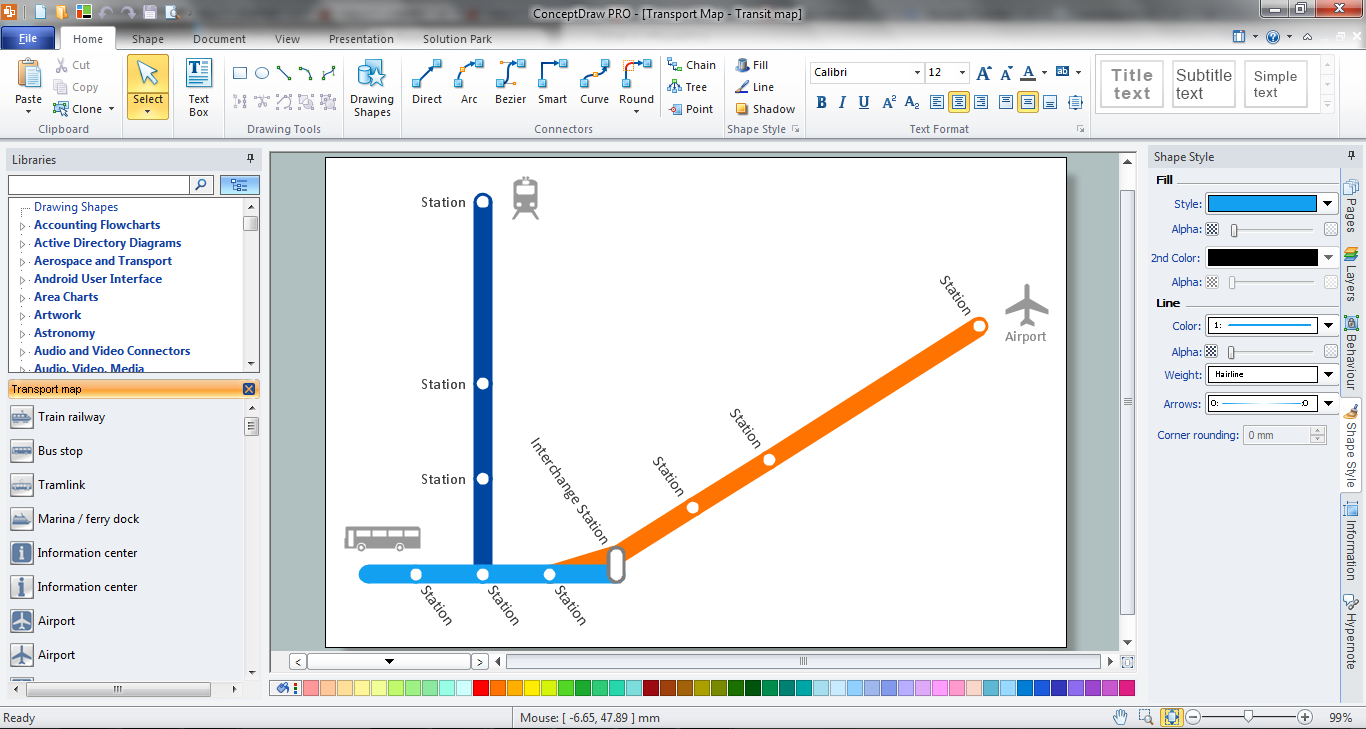
Picture:
What is Spatial Analysis?
Definition and Examples
Related Solution: