Made with
ConceptDraw
MINDMAP 16

Keyboard Shortcuts and Mouse Actions

ConceptDraw Office

ConceptDraw Office is an integrated set of visualization products and document exchange technologies. ConceptDraw OFFICE consists of a diagramming platform, a mind mapping, and a project management tool. These tools are essential to generate business diagrams, mind maps, project plans, dashboards, presentations, schematics, and any other business visualizations. These tools have access to an online service, ConceptDraw Solution Park that will deliver additional product extensions in the future. This is a time saving assistant for generating your business documents and presentations.

ConceptDraw Office consists of a diagramming platform, a mind mapping, and a project management tool. These tools are essential to generate business diagrams, mind maps, project plans, dashboards, presentations, schematics, and any other business visualizations.

ConceptDraw MINDMAP Samples

Sample mind maps created in ConceptDraw MINDMAP that demonstrate the different capabilities and applications of the program for business, personal, or education use.

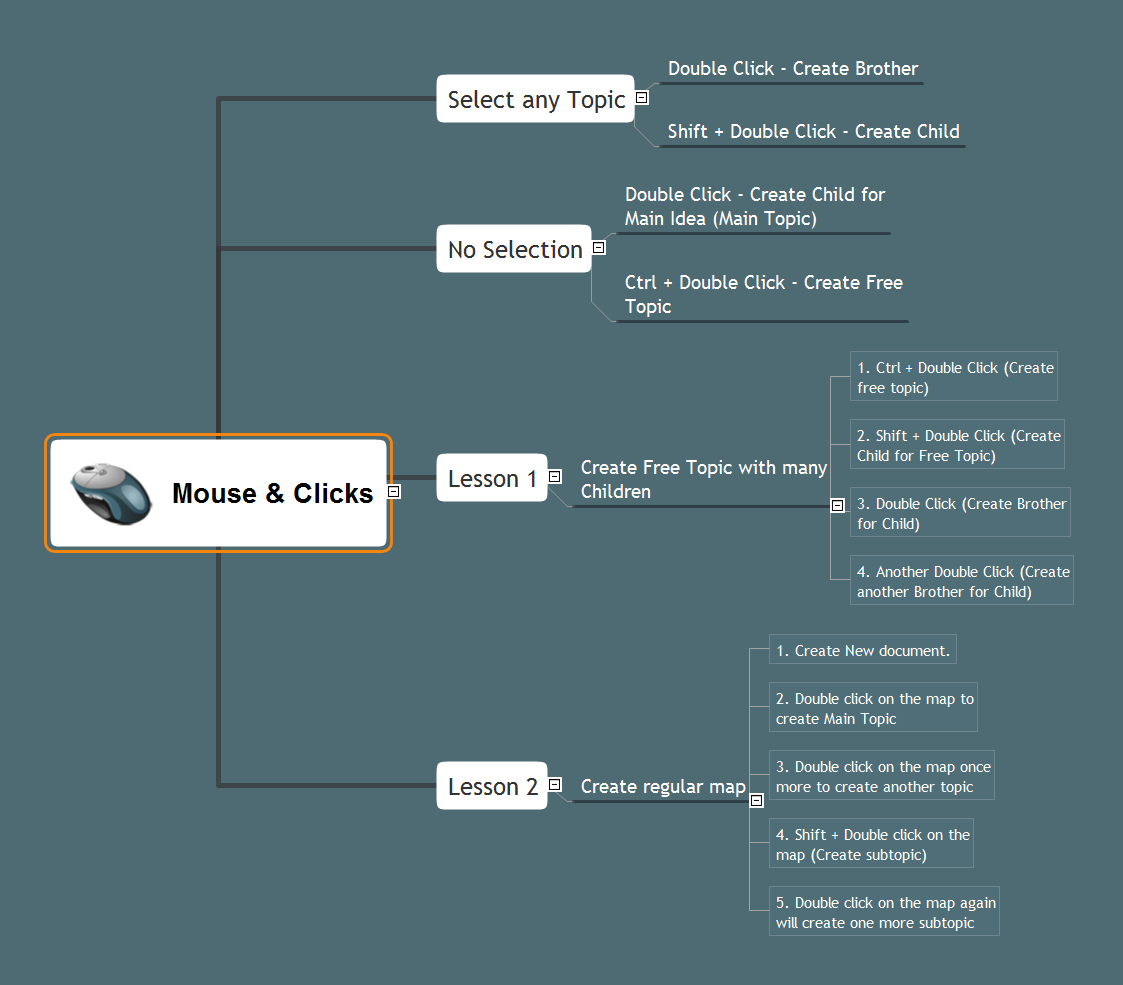
Mind map that details the various keyboard shortcuts and mouse actions that can be utilized in ConceptDraw MINDMAP

Keyboard Shortcuts and Mouse Actions *

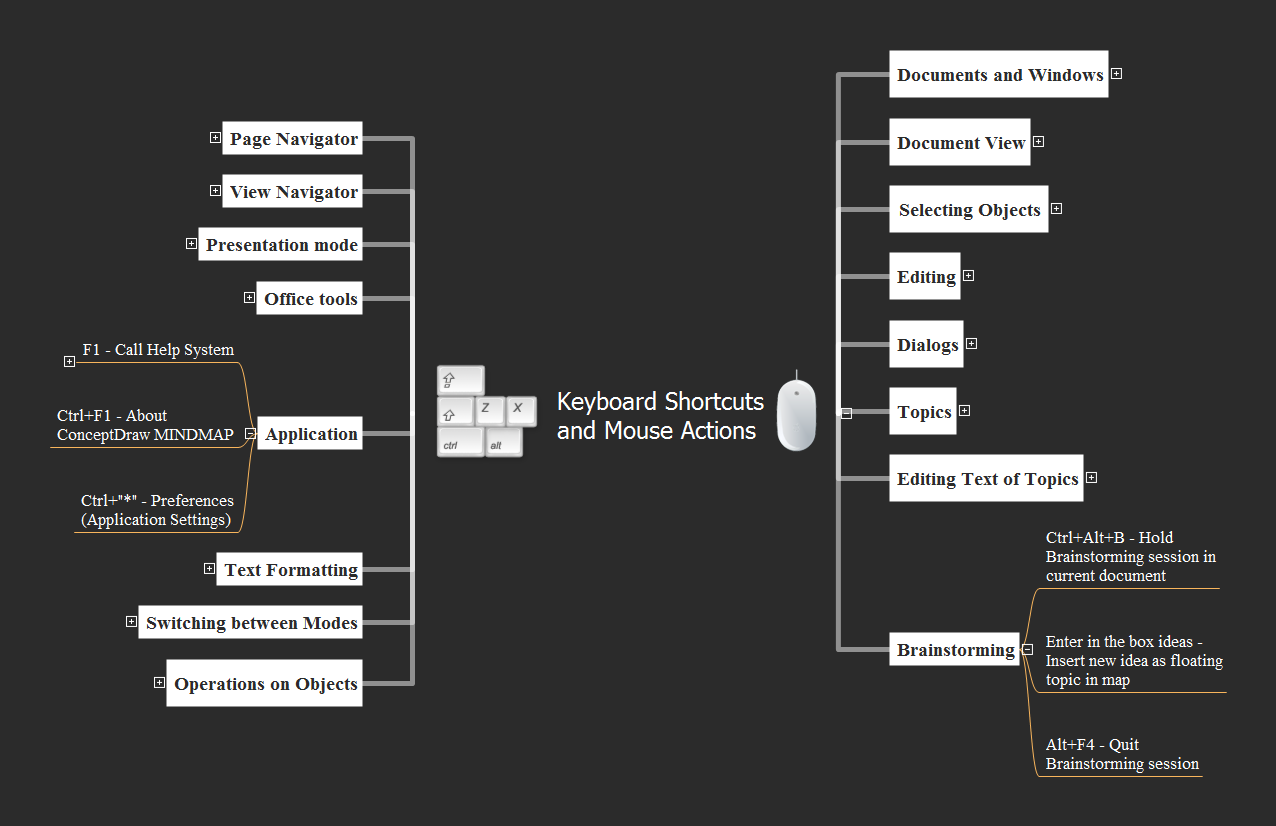
Example 1. Keyboard Shortcuts and Mouse Actions


Export to Outline


    Keyboard Shortcuts and Mouse Actions
    • Documents and Windows
      • Ctrl+N - Create a New Document
      • Ctrl+O - Open a Document
      • Ctrl+S - Save the active document
      • Ctrl+Shift+S - Save the active document under a new filename
      • Ctrl+Alt+S - Save the document as Template
      • Ctrl+Alt+I - Input View
      • Ctrl+Alt+O - Output View
      • Ctrl+P - Print Preview
      • Ctrl+Shift+P - Quick Print
      • F7 - Spelling
      • Ctrl+F4 / Ctrl+W - Close the active window
      • Ctrl+Tab / Ctrl+F6 - Activate the next window
      • Alt+F4 / Ctrl+Q - Quit ConceptDraw MINDMAP
    • Document View
      • Shift+F3 - Outline and map views
      • F3 - Map view only / Outline view only
      • Ctrl+"=" / Click in Zoom Box mode - Zoom In
      • Ctrl+"-" - Click + Alt in Zoom Box mode - Zoom Out
      • Ctrl+mouse wheel - Zoom In / Zoom Out
      • Ctrl+Shift+Z - Select Zoom Box tool
      • Alt+Enter - Show/hide levels
      • Shift+mouse wheel - Horizontal scroll
      • Ctrl+0 - Show fit map
      • PgUp - Go to the previous page
      • PgDn - Go to the next page
    • Selecting Objects
      • Select with Shift - Allows to select several objects
      • Ctrl+A - Select all the objects on page
      • Tab - Select the next object according to the order in which they were created
      • Shift+Tab - Select the previous object according to the order in which they were created
    • Editing
      • Ctrl+Z / Ctrl+Y - Undo the last operation / Redo what was reversed by Undo
      • Ctrl+X / Shift+Delete - Cut the selection to the Clipboard
      • Ctrl+C/Ctrl+Ins - Copy the selection to the Clipboard
      • Ctrl+V / Shift+Ins - Paste the content from the Clipboard
      • Delete/Backspace - Delete the selected object(s)
      • Ctrl+F - Search/Replace Text
      • Ctrl for dragging - Duplicate the selected object(s)
    • Dialogs
      • F4 - Show / Hide Clipart Window
      • F5 - Start Presentation Mode
      • Shift+F5 - Full Screen Mode
      • F6 - Show / Hide Page Navigator
      • Shift+F6 - Show / Hide View Navigator
      • F9 - Show / Hide Symbols floating dialog
      • F10 - Show / Hide Topic Type floating dialog
      • F11 - Add / Edit text note
      • Ctrl+Shift+E - Create / Edit hyperlink
      • Ctrl+Shift+T - Show Map Theme Attributes dialog
    • Topics
      • Enter, Double-click - Add a topic of the same level as the selected one
      • Shift+Enter, Shift+Double-click, Insert - Add a subtopic to the selected topic
      • Ctrl+Shift+L - Add callout to selected topic
      • Ctrl+Right / Ctrl+Left - Indent / Outdent item (one level deeper / one level closer to the root)
      • Ctrl+Down / Ctrl+Up - Move item to the next / previous position (one line down / up)
      • Del, Backspace - Delete the selected topic(s)
      • Arrows - Select the next topic
      • Ctrl+Double-click - Add floating topic
      • Double-click - Add a new topic to the main idea (if no topic is selected)
      • Alt+Enter - Expand / Collapse Topic Levels
      • Shift+Spaec - Arrange Branch
      • Ctrl+Shift+A - Apply changes to current level of topics
      • Ctrl+Alt+F - Go in the box Search
    • Editing Text of Topics
      • F2 - Activate Text Editing
      • Shift+Enter in editing mode - Start a new text line
      • Enter in editing mode - Quit editing mode and insert topic
      • Ctrl+Enter in editing mode - Quitediting mode and insert subtopic
      • Esc - Quit editing mode without applying changes
    • Brainstorming
      • Ctrl+Alt+B - Hold Brainstorming session in current document
      • Enter in the box ideas - Insert new idea as floating topic in map
      • Alt+F4 - Quit Brainstorming session
    • Operations on Objects
      • Ctrl+Shift+"[" - Send to Back
      • Ctrl+Shitf+"]" - Bring to Front
      • Ctrl+"[" - Send Backward
      • Ctrl+"]" - Bring Forward
      • Resize with Shift - Toggle between proportional and nonsymmetrical resizing
    • Switching between Modes
      • Ctrl+1 / Esc Activate Select tool
      • Ctrl+2 Activate Rectangle tool
      • Ctrl+3 - Activate Ellipse tool
      • Ctrl+4 - Activate Line tool
      • Ctrl+5 - Activate Spline tool
      • F2 - Activate Text Editing mode
      • Space + moving mouse - Activate Scroll Hand tool
      • Shift in drawing - Constrained drawing mode (circle, square, etc.)
    • Text Formatting
      • Ctrl+D - Format Text
      • Ctrl+B - Bold
      • Ctrl+I - Italic
      • Ctrl+U - Underline
      • Ctrl+L - Align on the left
      • Ctrl+E - Align in the center
      • Ctrl+R - Align on the right
      • Ctrl+"," - Increase font
      • Ctrl+"." - Decrease font
      • Ctrl+Shift+C - Copy formatting from selection
      • Ctrl+Shift+V - Apply copied formatting to selection
    • Application
      • F1 - Call Help System
        • Subtopic
          • Subtopic
      • Ctrl+F1 - About ConceptDraw MINDMAP
      • Ctrl+"*" - Preferences (Application Settings)
    • Office tools
      • Ctrl+J - Create Project
      • Ctrl+Shift+J - Create Project (Page)
    • Presentation mode
      • Space - Go to the next view
      • Arrows (left/right) - Go to the next / previous view
      • B - Darken
      • w - Lighten
      • Backspace - Go to the previous view
      • Esc - Exit from presentation mode
    • View Navigator
      • Insert - Insert new view
      • Arrows (left/right) - Go to the next / previous view
      • Ctrl+Arrows - Move view to the left / to the right
      • Delete/Backspace - Remove view
      • Esc - Remove focus from current view and move focus on map
      • Enter - Focus moves to the map
      • Home/End - Go to the first/last view
      • F2 - Start editing the view title
      • Ctrl+Shift+1 - Create view from visible objects
      • Ctrl+Shift+2 - Create view from selected objects
      • Ctrl+Shift+1 Create view from selected branches
      • Ctrl+Shift+R - Refresh previews
    • Page Navigator
      • Double-click on empty place - Add New Page
      • Click mouse on the page in the title - Start editing the editor title page
      • Ctrl+Arrows - Move page to the left / to the right
      • Delete - Remove page
      • Ctrl+T - Add New PAge
      • Arrows - Go to the next / previous page

    The Benefits for ConceptDraw MINDMAP Brainstorming Software

    • ConceptDraw MINDMAP is effective for brainstorming, designing mind maps, idea generating, creative and lateral thinking, creativity and problem solving.
    • ConceptDraw MINDMAP is ideal for team and personal work in Business, Marketing and Project Management.
    • The libraries with large quantity of vector objects help to illustrate your mind maps and to make them bright, visual and comprehensible.
    • Use of View Navigator tool lets create presentations from a mind map: you can simply select the map parts you want to present, sequence your slides, and preview the presentation.
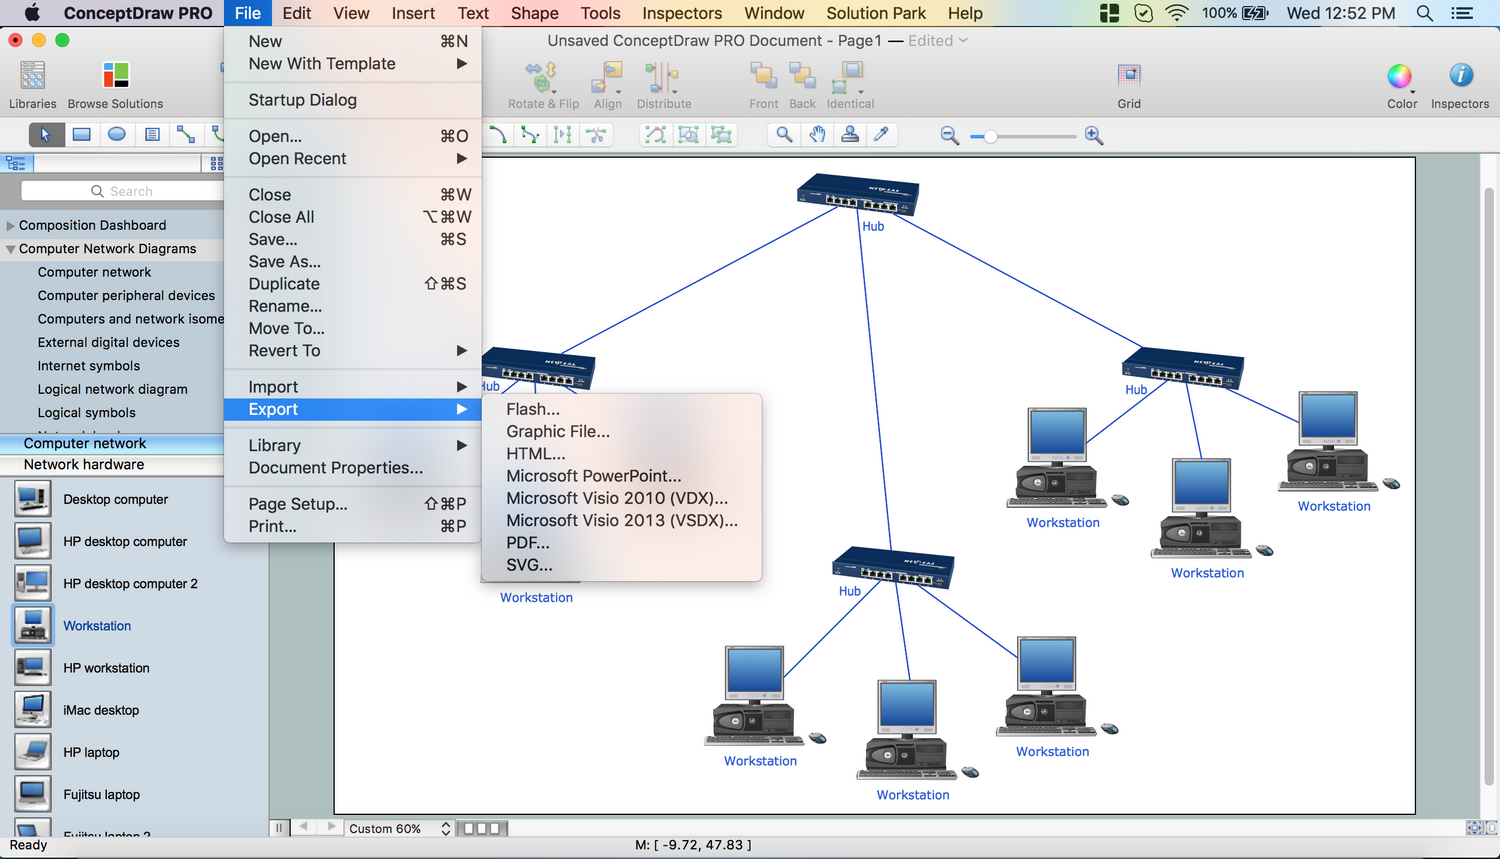
    • ConceptDraw MINDMAP provides wide capabilities of importing and exporting in various formats: Microsoft PowerPoint, Microsoft Word, MS Excel, Mindjet MindManager, image, HTML, PDF file.


    TEN RELATED HOW TO's:
    Beginning from the 19th century, people tried to tame electricity. Nowadays, electrical engineering covers a wide range of applications starting from providing illumination in our homes to developing space technologies. Considering the fact that every project needs documentation, engineers use electrical diagram software to develop these projects. Standard electrical symbols of electrical components are recognizable all around the world. This illustration represents the 26 libraries that are supplied by the ConceptDraw Electrical Engineering solution. The Electric Engineering libraries contains about a thousand objects enabling you to draw various charts depicting electrical connections and circuits, along with schemes of different equipment and devices. The electric engineering libraries delivered with ConceptDraw solution meet the standards adopted in the image to electrical circuits. So they can be used by professionals along with amateurs in electrical engineering.Electrical Diagram Software *
    Picture: Electrical Diagram Software
    Related Solution:
    UML Object Diagram shows the structure of a modeled system at a specific time. ConceptDraw Rapid UML solution delivers libraries contain pre-designed objects fit UML notation, and ready to draw professional UML Object Diagram.Diagramming Software for Design <br>UML Object Diagrams *
    Picture: Diagramming Software for Design UML Object Diagrams
    Related Solution:
    A pie chart or a circle graph is a circular chart divided into sectors, illustrating numerical proportion. In a pie chart, the arc length of each sector and consequently its central angle and area, is proportional to the quantity it represents. Pie chart examples and templates created using ConceptDraw DIAGRAM software helps you get closer with pie charts and find pie chart examples suite your needs.Pie Chart Examples and Templates *
    Picture: Pie Chart Examples and Templates
    Related Solution:
    In software engineering, a UML Class Diagrams is a type of static structure diagram that is used both for general conceptual modeling of the systematics of the application, and for detailed modeling translating the models into programming code. Use ConceptDraw DIAGRAM with UML class diagram templates, samples and stencil library from Rapid UML solution to show the classes of system, their attributes, operations or methods, and the relationships among the classes.UML Class Diagrams. Diagramming Software for Design UML Diagrams *
    Picture: UML Class Diagrams. ConceptDraw DIAGRAM - Diagramming Software for Design UML Diagrams
    Related Solution:
    ConceptDraw DIAGRAM is a powerful intelligent vector graphics tool for drawing flowcharts.Basic Diagramming <br>Flowchart Software *
    Picture: Basic Diagramming Flowchart Software
    Related Solution:
    Analysis is very important part for every business, as it helps to understand the weakness and to see the opportunities, and SWOT is one of the most effective tools. To illustrate the multifunctionality of this tool, let’s imagine a SWOT sample in area of computers networking, which can be carried out to realize the pros and cons of some equipment, for example. Even a network topology or a administer can be a subject for this analysis. This SWOT analysis matrix illustrate the sample of using this useful technique for comprehension of Strengths and Weaknesses, and for determining the Opportunities open to business and the Threats it encounters. Used in a business scope, it will help to create a perspective niche in the market for particular business. The ConceptDraw SWOT and TOWS Analysis solution gives a lot of templates of both SWOT and TOWS matrices that allow managers and marketers create custom diagrams to perform SWOT or TOWS analysis in context of a particular business.SWOT Sample in Computers *
    Picture: SWOT Sample in Computers
    The excellent possibility to create attractive Cross Functional Flowcharts for step-by-step visualization the operations of a business process flow of any degree of detailing is offered by ConceptDraw’s Cross-Functional Flowcharts solution. The extensive selection of commonly used vector cross functional flowchart symbols allow you to demonstrate the document flow in organization, to represent each team member’s responsibilities and how processes get shared or transferred between different teams and departments.Cross Functional Flowchart Symbols *
    Picture: Cross Functional Flowchart Symbols
    Related Solution:
    A database is a data collection, structured into some conceptual model. Two most common approaches of developing data models are UML diagrams and ER-model diagrams. There are several notations of entity-relationship diagram symbols and their meaning is slightly different. Crow’s Foot notation is quite descriptive and easy to understand, meanwhile, the Chen notation is great for conceptual modeling. An entity relationship diagrams look very simple to a flowcharts. The main difference is the symbols provided by specific ERD notations. There are several models applied in entity-relationship diagrams: conceptual, logical and physical. Creating an entity relationship diagram requires using a specific notation. There are five main components of common ERD notations: Entities, Actions, Attributes, Cardinality and Connections. The two of notations most widely used for creating ERD are Chen notation and Crow foot notation. By the way, the Crow foot notation originates from the Chen notation - it is an adapted version of the Chen notation.ERD Symbols and Meanings
    Picture: ERD Symbols and Meanings
    Related Solution:
    The term “cloud” is very popular and widely used now, it is a server, data processing centre, or a network which lets to store the data and software, provides access to them, allows to run applications without installation and gives the possibility to process data hosted remotely via the Internet connection. For documenting the Cloud Computing Architecture with a goal to facilitate the communication between stakeholders are successfully used the Cloud Computing Architecture diagrams. It is convenient and easy to draw various Cloud Computing Architecture diagrams in ConceptDraw DIAGRAM software with help of tools of the Cloud Computing Diagrams Solution from the Computer and Networks Area of ConceptDraw Solution Park.How to Build Cloud Computing Diagram<br>Principal Cloud Manufacturing *
    Picture: How to Build Cloud Computing DiagramPrincipal Cloud Manufacturing
    Related Solution:
    Video tutorials on ConceptDraw products. Try it today!What can you create with ConceptDraw MINDMAP? *
    Picture: What can you create with ConceptDraw MINDMAP?
    ConceptDraw
    MINDMAP 16