ConceptDraw PROJECT Software Overview
ConceptDraw PROJECTProfessional Dynamic Project Management ConceptDraw PROJECT is designed to enable project managers to analyze the progress of projects and optimize the utilization of available resources. ConceptDraw PROJECT is an effective tool for new and experienced users with a fine balance of usability and powerful functionality.
| ||||||||||||||||||||||


TEN RELATED HOW TO's:
For depicting the onion model are actively used Stakeholder Onion Diagrams. The ConceptDraw DIAGRAM diagramming and vector drawing software extended with Stakeholder Onion Diagrams Solution from the Management Area of ConceptDraw Solution Park offers the number of useful tools and Stakeholder Onion Diagram template for their easy design.
Picture: Stakeholder Onion Diagram Template
Related Solution:
Do you need to draw a check order process flowchart?
Use the intuitive product - ConceptDraw.
Picture: Check Order Process Flowchart. Flowchart Examples
Related Solution:
This sample shows the Business Process Reengineering Diagram. Reengineering is the process of the business processes optimizations. This sample can be used in business process management, quality management, project management and program management.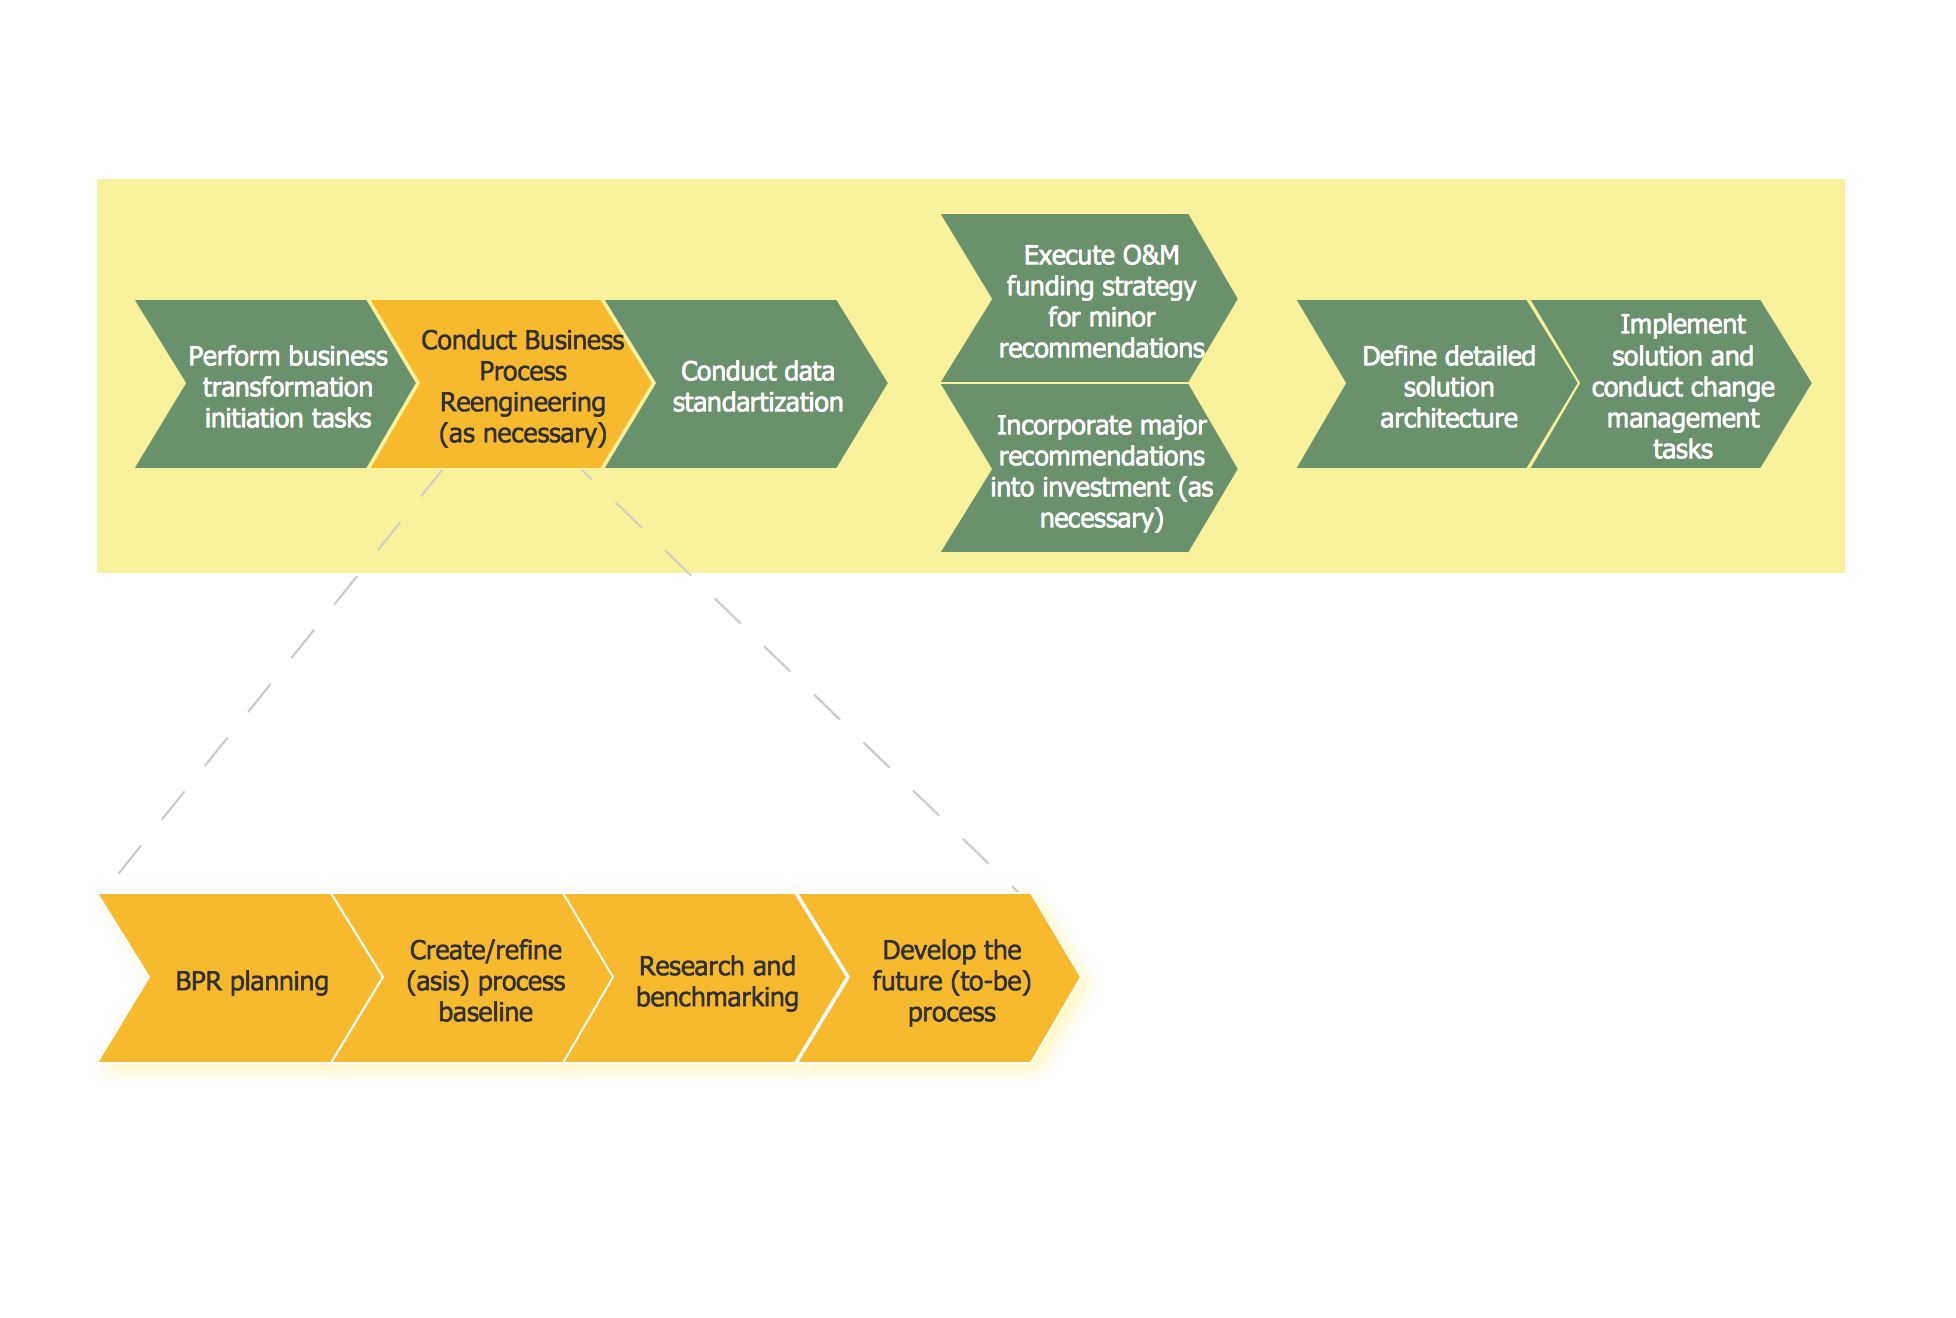
Picture: Business Process Reengineering Examples
Related Solution:
ConceptDraw is a best data visualization tool that will allow everyone to create rich infographics and visualizations quickly and easily.
Picture: Best Tool for Infographic Construction
The first step to optimize a workflow is to get its visual depiction. Then you can analyse and optimize the workflow making changes to your workflow diagram. We recommend to use ConceptDraw DIAGRAM software extended with the Workflow Diagram solution to visualize and optimize your workflow. It allows you produce easy-to-change scalable vector graphic workflow and then present it to your team or partners.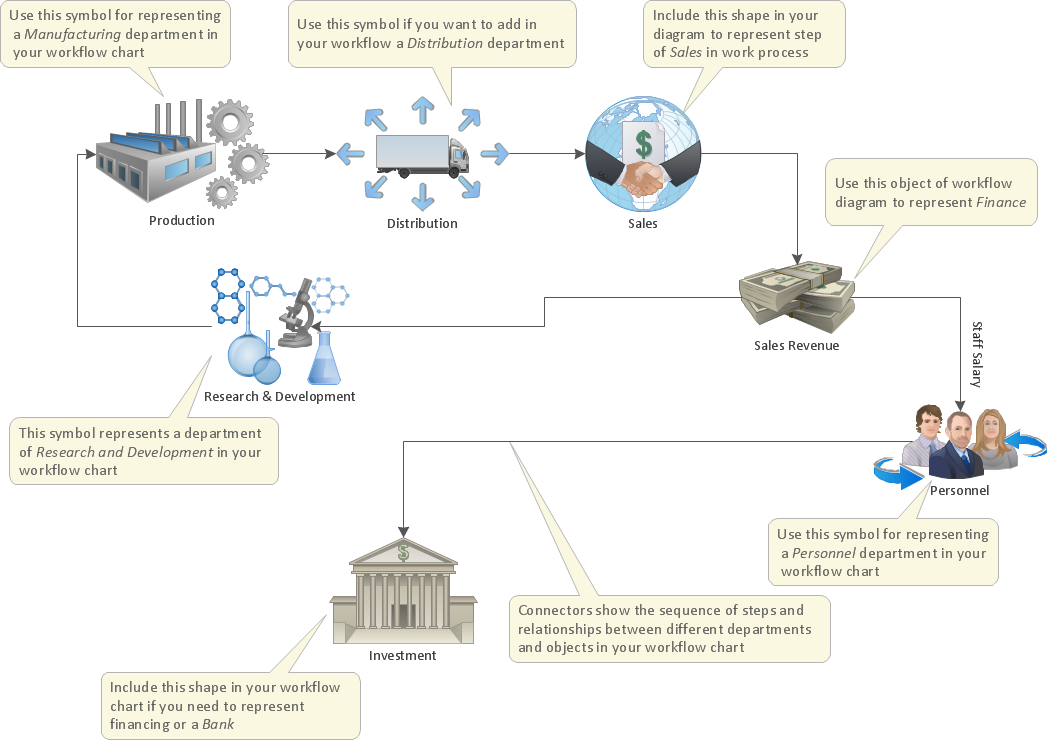
Picture: Optimize a Workflow
Related Solution:
ConceptDraw DIAGRAM diagramming and vector drawing software offers a powerful Seven Basic Tools of Quality solution from the Quality area of ConceptDraw Solution Park which contains a set of useful tools for easy drawing Flow Chart of any complexity.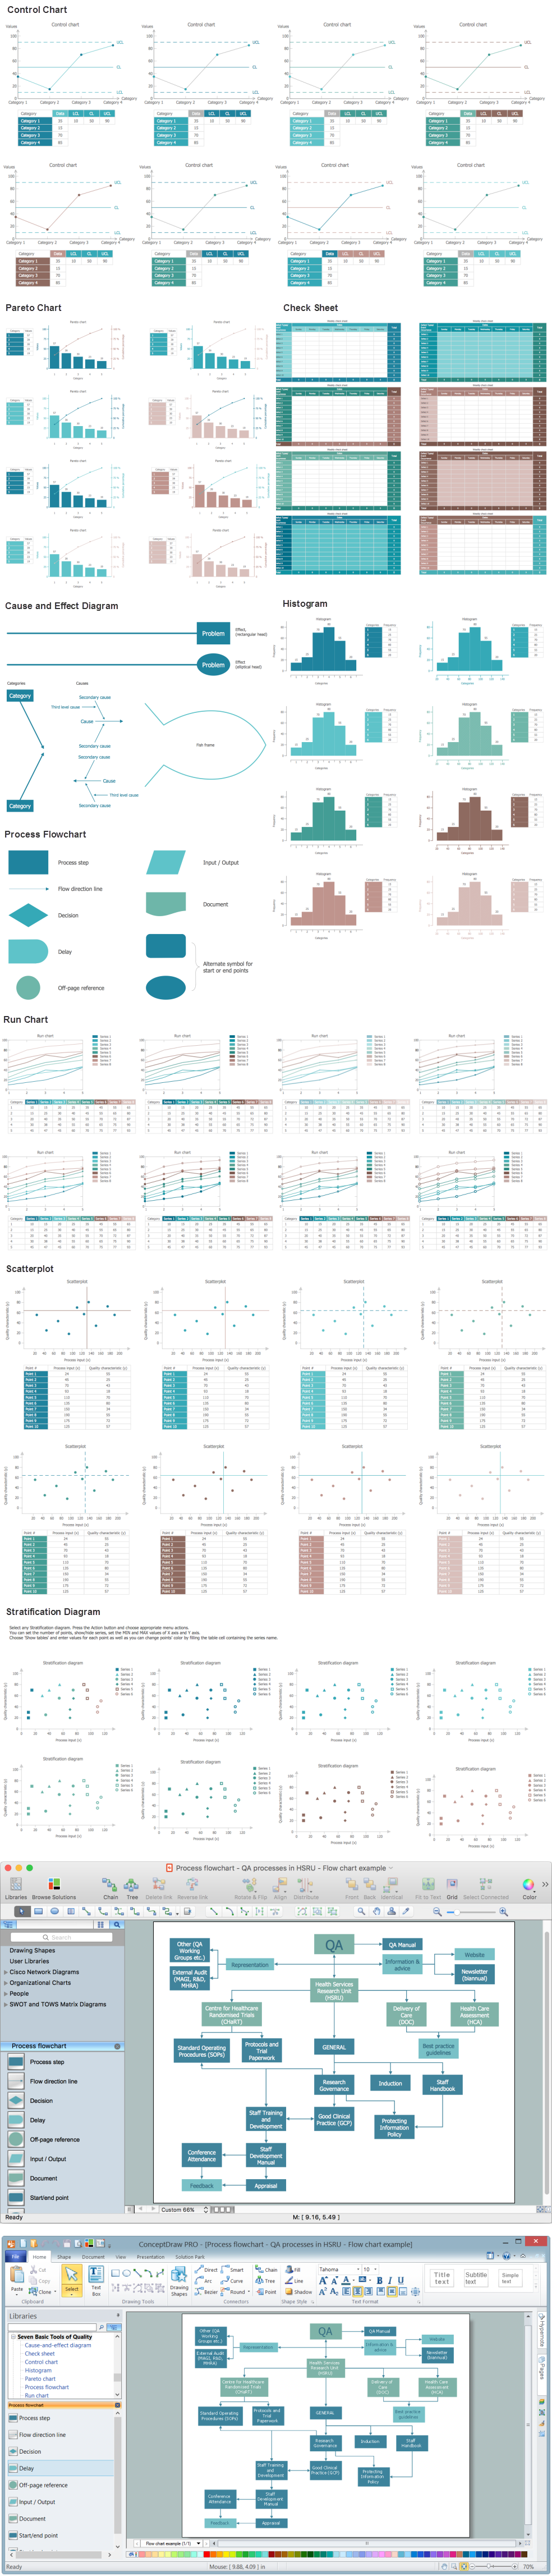
Picture: Seven Basic Tools of Quality - Flow Chart
Related Solution:
Any bar chart can be also called as a bar graph or a column chart or graph. Being a chart or a graph that is commonly used for presenting some categorical data with the rectangular bars having their lengths or heights proportional to the values that they represent, such drawings can be made with the help of the ConceptDraw DIAGRAM diagramming and drawing software. The created bars can be plotted either vertically or horizontally and any vertical bar chart can be also sometimes called as a line graph.
Picture: Column Chart Template
Related Solution:
Users new to ConceptDraw PROJECT will find the Basic lessons an essential platform for familiarizing themselves with the program′s functions. This video lesson will teach you how to set up task trees and dependencies.
Picture: Project —Task Trees and Dependencies
Many things can be listed as potential strengths and weaknesses of a company. To create a good-looking scheme, use SWOT analysis software and enjoy the results within a few minutes. A good practice is to make a SWOT analysis twice a year.
These drawings illustrate the possibilities of ConcptDraw solution for building SWOT and TOWS Matrices. SWOT analysis matrix demonstrates this widely used method for detection of Strengths and Weaknesses, Opportunities and Threats facing any business. If SWOT analysis is carried out properly, it can help to build a good position in the market. The ConceptDraw SWOT and TOWS Analysis solution provides a great number of templates of both SWOT and TOWS matrices. Moreover, this is the only software that offers to carry out SWOT analysis starting from making mind maps. The solution contains SWOT mind map templates. A single mouse click is needed to turn the SWOT mind map into a SWOT matrix. The SWOT diagram will be created in ConceptDraw DIAGRAM on the base of SWOT mind map.
Picture: SWOT Analysis Software: Comprehensive Guide
All information you send from ConceptDraw MINDMAP is indexed for you by Evernote, making information easy to find and use.
Picture: Evernote exchange - Personal Productivity
Related Solution:
ConceptDraw
DIAGRAM 18