Made with
ConceptDraw
MINDMAP 16

Marketing Research Project

ConceptDraw Office

ConceptDraw Office is an integrated set of visualization products and document exchange technologies. ConceptDraw OFFICE consists of a diagramming platform, a mind mapping, and a project management tool. These tools are essential to generate business diagrams, mind maps, project plans, dashboards, presentations, schematics, and any other business visualizations. These tools have access to an online service, ConceptDraw Solution Park that will deliver additional product extensions in the future. This is a time saving assistant for generating your business documents and presentations.

ConceptDraw Office consists of a diagramming platform, a mind mapping, and a project management tool. These tools are essential to generate business diagrams, mind maps, project plans, dashboards, presentations, schematics, and any other business visualizations.

ConceptDraw MINDMAP Samples

Sample mind maps created in ConceptDraw MINDMAP that demonstrate the different capabilities and applications of the program for business, personal, or education use.

Mind map that organizes tasks, resources, outcomes and people for a marketing research project.

Marketing Research Project *

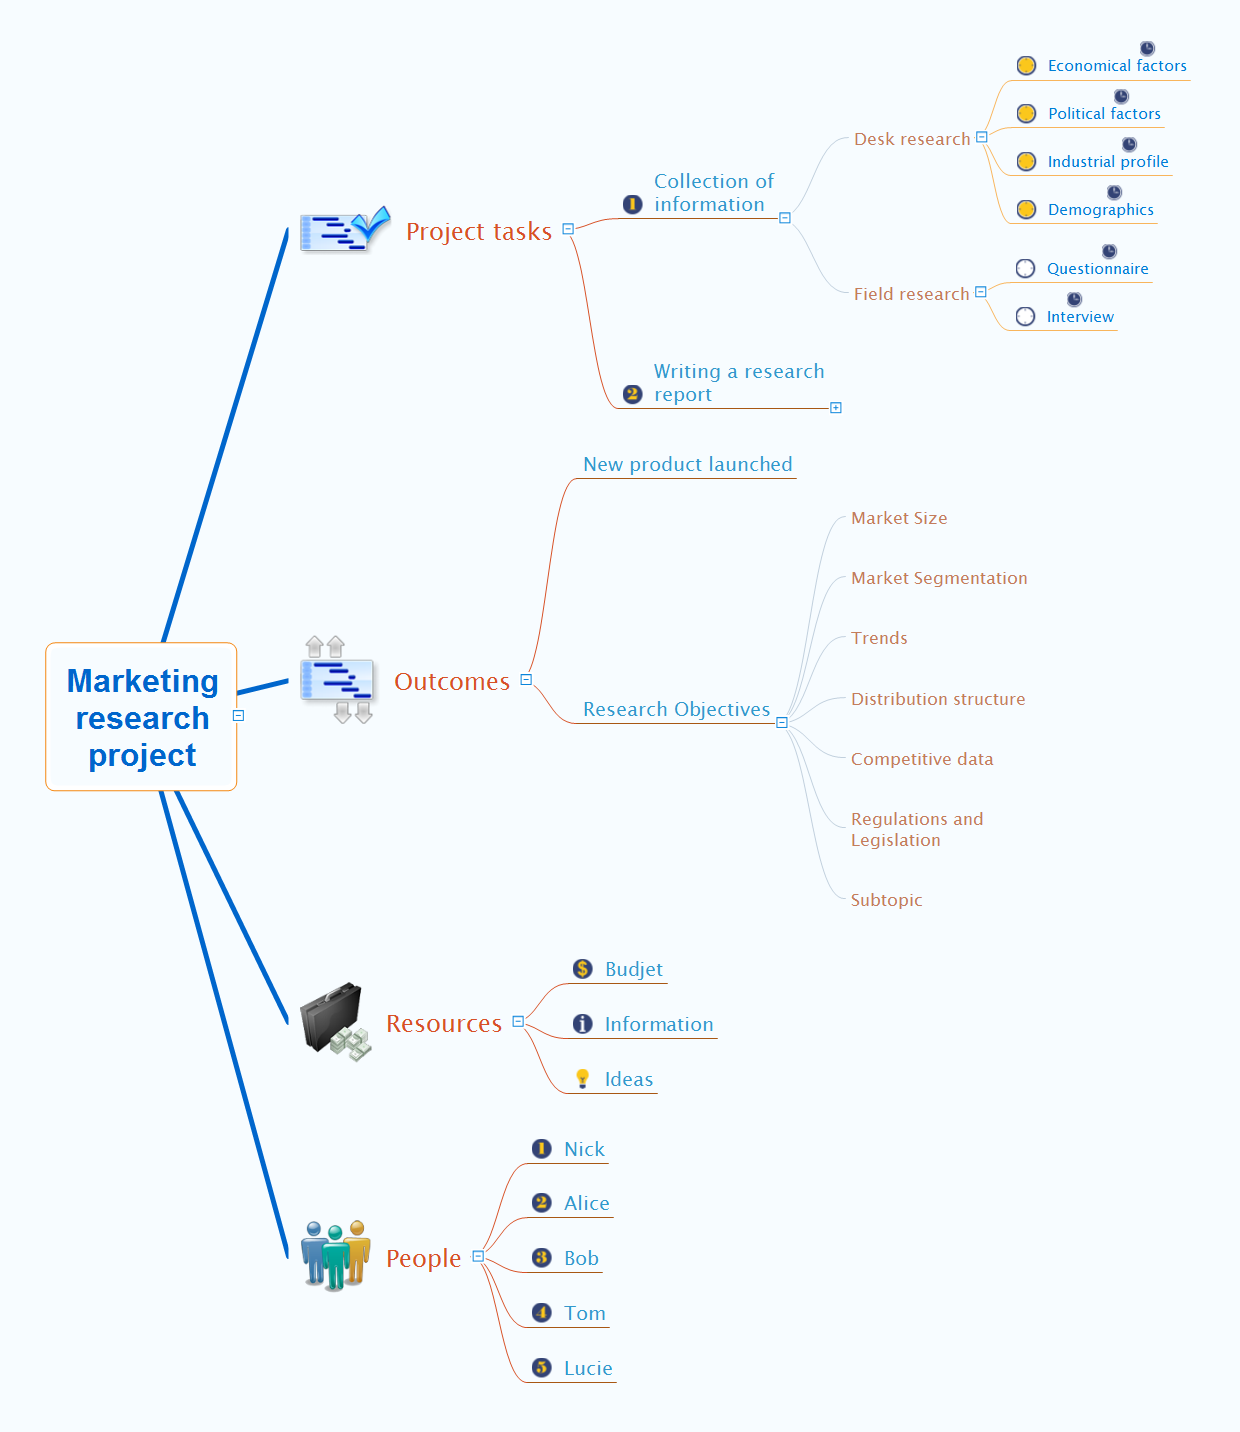
Example 1. Marketing Research Project


Export to Outline


    Marketing research project
    • Project tasks
      • Collection of information
        • Desk research
          • Economical factors
          • Political factors
          • Industrial profile
          • Demographics
        • Field research
          • Questionnaire
          • Interview
      • Writing a research report
        • Background
        • Scope
        • Project objectives
        • Methodology
        • Main findings
        • Summary of the findings and conclusions
        • Recommendations
        • Appendix
    • Outcomes
      • New product launched
      • Research Objectives
        • Market Size
        • Market Segmentation
        • Trends
        • Distribution structure
        • Competitive data
        • Regulations and Legislation
        • Subtopic
    • Resources
      • Budjet
      • Information
      • Ideas
    • People
      • Nick
      • Alice
      • Bob
      • Tom
      • Lucie

    The Benefits for ConceptDraw MINDMAP Brainstorming Software

    • ConceptDraw MINDMAP is effective for brainstorming, designing mind maps, idea generating, creative and lateral thinking, creativity and problem solving.
    • ConceptDraw MINDMAP is ideal for team and personal work in Business, Marketing and Project Management.
    • The libraries with large quantity of vector objects help to illustrate your mind maps and to make them bright, visual and comprehensible.
    • Use of View Navigator tool lets create presentations from a mind map: you can simply select the map parts you want to present, sequence your slides, and preview the presentation.
    • ConceptDraw MINDMAP provides wide capabilities of importing and exporting in various formats: Microsoft PowerPoint, Microsoft Word, MS Excel, Mindjet MindManager, image, HTML, PDF file.


    TEN RELATED HOW TO's:
    In order to be successful, you have to promote your business on the market. One of the ways for planning this promotion is to create a social media DFD Flowchart which will contain all the details of your business strategy. Social media is a very influential tool, and it's a mistake to ignore it. The following flowchart represents a best way to estimate social media posts, and gives a strategy of responses. This flowchart is designed in the format of cross-functional flowchart. With this format, we can divide the process into three distinct phases. This approach helps to generate well-considered and balanced response on social networks activities. Using ConceptDraw solution for Social Media Response, your reaction to social media posts will positively mirror the values and mission of your business.How to Create a Social Media DFD Flowchart *
    Picture: How to Create a Social Media DFD Flowchart
    Related Solution:
    It’s obvious that a good manager detects threats just in time to prevent a company crisis. If you had ever asked about what SWOT analysis is, then you must have interest in business strategies. After you build a SWOT matrix, you’ll see the pros and cons of your strategy. The method of SWOT analysis is used in strategy management. It helps to estimate the Strengths, Weaknesses, Opportunities, and Threats generated during an activity of particular business. A SWOT matrix can be build for companies, products, or individuals. Using SWOT analysis means to state business goals and to determine factors, both the internal and external that are good and bad to reach the business goals. The capabilities of ConceptDraw MINDMAP and ConceptDraw DIAGRAM software help professional to carry out SWOT analysis with maximum effectiveness.What is SWOT Analysis? *
    Picture: What is SWOT Analysis?
    ConceptDraw DIAGRAM software extended with unique HR Flowcharts Solution is the best for designing various flowcharts and diagrams in the field of human resources management.Human Resources
    Picture: Human Resources
    Related Solution:
    Brainstorming is an effective and widely used tool for generating large quantity of ideas by group of people in a short time. ConceptDraw MINDMAP is a powerful brainstorming software! ConceptDraw MINDMAP lets you easy and effectively generate and organize ideas and data, and also create the illustrative mind maps.Brainstorming Software *
    Picture: Brainstorming Software
    Related Solution:
    Electrical plan is a document that is developed during the first stage of the building design. This scheme is composed of conventional images or symbols of components that operate by means of electric energy. To simplify the creation of these schemes you can use house electrical plan software, which will not require a long additional training to understand how to use it. You only need to install the necessary software ant it’s libraries and you’ll have one less problem during the building projection. Any building contains a number of electrical systems, including switches, fixtures, outlets and other lightening equipment. All these should be depicted in a building electrical plans and included to general building documentation. This home electrical plan displays electrical and telecommunication devices placed to a home floor plan. On the plan, each electrical device is referenced with the proper symbol. Electrical symbols are used for universal recognition of the building plan by different persons who will be working on the construction. Not all possible electric symbols used on a certain plan, so the symbols used in the current home plan are included to a legend. The electrical home plan may be added as a separate document to a complete set of building plans.House Electrical Plan Software
    Picture: How To use House Electrical Plan Software
    Related Solution:
    Mind map template that breaks down the organization of a company by departments, management, board of directors, and investors.Company Organization *
    Picture: Company Organization
    Related Solution:
    This sample was created in ConceptDraw DIAGRAM diagramming and vector drawing software using the Bubble Diagrams Solution from the Diagrams area of ConceptDraw Solution Park. This sample clearly shows the Four Dimensions Bubble Diagram of the distribution of chlorine contaminant in the water source. This Bubble Diagram is very useful in the chemistry, hydrology, and ecology.Four Dimensions Bubble Plot *
    Picture: Four Dimensions Bubble Plot
    Related Solution:
    SWOT Analysis solution extends ConceptDraw MINDMAP and ConceptDraw DIAGRAM products with easy-to-use SWOT Analysis tools.SWOT Analysis matrix templates and samples *
    Picture: SWOT Analysis matrix templates and samples
    Using ConceptDraw quality mind maps is a perfect addition to quality visualization in your company.Quality visualization in your company *
    Picture: Quality visualization in your company
    Related Solution:
    Gant Chart is a graphical representation of tasks as segments on a time scale. It helps plan and monitor project development or resource allocation. The horizontal axis is a time scale, expressed either in absolute or relative time.Gant Chart in Project Management *
    Picture: Gant Chart in Project Management
    Related Solution:
    ConceptDraw
    MINDMAP 16