How to Make SWOT Analysis in a Word Document
A SWOT Analysis is a popular strategic planning tool used to evaluate the Strengths, Weaknesses, Opportunities, and Threats involved in any businesses. Using mind map allows you to collect and structure a lot of information involved in SWOT Analysis as well as identify the relationships between different pieces of information.

Example 1. SWOT Analysis solution
ConceptDraw SWOT Analysis solution combines the visual advantages of ConceptDraw MINDMAP and presentation capabilities of ConceptDraw DIAGRAM to provide a complete work solution. The SWOT/TOWS results from ConceptDraw can be easily exported to Microsoft PowerPoint, Microsoft Visio, Adobe PDF, and many electronic file formats.
You can export your SWOT mind map into a MS Word document, which makes using SWOT mind map easier if you need to collaborate it with other people.
- From ConceptDraw MINDMAP inputs choose the Management category and run the SWOT Analysis template.
- Create a mind map by filling a template.

Example 2. SWOT analysis mind map template
- Click the File menu, select Export and then choose MS Word.
- The Export to Word window will appear. Select template and then click OK.
- Mind Map structure is transformed into the structure of the MS Word document:


Example 3. SWOT Analysis in MS Word Document
ConceptDraw products across any platform, meaning you never have to worry about compatibility again. ConceptDraw MINDMAP allows you to make SWOT analysis on PC or macOS operating systems.
See also:
Marketing — Matrices
- Marketing positioning matrix - Product positioning map
- Product-market matrix - Ansoff matrix
- BCG matrix - Boston growth-share matrix
- Feature comparison chart - Digital scouting cameras
- Marketing matrix diagram - Competitive strategies
- Marketing matrix diagram - Porters value chain
Marketing — Mind Maps
- Marketing mindmap - Marketing research project
- Marketing mind map - Strategic accomplishment mapping
- Twitter Compaign for New Software Product
- Marketing mind map - Sales Call
TEN RELATED HOW TO's:
The vector stencils library Russia contains contours for ConceptDraw DIAGRAM diagramming and vector drawing software. This library is contained in the Continent Maps solution from Maps area of ConceptDraw Solution Park.
Picture: Geo Map - Europe - Russia
Related Solution:
This sample was created in ConceptDraw DIAGRAM diagramming and vector drawing software using the Bar Graphs Solution from Graphs and Charts area of ConceptDraw Solution Park. It is Bar Graphs example, Sales Growth example, Column Chart Example - Sales Report.
Picture: Sales Growth. Bar Graphs Example
Related Solution:
VSM symbols are the best for a production process designing. The entire Value Stream Mapping method uses a graphical representation of the manufacturing process, factors' pros and cons, that all stakeholders can easily understand. Value Stream Mapping is a graphical technique that provides possibilities to improve analysis of a manufacturing process, at the stage of the transferring information or materials that required to deliver a product or service to the customer.
Picture: Value Stream Mapping Symbols
Related Solution:
To support you in your tasks you can use the power of ConceptDraw DIAGRAM providing
intelligent vector graphics that are useful for marketing diagramming and
ConceptDraw MINDMAP for key marketing mind maps.
Picture: Business Productivity - Marketing
Related Solution:
ConceptDraw DIAGRAM extended with Chemistry solution is effective for drawing various organic chemistry schemes, diagrams, illustrations thanks to the included collection of predesigned organic chemistry symbols
Picture: Organic Chemistry Symbols
Related Solution:
Create with our data flow diagram software perfect data flow diagrams. Download data flow diagram software for FREE. Use hundreds of data flow diagram examples.
Picture: Collaboration in a Project Team
A mindmap used to illustrate an overview of a Twitter campaign for a new software product.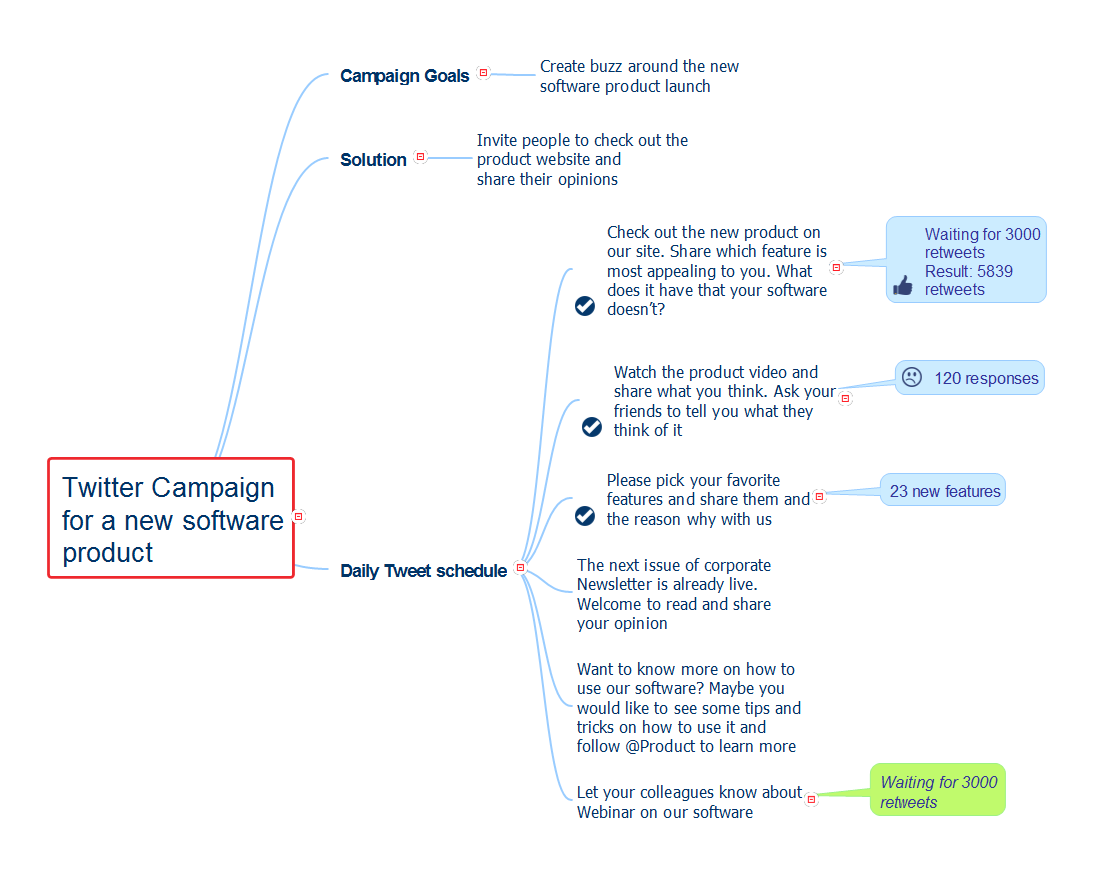
Picture: New Software Product
Related Solution:
Once you have created your document in ConceptDraw DIAGRAM and you want to share it with your colleagues and friends, who uses MS Visio on their computers, you can easily export your document using ConceptDraw DIAGRAM export to Visio XML files (VDX) feature.
Now you can share your ConceptDraw documents with MS Visio users.
Picture: Export from ConceptDraw DIAGRAM Document to MS Visio® XML
There’s no shortage of ways the new Microsoft® PowerPoint® import capability in ConceptDraw MINDMAP can help you.
Picture: How to Use the Export To PowerPoint Function in Your Mindmap Tool
Related Solution:
Communication is the main challenge and the key success factor for organizational project management in company with remote projects. Communicating visually via Skype you bring all projects together to achieve corporate goals.
Picture: Remote Projects in Corporate Strategy
Related Solution:

