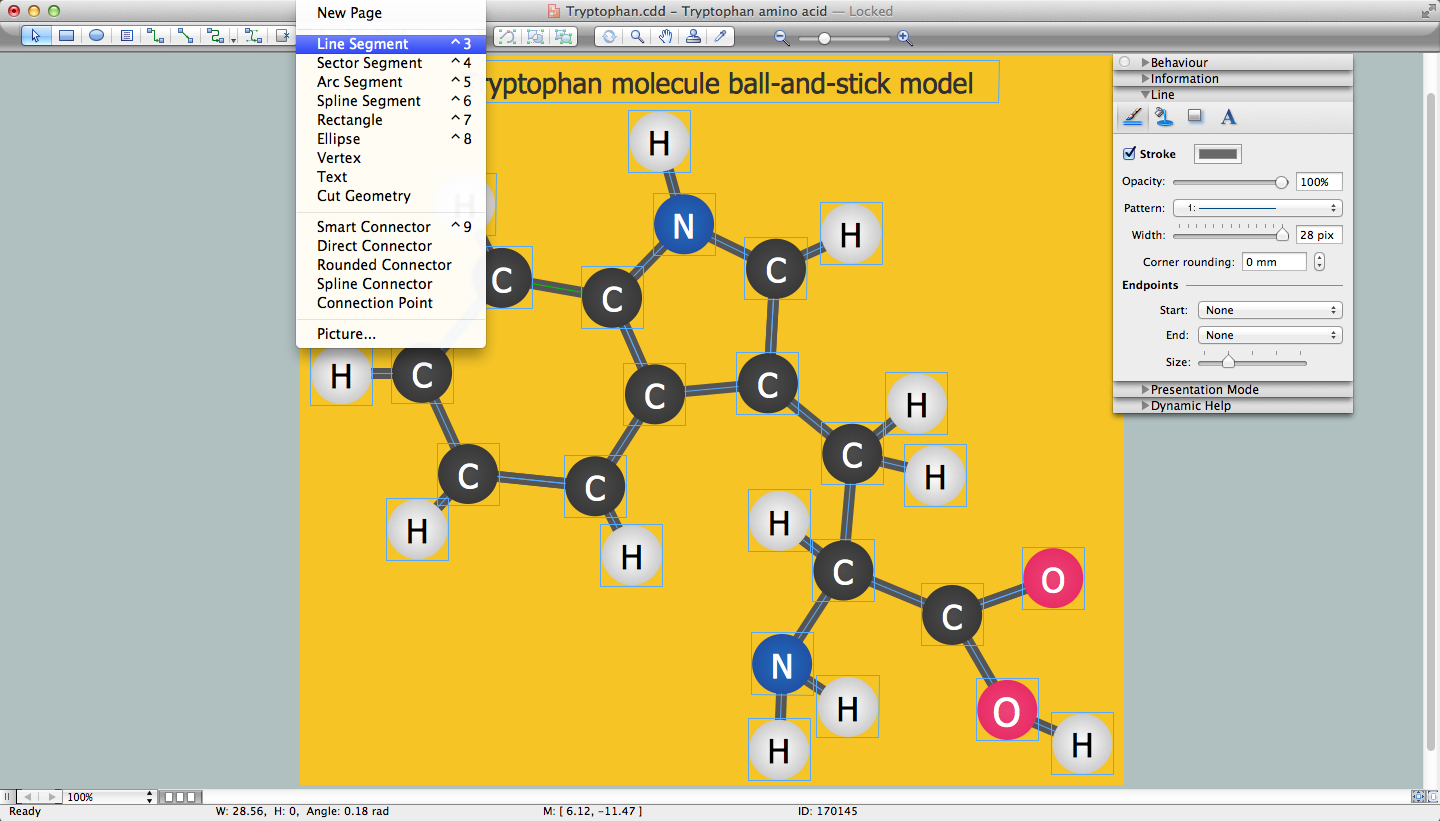
Sample 1. Chemistry Drawing Software
Chemistry Solution provides 5 libraries with wide variety of vector shapes of chemistry equation symbols, organic chemistry symbols and chemical clipart:
- Periodic Table of Chemical Elements Library
- Chemical Elements Library
- Chemical Drawings Library
- Conformations Library
- Laboratory Equipment Library
Use them actively to design your chemistry drawings fast and easy.

Sample 2. Chemistry Solution – Periodic Table of Chemical Elements Standard Form
Chemistry solution offers also large collection of predesigned templates and samples of chemical schemes and diagrams. You can find them easily in ConceptDraw STORE. All samples and templates are available for changing and further successful using.

Sample 3. Chemistry Solution – Phenols
The following features make ConceptDraw DIAGRAM the best chemistry drawing software:
- You don't need to be an artist to draw professional looking diagrams in a few minutes.
- Large quantity of ready-to-use vector objects makes your drawing diagrams quick and easy.
- Great number of predesigned templates and samples give you the good start for your own diagrams.
- ConceptDraw DIAGRAM provides you the possibility to use the grid, rules and guides. You can easily rotate, group, align, arrange the objects, use different fonts and colors to make your diagram exceptionally looking.
- All ConceptDraw DIAGRAM documents are vector graphic files and are available for reviewing, modifying, and converting to a variety of formats: image, HTML, PDF file, MS PowerPoint Presentation, Adobe Flash, MS Visio.
- Using ConceptDraw STORE you can navigate through ConceptDraw Solution Park, managing downloads and updates. You can access libraries, templates and samples directly from the ConceptDraw STORE.
- If you have any questions, our free of charge support is always ready to come to your aid.
TEN RELATED HOW TO's:
ConceptDraw DIAGRAM is perfect for software designers and software developers who need to draw Computer and Network Diagrams._Win_Mac.png)
Picture: Network Diagramming Software for DesignComputer and Network Diagrams
In electronics, a diode is a two-terminal electronic component that conducts primarily in one direction (asymmetric conductance); it has low (ideally zero) resistance to the flow of current in one direction, and high (ideally infinite) resistance in the other. A semiconductor diode is a crystalline piece of semiconductor material with a p–n junction connected to two electrical terminals. Today, most diodes are made of silicon, but other semiconductors such as selenium or germanium are sometimes used.
26 libraries of the Electrical Engineering Solution of ConceptDraw DIAGRAM make your electrical diagramming simple, efficient, and effective. You can simply and quickly drop the ready-to-use objects from libraries into your document to create the electrical diagram.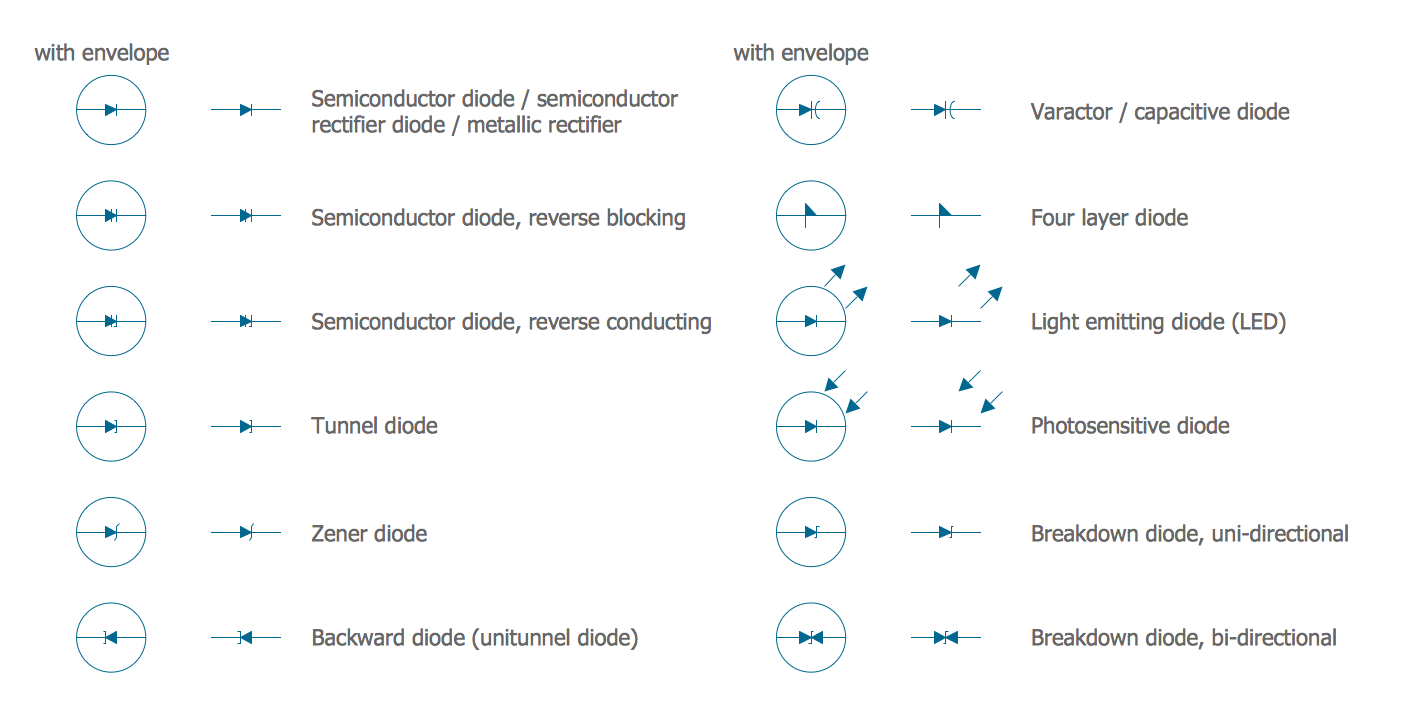
Picture: Electrical Symbols — Semiconductor Diodes
Related Solution:
Processing Flow Chart is a simplified sketch used in chemical and process engineering to illustrate general plant streams, major equipment, and key control loops. ConceptDraw DIAGRAM enhanced with Flowcharts Solution is ideal software for designing ✔️ Processing Flow Charts, ✔️ Process Flow Charts, ✔️ Flow Chart Process Maps
Picture: Processing Flow Chart
Related Solution:
A flowchart is a simple but very functional tool when it comes to understanding a workflow or to removing unnecessary stages from a process. When drawing flowcharts, keep in mind that there are four common types of flowcharts, like document flowcharts and data flowcharts that show control over a data or document flow over a system. To show controls on a physical level, use system flowcharts. In addition, to show controls in a program, you can draw a program flowchart.
This flowchart diagram represents the piece of an article editing process, that involves the author and editor. It was created using the Basic Flowchart notation that consists from the basic flowchart symbols. The start and the end of the process are indicated with "Terminator" symbols. The "Process" symbols show the action steps consisting from making edits and searching for a compromise, when the author does not agree with the suggestions of the editor. The "Process" symbol is the general symbol in process flowcharts. The "Decision" symbol indicates a branching in the process flow. There are two branches indicated by a Decision shape in the current flowchart (Yes/No, Disagree/Agree). This basic flowchart can be used as a repeating unit in the workflow diagram describing the working process of some editorial office.
Picture: Types of Flowcharts
Related Solution:
Easy charting software comes with beautiful chart templates and examples. This makes it easy to create professional charts without prior experience.
Picture: Chart Templates
Use the ConceptDraw DIAGRAM software that has vector clipart of numerous cable connectors, examples, and templates for drawing different types of audio and video connection diagrams. Paste icon of the receiver or another device to page and layout sockets and plugs. Further connect plugs with each other, and now you have well-designed connection diagram.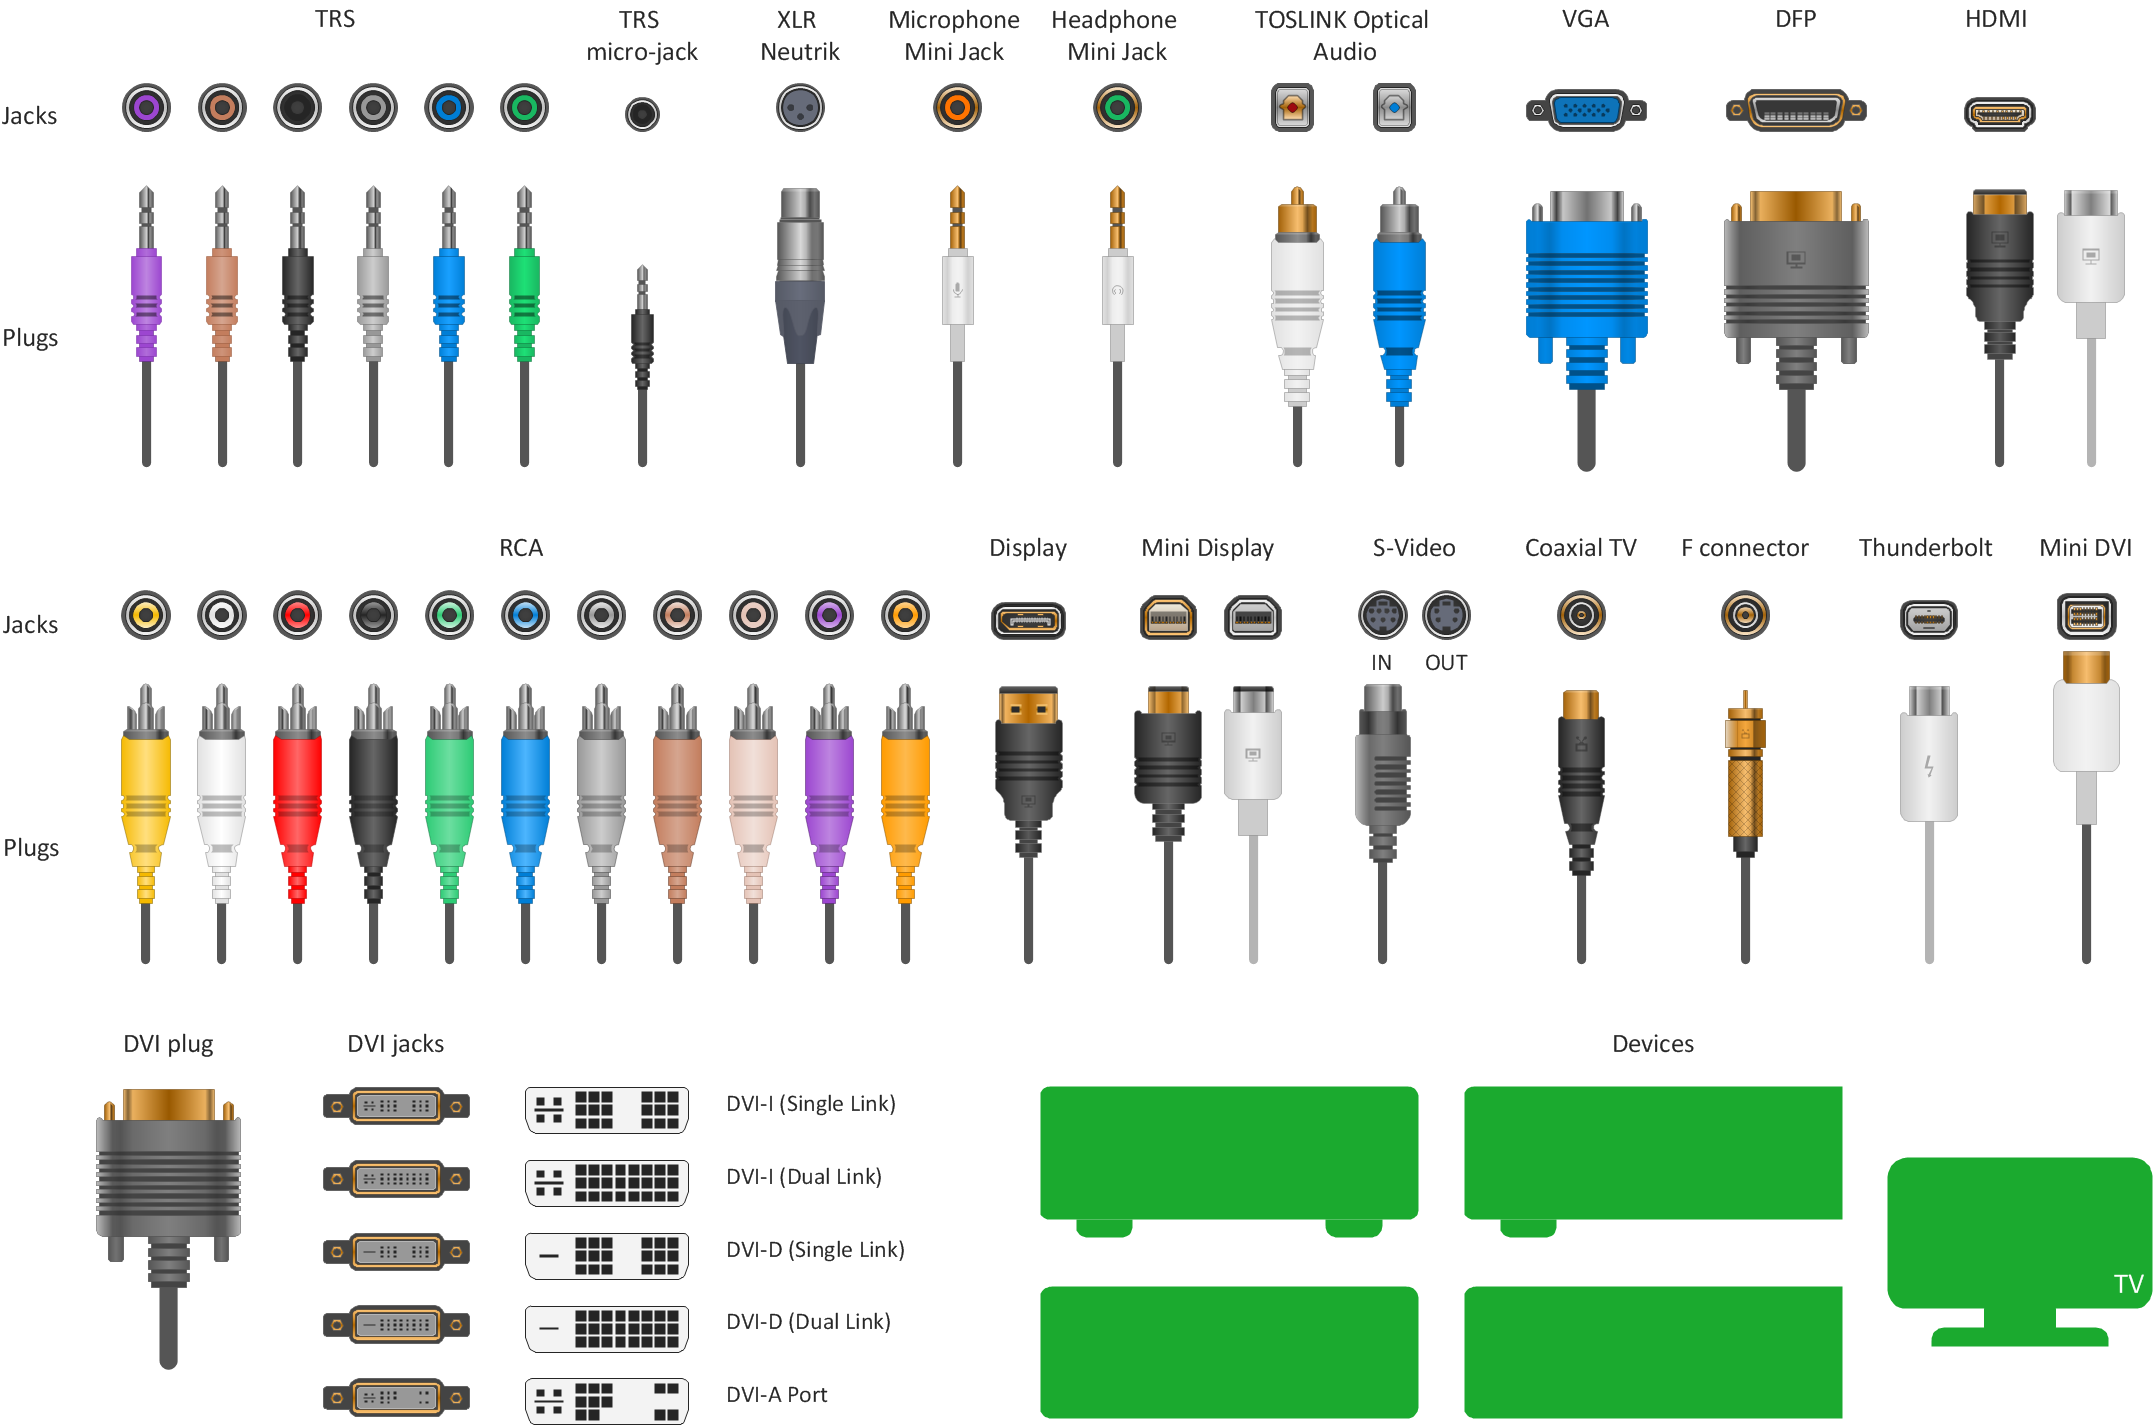
Picture: How to Make Audio and Video Connections
Related Solution:
This sample shows the Flowchart that displays the solid-state welding processes, the types of welding.
Picture: Types of Welding in Flowchart
Related Solution:
Mac compatible remote presentation, A simple way to share your presentation remotely via Skype. All participants receive presentation file.
Picture: Mac Compatible Remote Presentation
Related Solution:
A mindmap used to illustrate an overview of a Twitter campaign for a new software product.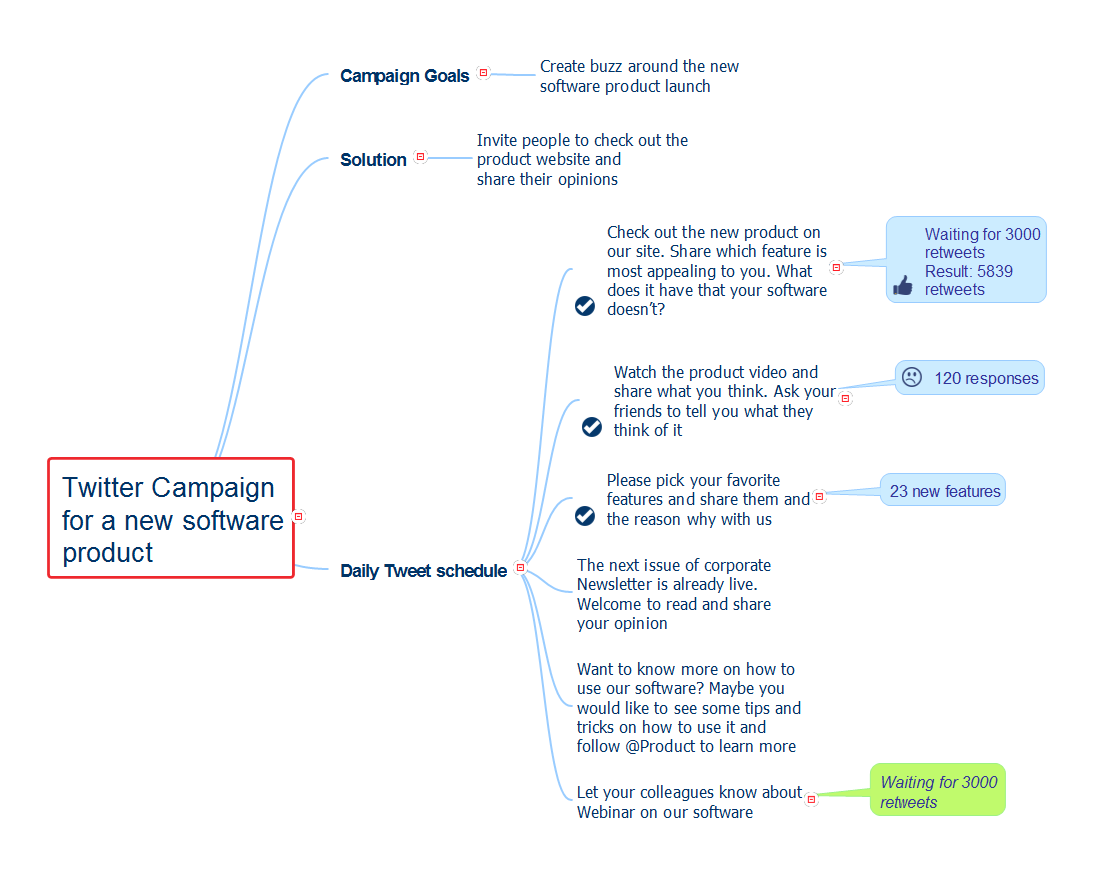
Picture: New Software Product
Related Solution:
ConceptDraw DIAGRAM is the professional business graphic software for drawing diagrams and charts with great visual appeal on Mac OS X.
Picture: The Best Drawing Program for Mac
Related Solution:

