Best Program to Create a Flowchart
ConceptDraw DIAGRAM
ConceptDraw DIAGRAM is the best program to create flowcharts allows you create professional looking flowcharts. The software delivers built-in object libraries with vector stencils that allows you to use RapidDraw technology.

Sample 1. Flowchart: Website launch.
This flow chart example visualizes business process of website launch.
Use ConceptDraw DIAGRAM diagramming and business graphics software to draw your own business process flowcharts.
See also Samples:
TEN RELATED HOW TO's:
ConceptDraw DIAGRAM is a business flowchart software includes the wide flowchart examples package.
Picture: Basic Flowchart Examples
Related Solution:
ConceptDraw DIAGRAM - workflow software extended with the Workflow Diagram solution provides a complete set of samples, templates and features help you to draw diagrams faster. A workflow software you use for drawing workflow diagrams and business process flow diagrams should provide a wide set of examples allows you get closer with workflow diagrams, learn symbols meaning, find appropriate layout and design, and then start drawing your own workflow diagram masterfully. Workflow diagrams used for orchestrating organizational processes between company departments and humans, so critical process diagrams used to train many people to interact must be clear and professional to convey an idea from a view. Thats a reason we created a lot workflow symbols and workflow icons collected them into special Workflow Diagram solution in ConceptDraw Solution Park.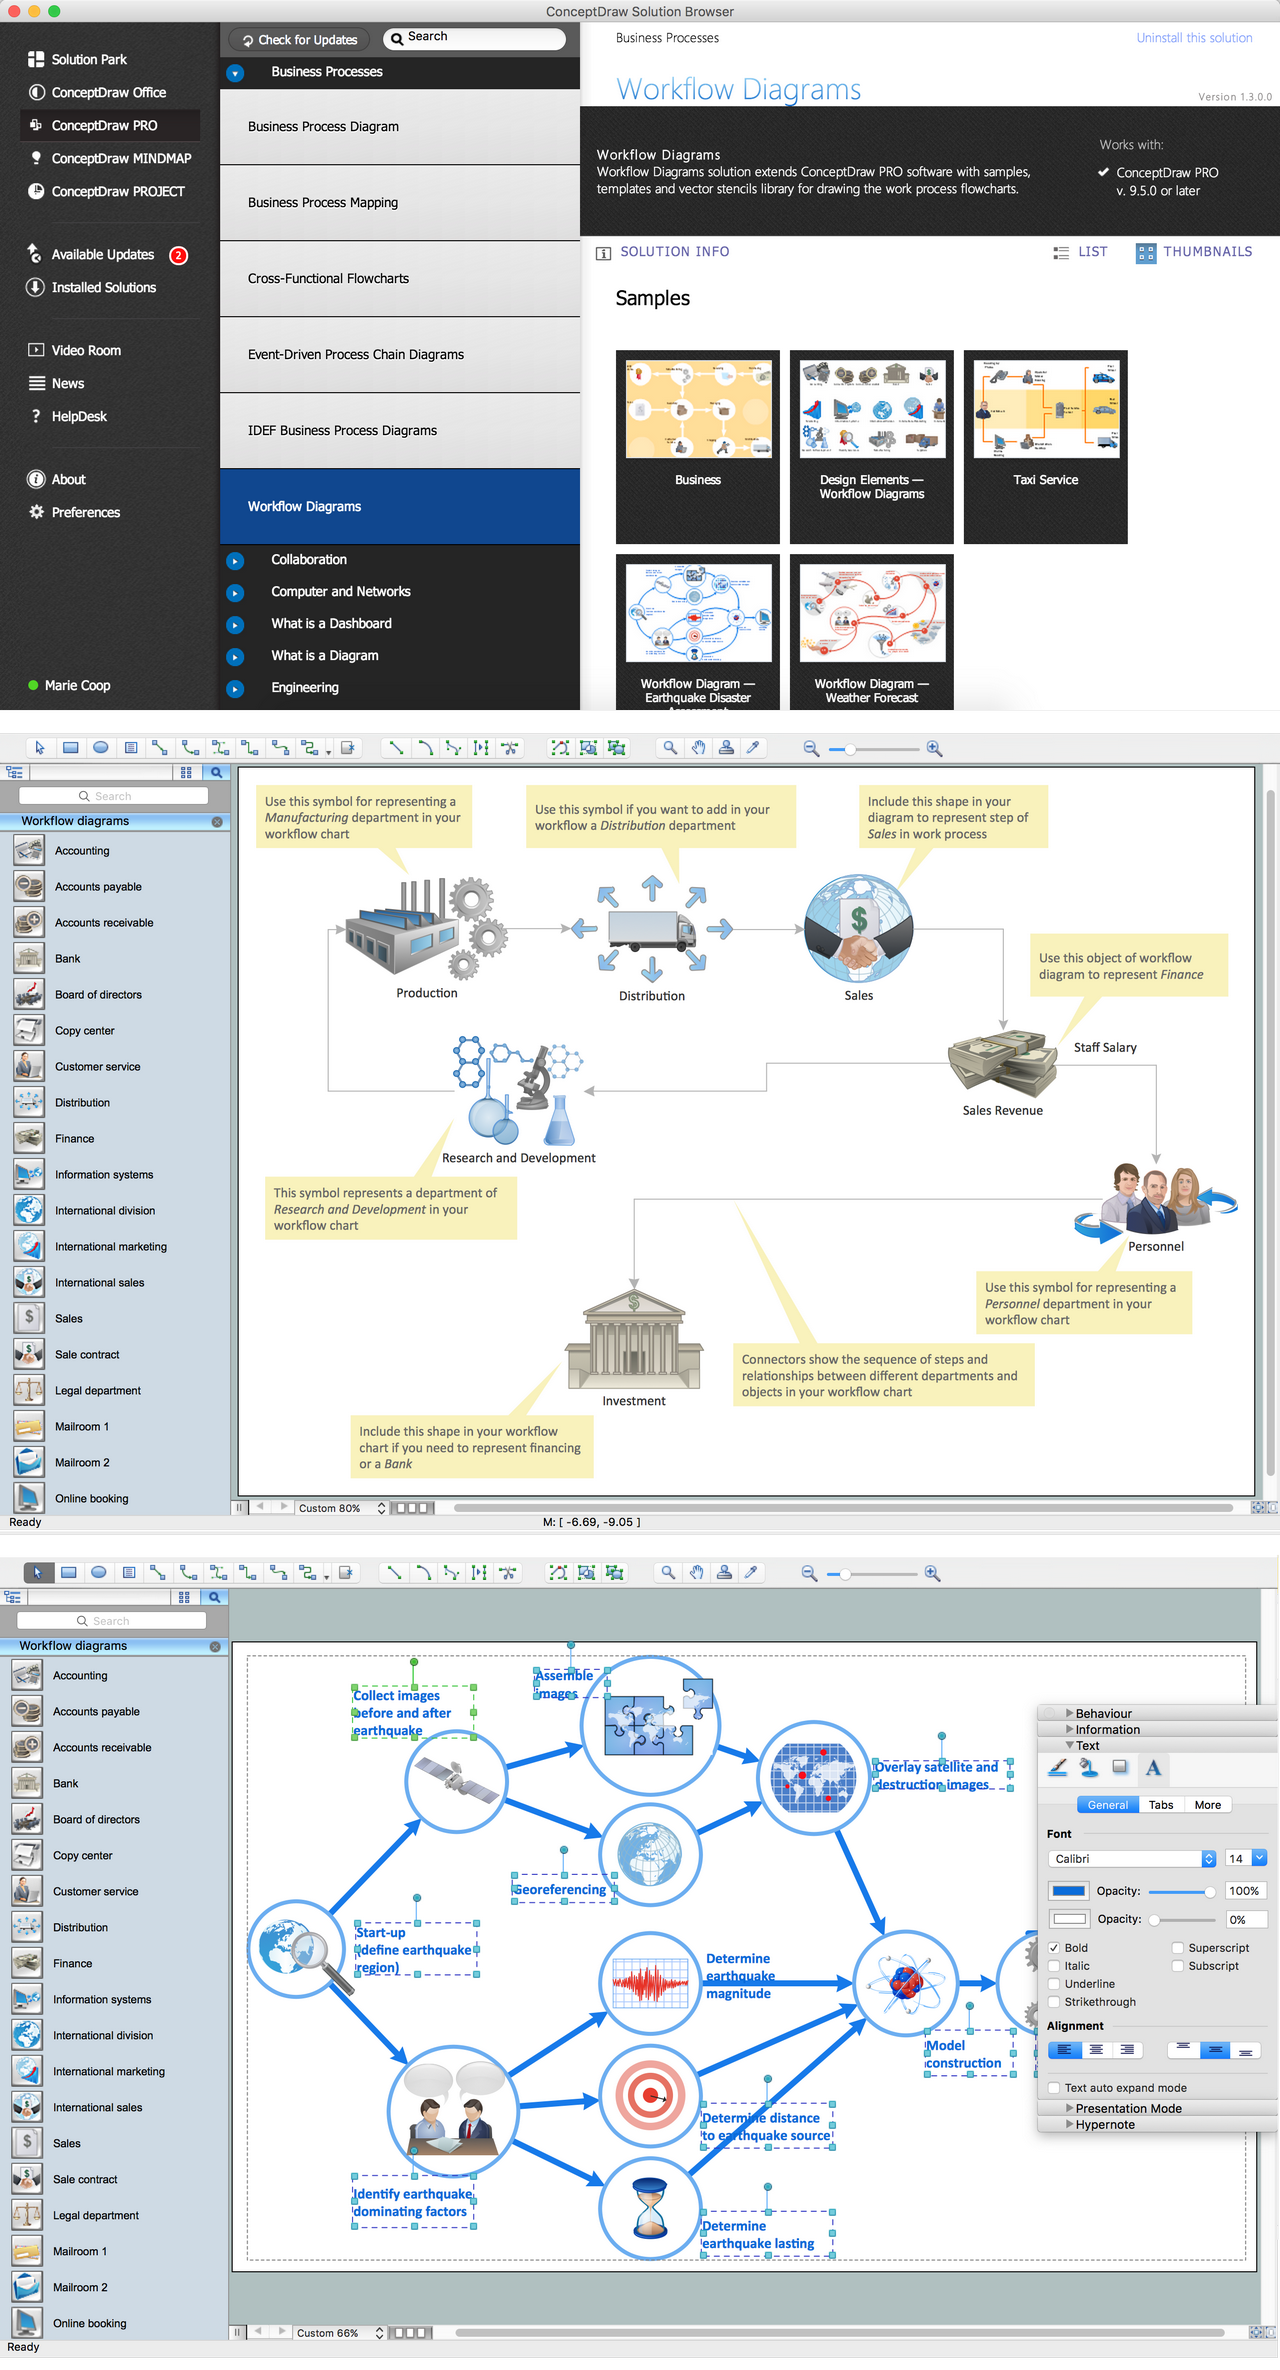
Picture: Workflow Diagram Examples
Related Solution:
This sample shows the Flowchart of the testing the work of the lamp and decision making about what to do to lamp will work.
Picture: Samples of Flowchart
Related Solution:
Flowcharts are used to represent accounting information in a system. In ConceptDraw software there are special symbols that are used to create accounting flowcharts.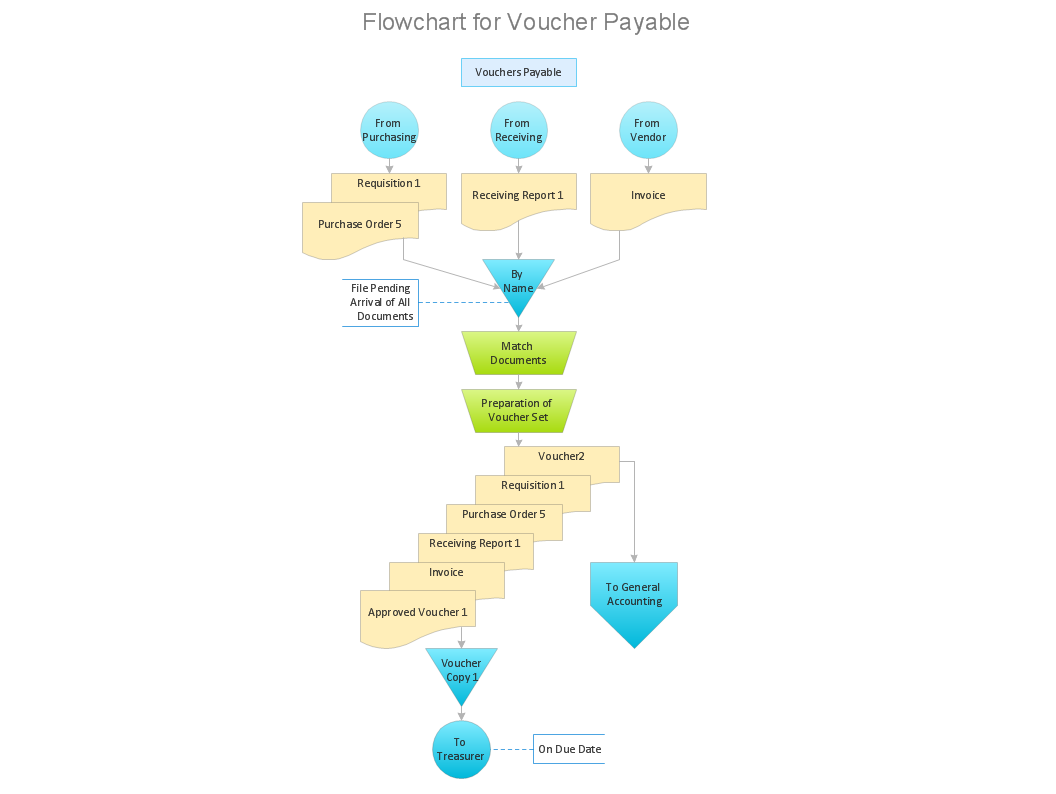
Picture: Why Flowchart is Important to Accounting Information System?
Related Solution:
Accounting flowchart is a pictorial way to represent the flow of data in an organization and the flow of transactions process in a specific area of its accounting or financial department. Accounting Flowcharts solution contains the full set of standardized accounting flowchart symbols which will help you design in minutes various types of Accounting Flowcharts including such popular diagrams which represent the whole accounting process: Purchasing Flowchart, Receiving Flowchart, Voucher Payable Flowchart, Treasurer Flowchart, Payment Flowchart.
Picture: Accounting Flowchart Purchasing Receiving Payable and Payment
Related Solution:
ConceptDraw DIAGRAM is the world’s premier cross-platform business-diagramming tool. Many, who are looking for an alternative to Visio, are pleasantly surprised with how well they can integrate ConceptDraw DIAGRAM into their existing processes. With tens of thousands of template objects, and an easy method for importing vital custom objects from existing Visio documents, ConceptDraw DIAGRAM is a powerful tool for making extremely detailed diagrams, quickly and easily.
Picture: ConceptDraw DIAGRAM : Able to Leap Tall Buildings in a Single Bound
Related Solution:
It is very difficult to get into database model idea without any examples. To create one, you can use Chen’s notation for Entity Relationship Diagrams (ERD) and try to see all the peculiarities yourself. This notation describes entities and relations as basic geometric shapes like rectangles and diamonds.
Chen notation for Entity-relationship diagrams is used for designing relational databases. It depicts the database entities as a set of subjects. For example events, people, ideas, etc. All entities has common characteristics (attributes). Any object of the system is identified as the sole and unique. The name of entity should indicate the class or type of the the whole object, not a given example. The connection commonly represents a relationship between entities. Conceptdraw Entity-Relationship Diagrams (ERD) solution provides the libraries with ready-to-use ERD element fitting Chen's notation objects and relationships.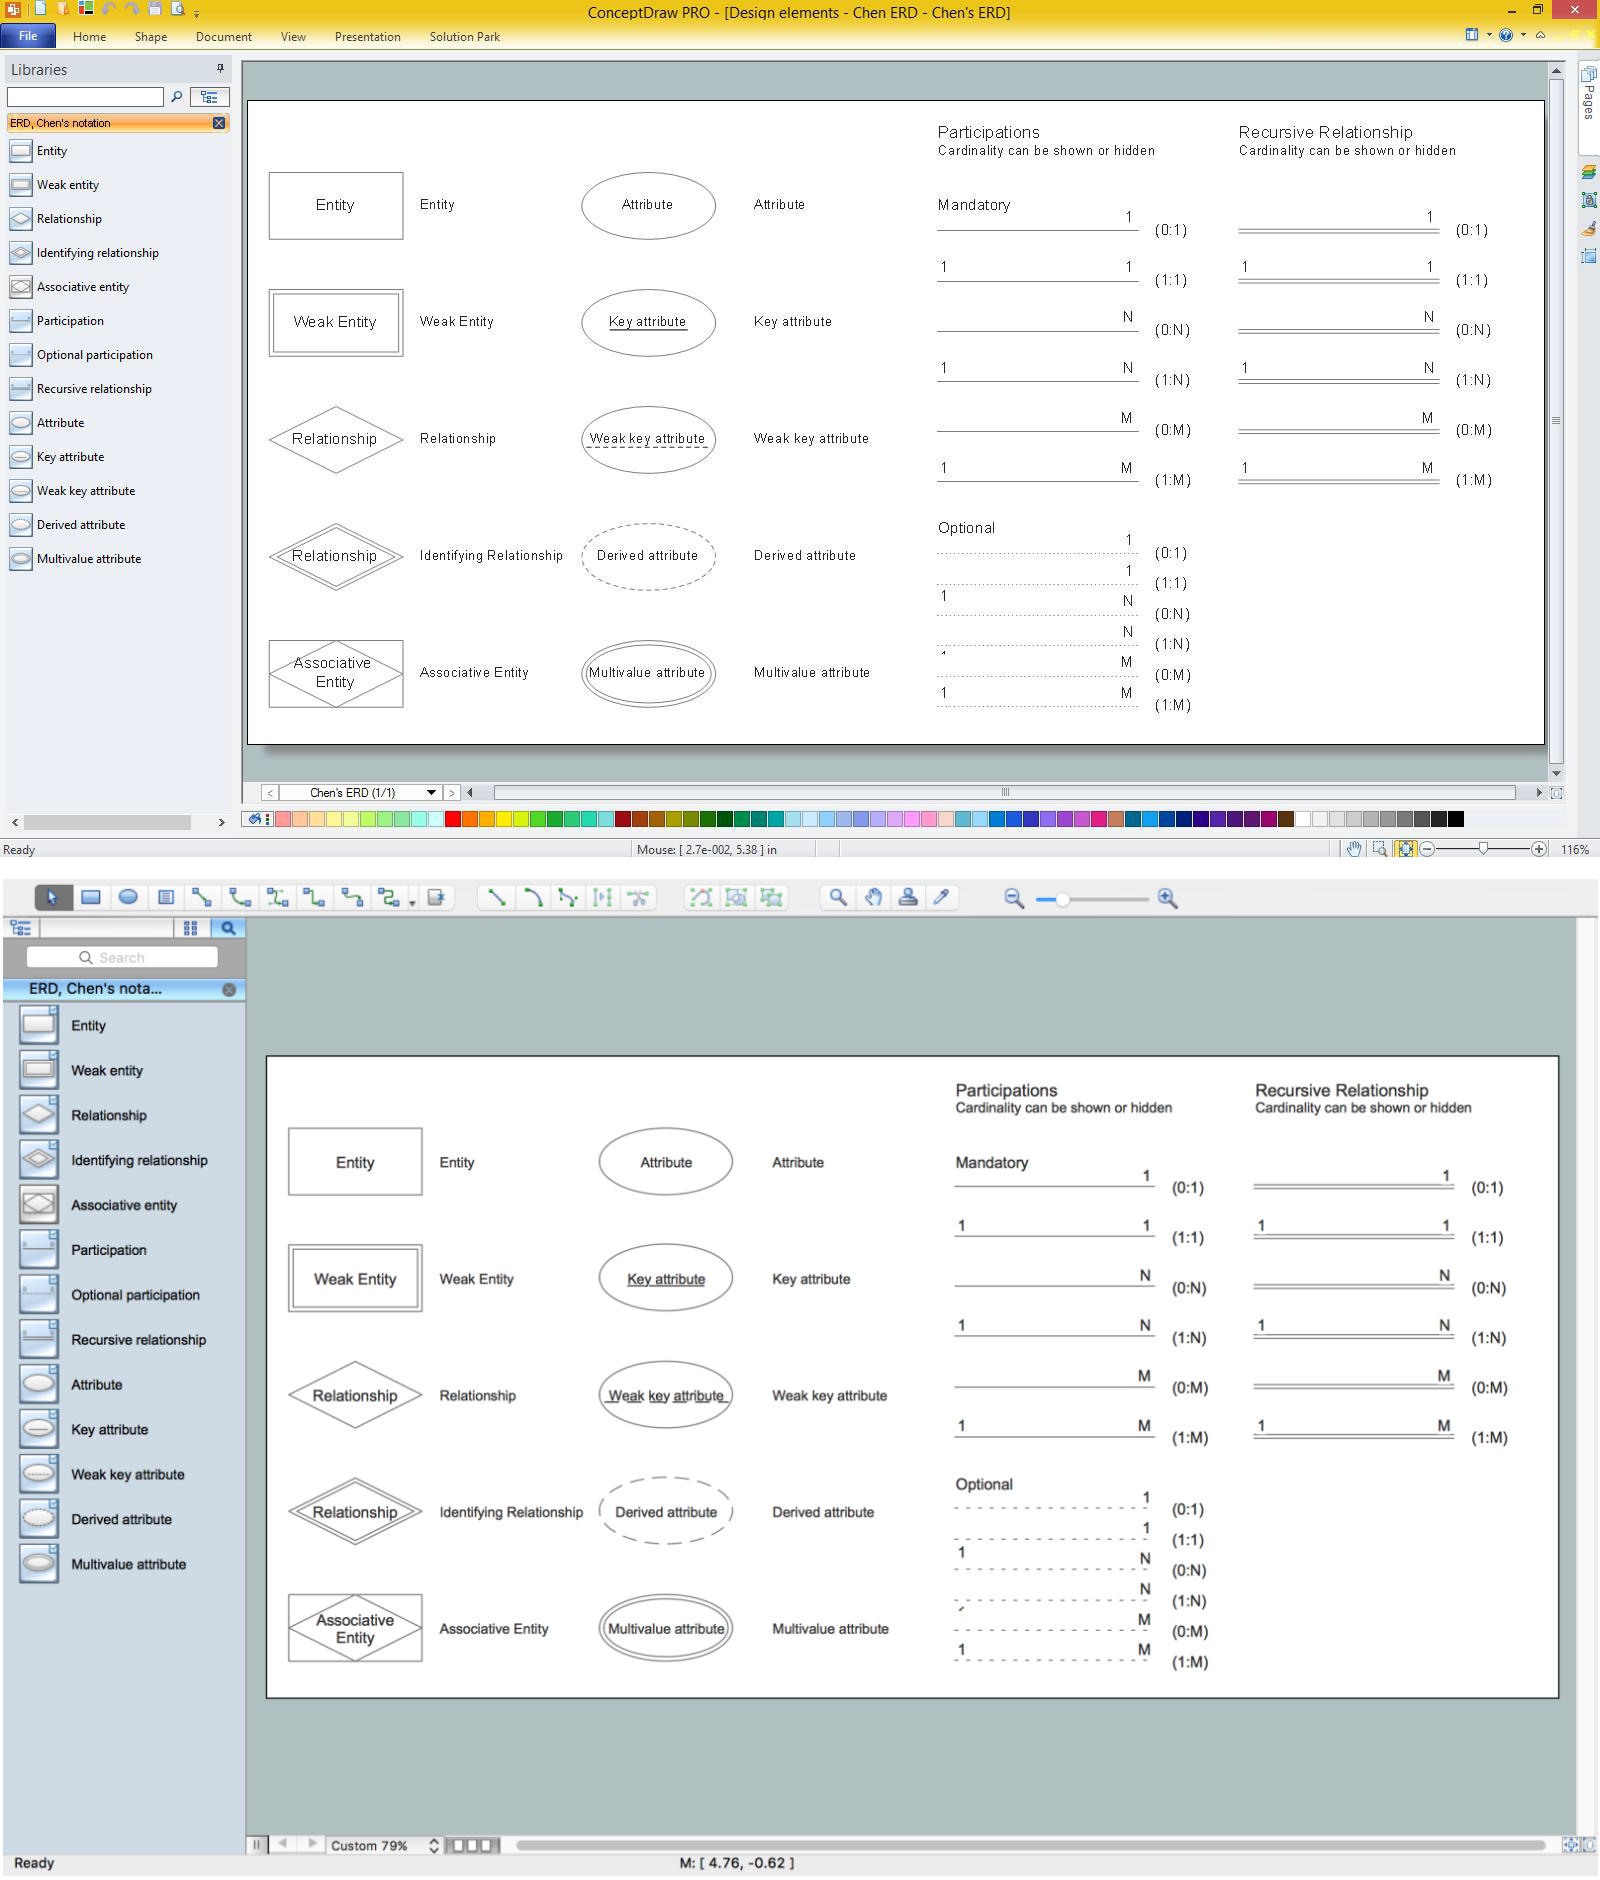
Picture: Design Element: Chen for Entity Relationship Diagram - ERD
Related Solution:
This sample was created in ConceptDraw DIAGRAM diagramming and vector drawing software using the Business Process Diagram Solution from the Business Processes area of ConceptDraw Solution Park. The Business Process Solution is based on the standard BPMN 2.0 and includes the set of libraries of ready-to-use objects.
Picture: BPR Diagram. Business Process Reengineering Example
Related Solution:
The Audio & Video Connectors solution contains a set of pre-designed objects, libraries, templates, and samples; allowing quick and easy diagramming of various configurations of audio and video devices.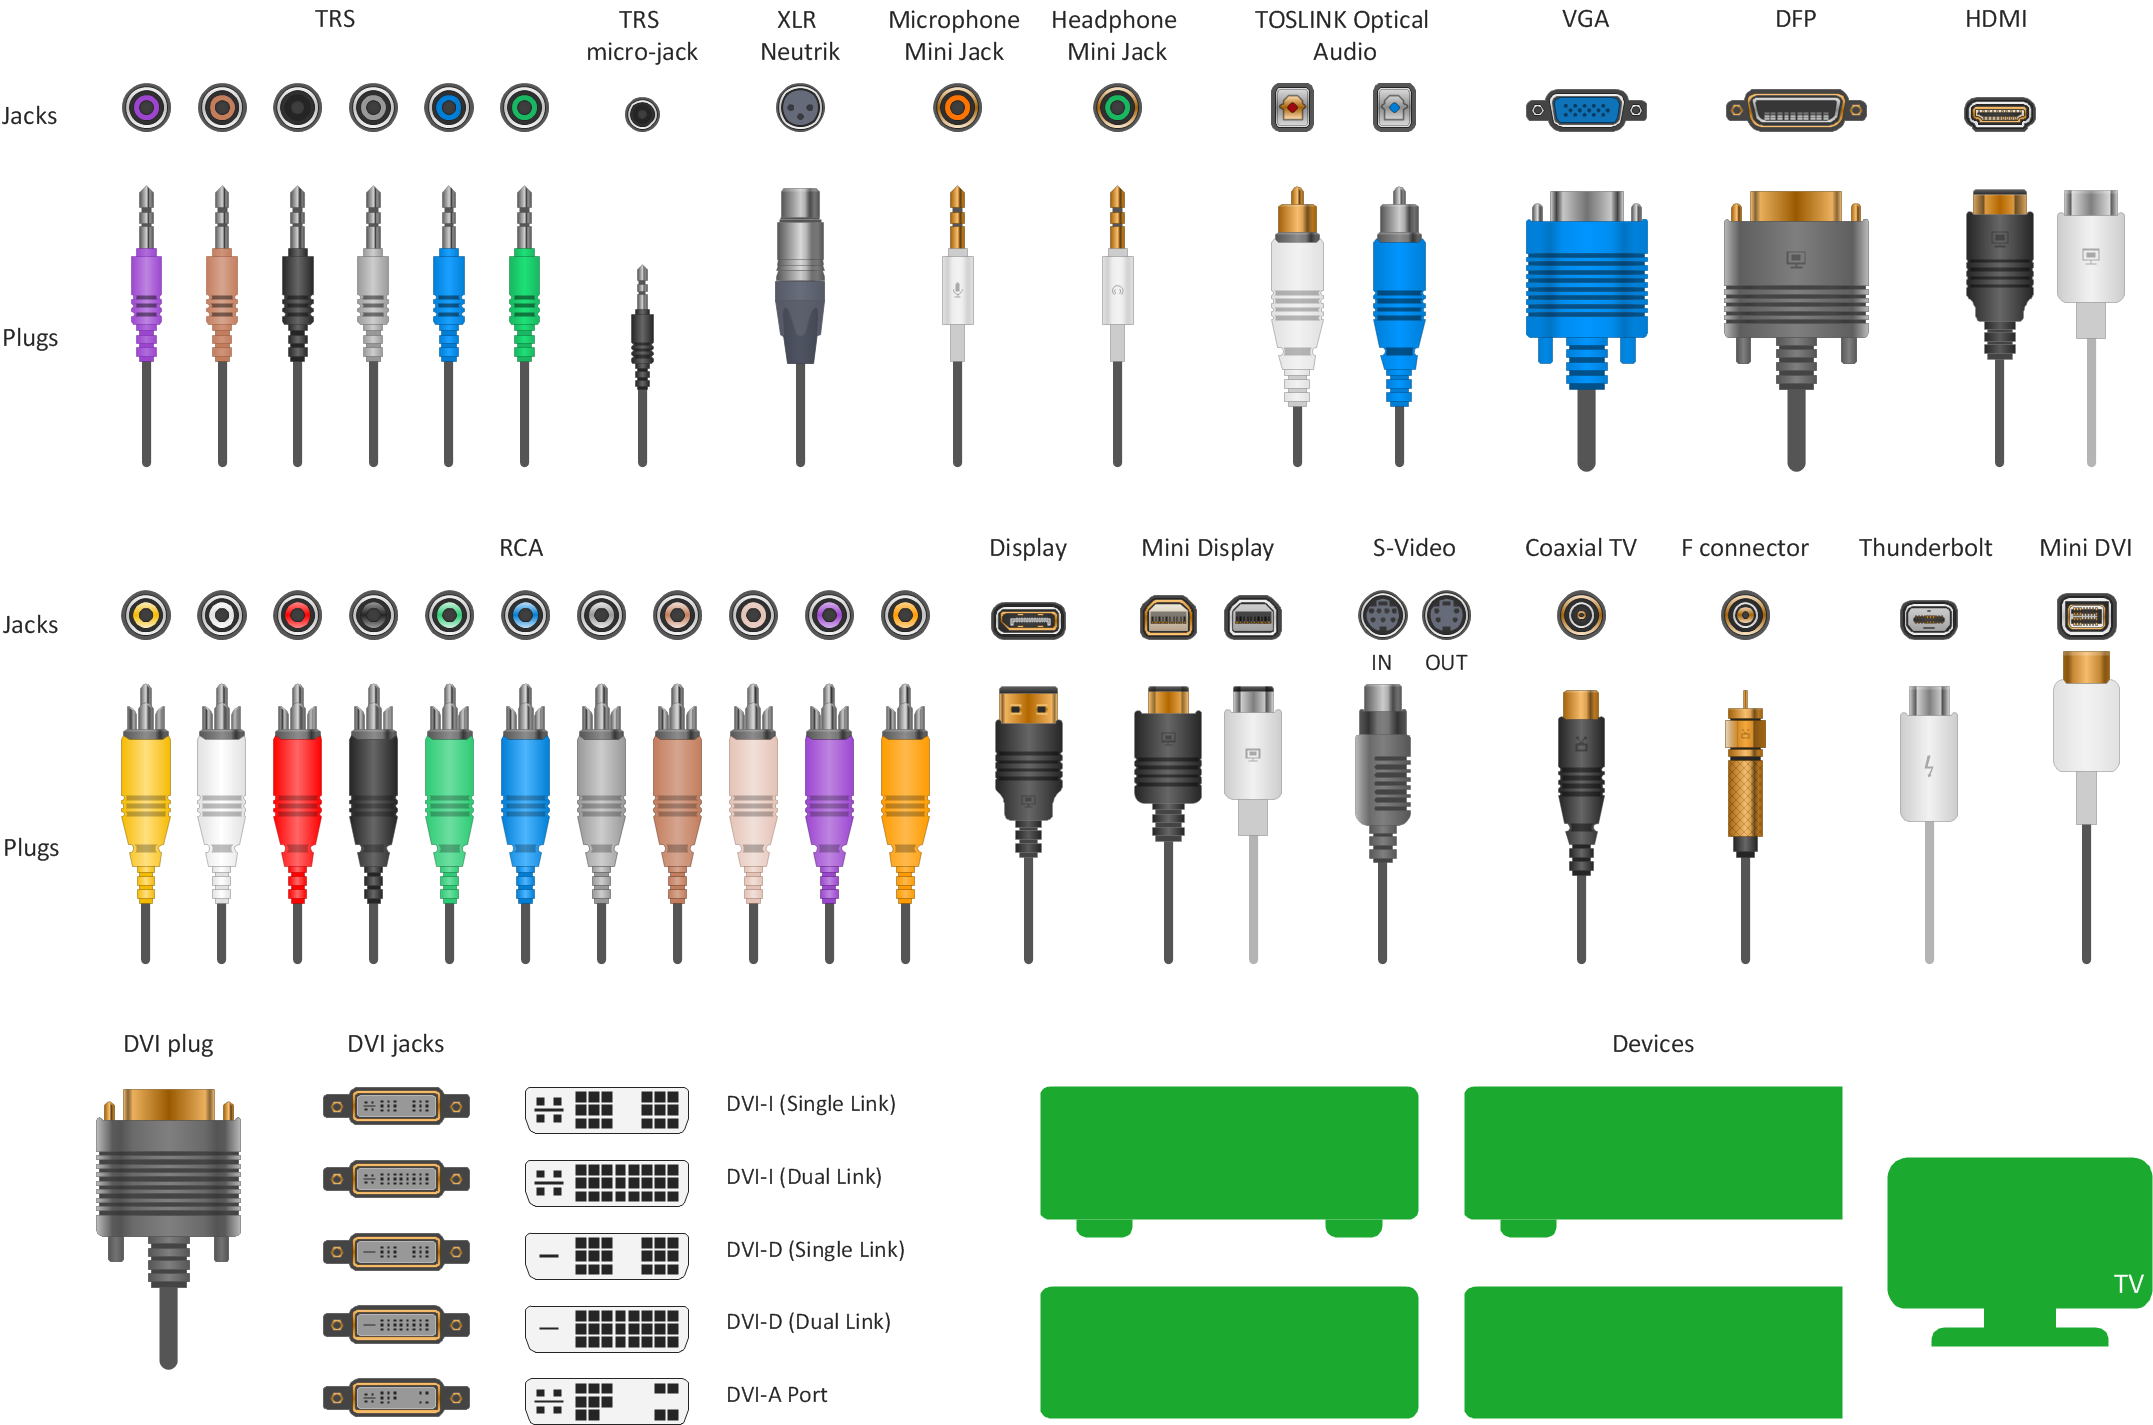
Picture: Standard Universal Audio & Video Connection Types
Related Solution:
Electrical Engineering Solution used together with ConceptDraw DIAGRAM drawing facilities makes short a work of drawing various electrical and electronic circuit schemes. A library of vector objects composed from symbols of Analog and Digital Logic elements of electric circuit includes 40 symbolic images of logic gates, bistable switches of bi-stable electric current, circuit controllers, amplifiers, regulators, generators, etc. All of them can be applied in electronic circuit schemes for showing both analog and digital elements of the circuit.
Electrical Engineering Solution used together with ConceptDraw DIAGRAM drawing facilities makes short a work of drawing various electrical and electronic circuit schemes. A library of vector objects composed from symbols of Analog and Digital Logic elements of electric circuit includes 40 symbolic images of logic gates, bistable switches of bi-stable electric current, circuit controllers, amplifiers, regulators, generators, etc. All of them can be applied in electronic circuit schemes for showing both analog and digital elements of the circuit.
Picture:
Electrical Diagram Symbols F.A.Q.
How to Use Electrical ConceptDraw Diagram Software
Related Solution:
ConceptDraw
DIAGRAM 18