Org Chart Diagram
Project ManagementIn PM solutions we support many project methodologies such as Agile and Simple Projects. Methodology solutions help in implementing best practices in project management. CS Odessa provides Toolbox solutions to support solving issues related to planning, tracking, milestones, events, resource usage, and other typical project management functions. Toolbox Solutions help you deal with common project situations in an extraordinary way. PM TeamsBenefits ConceptDraw Solution Park creates a single information space for messaging to teams. PM Teams provides project participants and organizations with better tools that assist in task understanding, timeframe understanding, and project events in the entire organization. Improved communication fosters positive team spirit throughout. ObjectivePrepare organization charts, roles and responsibility matrices, team directories, and calendars. Solution PurposeQuickly create organizational charts, work calendars, and resource calendars using the graphic capability in ConceptDraw Office. Easily exchange project information and project maps with people who do not have ConceptDraw Office, using the powerful output capabilities in ConceptDraw Office. Intended ForProject managers who need to communicate with managers throughout the organization including human resources managers, senior managers, stakeholders, and department managers. Products and MethodsThe solution’s focus is on calendars and work charts. This tool sends messages to team members to let them know what is happening in a project. Use these tools to exchange information for internal audiences (team and task) and external audiences (organization, administration and other projects). Org Chart Diagram
Use the advantages of hierarchical tree structure of mind map while developing the organizational structure of your organization. Create an Organizational Chart from your map. Double click the icon to create an Organizational Chart. |

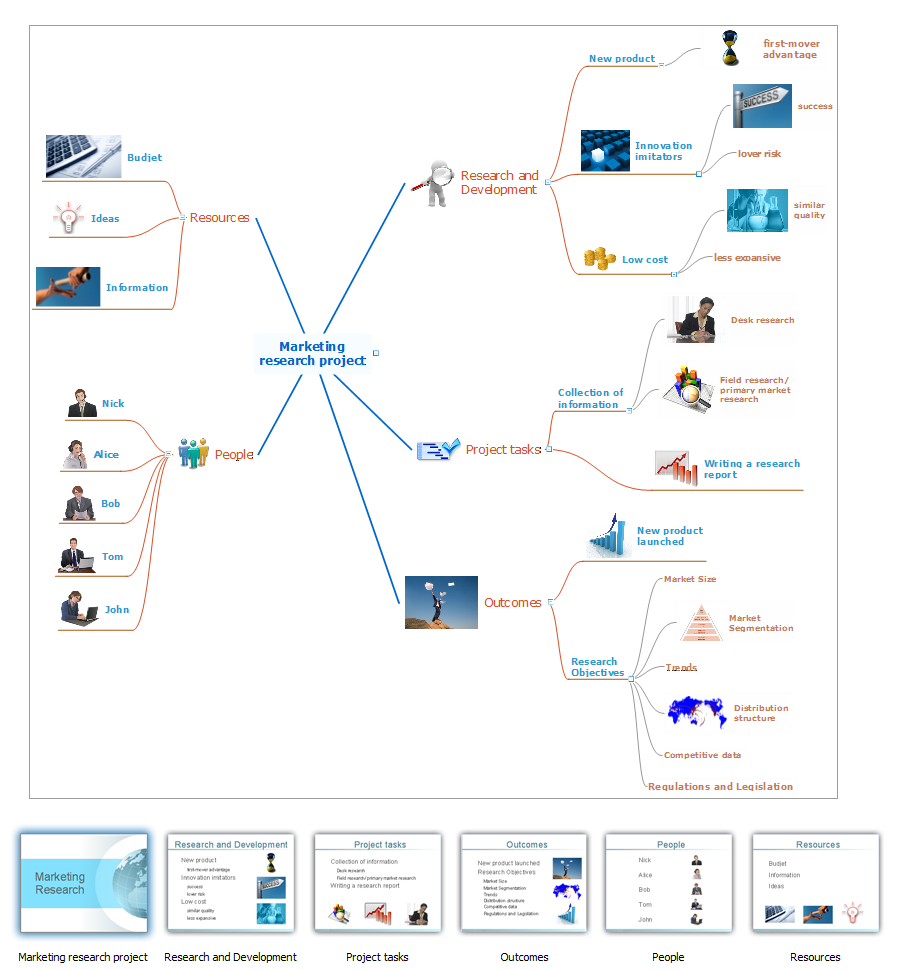
Example 1. Org Chart Diagram
The Benefits for ConceptDraw MINDMAP Brainstorming Software
- ConceptDraw MINDMAP is effective for brainstorming, designing mind maps, idea generating, creative and lateral thinking, creativity and problem solving.
- ConceptDraw MINDMAP is ideal for team and personal work in Business, Marketing and Project Management.
- The libraries with large quantity of vector objects help to illustrate your mind maps and to make them bright, visual and comprehensible.
- Use of View Navigator tool lets create presentations from a mind map: you can simply select the map parts you want to present, sequence your slides, and preview the presentation.
- ConceptDraw MINDMAP provides wide capabilities of importing and exporting in various formats: Microsoft PowerPoint, Microsoft Word, MS Excel, Mindjet MindManager, image, HTML, PDF file.
TEN RELATED HOW TO's:
Structured Systems Analysis and Design Method. SSADM with ConceptDraw DIAGRAM →
A waterfall model describes software development process as a sequence of phases that flow downwards. SSADM is one of the implementations of waterfall method. It’s easier to learn about structured systems analysis and design method (SSADM) with ConceptDraw DIAGRAM because this software has appropriate tools for creating data flow diagrams. You can use all the three main techniques of SSADM method with special tools and predesigned templates. This data flow diagram illustrates the Structured Systems Analysis and Design Method. This method method considers analysis, projecting and documenting of information systems. Data flow models are the most important elements of SSADM and data flow diagrams are usually used for their description. It includes the analysis and description of a system as well as visualization of possible issues.
Ansoff Matrix →
ConceptDraw DIAGRAM software extended with Matrices Solution from the Marketing Area of ConceptDraw Solution Park offers you the possibility to develop the Ansoff Matrix of any complexity.
Line Chart Template for Word →
This sample was created in ConceptDraw DIAGRAM diagramming and vector drawing software using the Line Graphs Solution from Graphs and Charts area of ConceptDraw Solution Park. This sample shows the Line Chart of annual percentage change. The Line Chart allows you to clearly see the changes of data over the time.
How to Make a Timeline →
Timeline is a type of diagram which illustrates the series of events in a chronological order on a linear timescale. How to make a timeline? It is convenient to use a modern powerful software. ConceptDraw DIAGRAM diagramming and vector drawing software extended with Timeline Diagrams solution from the Management area is exactly what you need.
Education Infographics →
The Education Infographics are popular and effectively applied in the educational process. Now you don't need to be an artist to design colorful pictorial education infographics thanks to the unique drawing tools of Education Infographics Solution for ConceptDraw DIAGRAM diagramming and vector drawing software.
Matrix Organization Structure →
Matrix organizational structure is one of the main forms of structures which is actively used by organizations to carry forth the functions of a company visually and effectively. Now we have ConceptDraw DIAGRAM diagramming and vector drawing software extended with 25 Typical Orgcharts solution from the Management area of ConceptDraw Solution Park which will help easy represent matrix organizational structure of any degree of complexity.
How to Draw a Bubble Chart →
Video tutorials on ConceptDraw products. Try it today!
How to Draw an Organizational Chart →
If your company is in chaos in clutter and no one understands their rights and responsibilities, maybe it's time to change that. One of the ways to put the company in order is to draw an organization chart that would reflect the structure and show the relationships among departments and positions. This is a very useful and easy to understand scheme. This is example of the one of the most typical kind of organizational chart. It depicts an organizational structure of the hierarchical type. Its construction is similarv to pyramid. The single main position on the top - in this case, the mayor's position followed by sub-levels of authority in his command. Each position in the pyramid reports only to his supervisor, and takes only a report of direct subordinates. Such scheme limits the number of communications. This organizational structure is effectively used in public organizations. Also it is suitable for any organization with the need for multiple levels of middle managers. The ability to create organizational charts of different types is supplied with ConceptDraw Ogrcharts solutions.
Quality issues in heir organization →
ConceptDraw Quality MindMap solution is a perfect additional tool for the quality team of your organization.
Business Productivity - Management →
To support you in your tasks you can use the power of ConceptDraw DIAGRAM providing intelligent vector graphics that are useful for management diagramming and ConceptDraw MINDMAP for key management mind maps.