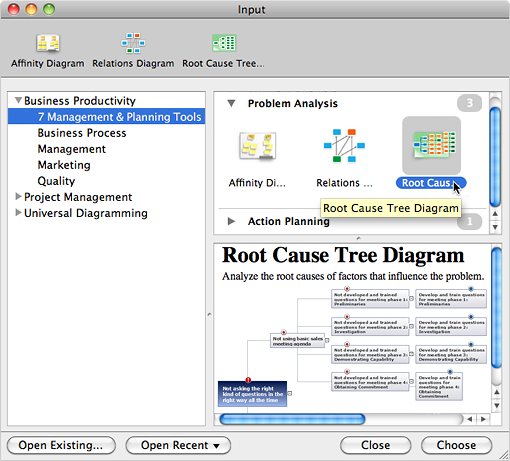
Root Cause Tree Diagram
Root Cause Tree DiagramAnalyze the root causes of factors that influence the problem. A diagram is constructed separately for each high priority factor. Identify the root causes for a factor and then propose possible corrective actions. The diagram displays the structure of causes for a factor and possible corrective actions. The Root Cause Analysis Tree Diagram is used for further formulation of actions. How to create Root Cause Tree Diagram
Analyze the root causes of factors that influence the problem. |
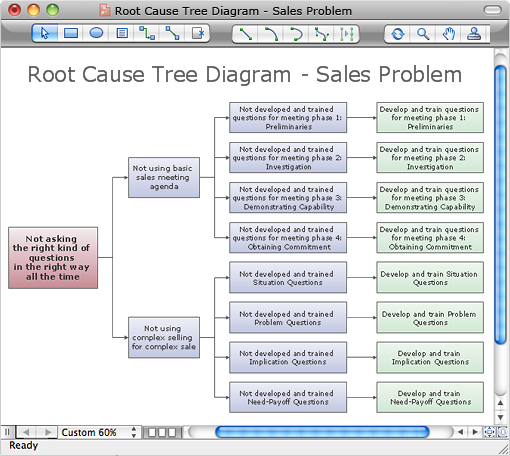

Example 2. Root Cause Tree Diagram
The Benefits for ConceptDraw MINDMAP Brainstorming Software
- ConceptDraw MINDMAP is effective for brainstorming, designing mind maps, idea generating, creative and lateral thinking, creativity and problem solving.
- ConceptDraw MINDMAP is ideal for team and personal work in Business, Marketing and Project Management.
- The libraries with large quantity of vector objects help to illustrate your mind maps and to make them bright, visual and comprehensible.
- Use of View Navigator tool lets create presentations from a mind map: you can simply select the map parts you want to present, sequence your slides, and preview the presentation.
- ConceptDraw MINDMAP provides wide capabilities of importing and exporting in various formats: Microsoft PowerPoint, Microsoft Word, MS Excel, Mindjet MindManager, image, HTML, PDF file.
TEN RELATED HOW TO's:
Matrix organizational structure is one of the main forms of structures which is actively used by organizations to carry forth the functions of a company visually and effectively.
Now we have ConceptDraw DIAGRAM diagramming and vector drawing software extended with 25 Typical Orgcharts solution from the Management area of ConceptDraw Solution Park which will help easy represent matrix organizational structure of any degree of complexity.
Picture: Matrix Organization Structure
Related Solution:
ConceptDraw DIAGRAM software enhanced with Organizational charts solution is an essential tool to ✔️ show the internal structure of an organization, ✔️ outline the hierarchy, ✔️ display key roles or job titles, ✔️ show relationships among employees or departments, ✔️ facilitate communication and cooperation, ✔️ visualize reporting relationships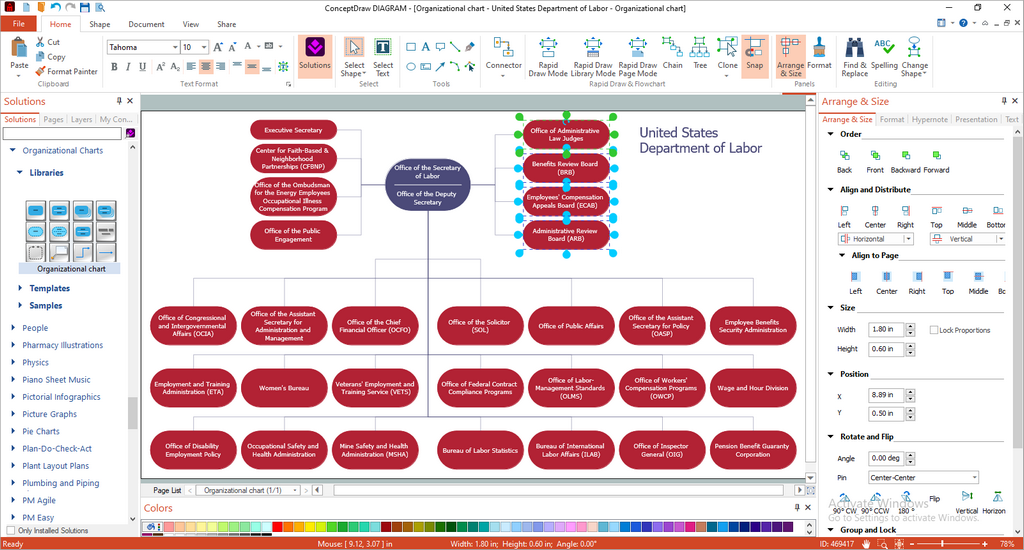
Picture: Organization Chart Software: A Comprehensive Guide
Related Solution:
If your company is in chaos in clutter and no one understands their rights and responsibilities, maybe it's time to change that. One of the ways to put the company in order is to draw an organization chart that would reflect the structure and show the relationships among departments and positions. This is a very useful and easy to understand scheme.
This is example of the one of the most typical kind of organizational chart. It depicts an organizational structure of the hierarchical type. Its construction is similarv to pyramid. The single main position on the top - in this case, the mayor's position followed by sub-levels of authority in his command. Each position in the pyramid reports only to his supervisor, and takes only a report of direct subordinates. Such scheme limits the number of communications. This organizational structure is effectively used in public organizations. Also it is suitable for any organization with the need for multiple levels of middle managers. The ability to create organizational charts of different types is supplied with ConceptDraw Ogrcharts solutions.
Picture: How to Draw an Organizational Chart
Related Solution:
Drawing of Family Emergency Plan is quite complex process. How can you make it? Usually you draw it accurately on the sheet of paper and this process takes much time. ConceptDraw DIAGRAM diagramming and vector drawing software offers you Fire and Emergency Plans Solution - the new method of quickly drawing Family Emergency Plan of any complexity.
Picture: Family Emergency Plan
Related Solution:
The Flowcharts are widely used in engineering, architecture, science, analytics, government, politics, business, marketing, manufacturing, administration, etc.
Picture:
Flowchart of Products
Flowchart ExamplesRelated Solution:
A key point of conference success is the ability to see slides in real time, and hold documented discussions during the meeting. Remote Presentation for Skype is a new solution allows real-time presenting that benefits work groups who need collaborate by web meetings.
Picture: How To Make the Right Decision in Projects
Related Solution:
Analyze the root causes of factors that influence the problem. A diagram is constructed separately for each high priority factor.
Identify the root causes for a factor and then list possible corrective action.
The diagram displays the structure of causes for a factor and possible corrective actions.
The Root Cause Tree Diagram is used for further formulation of actions.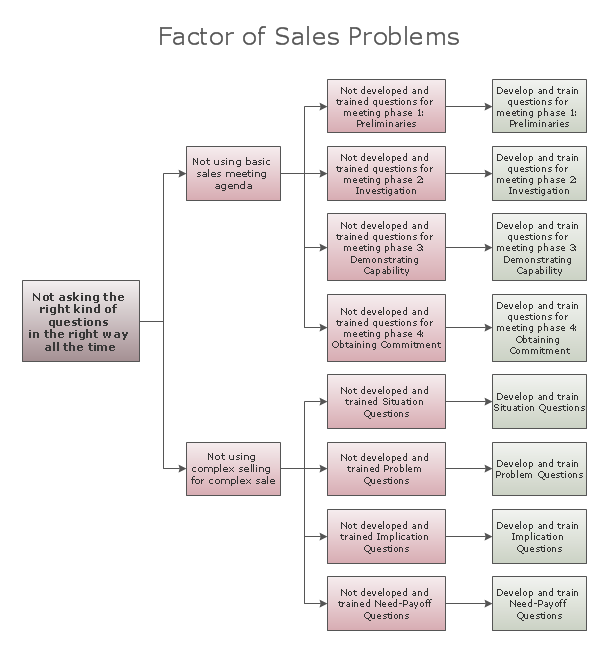
Picture: Root Cause Tree Diagram
Related Solution:
Many things can be listed as potential strengths and weaknesses of a company. To create a good-looking scheme, use SWOT analysis software and enjoy the results within a few minutes. A good practice is to make a SWOT analysis twice a year.
These drawings illustrate the possibilities of ConcptDraw solution for building SWOT and TOWS Matrices. SWOT analysis matrix demonstrates this widely used method for detection of Strengths and Weaknesses, Opportunities and Threats facing any business. If SWOT analysis is carried out properly, it can help to build a good position in the market. The ConceptDraw SWOT and TOWS Analysis solution provides a great number of templates of both SWOT and TOWS matrices. Moreover, this is the only software that offers to carry out SWOT analysis starting from making mind maps. The solution contains SWOT mind map templates. A single mouse click is needed to turn the SWOT mind map into a SWOT matrix. The SWOT diagram will be created in ConceptDraw DIAGRAM on the base of SWOT mind map.
Picture: SWOT Analysis Software: Comprehensive Guide
ConceptDraw DIAGRAM diagramming and vector drawing software offers the Fault Tree Analysis Diagrams Solution from the Industrial Engineering Area of ConceptDraw Solution Park for quick and easy creating the Fault Tree Diagram of any degree of detailing.
Picture: Fault Tree Diagram
Related Solution:
Create bar charts for business management problem solving and data comparison using the ConceptDraw DIAGRAM diagramming and vector drawing software extended with the Bar Graphs Solution from the Graphs and Charts area of ConceptDraw Solition Park.
Picture: Bar Diagrams for Problem Solving.Create business management bar charts with Bar Graphs Solution
Related Solution:
ConceptDraw
MINDMAP 16