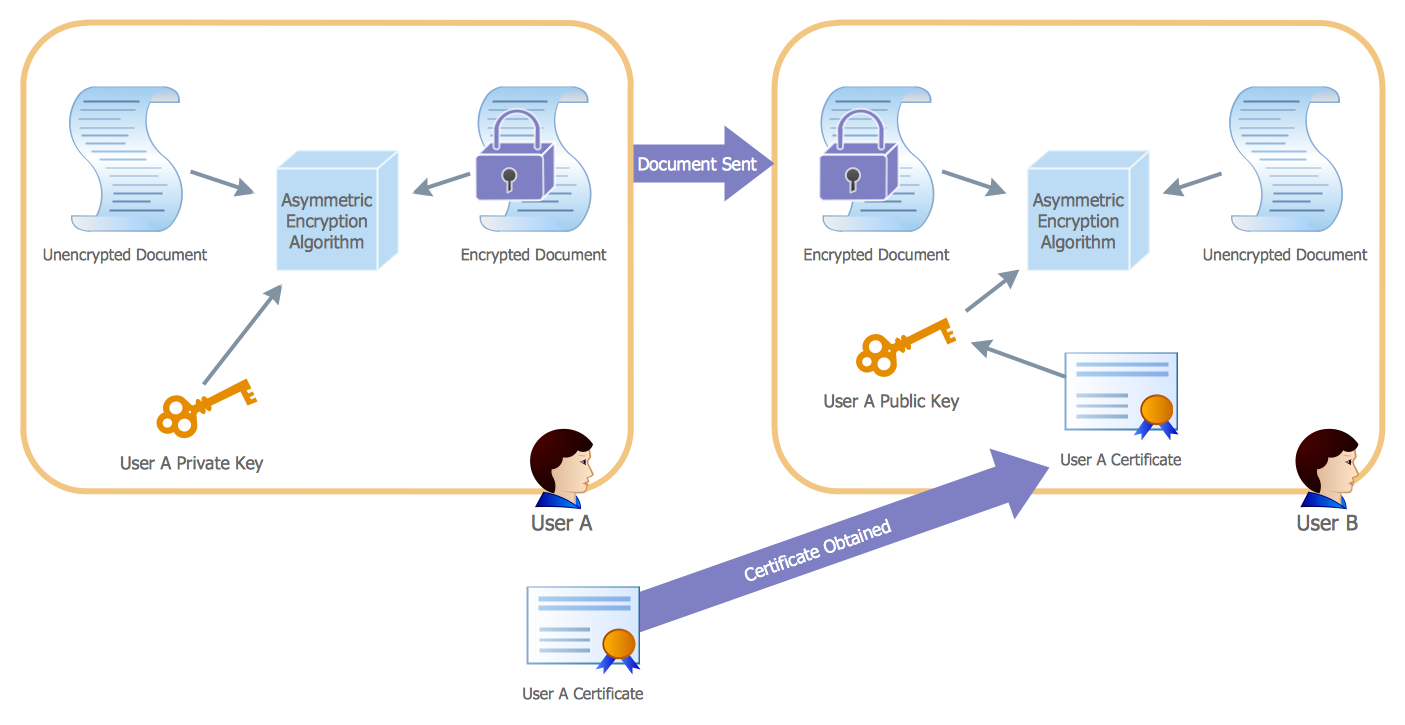
Example 1. Active Directory Diagram — Asymmetric Encryption
A directory service that Microsoft developed especially for the Windows domain networks was called as an Active Directory, being included in most of the Windows Server operating systems. It is represented as a set of the different services and processes being in charge of the so-called centralized domain management.
The Active Directory Domain Services (also known as the “AD DS”) were used for a server named as a “domain controller” authenticating as well as authorizing both users and computers in a Windows domain type network. It has been enforcing and assigning the security policies for all the computers and updating and installing software.
For instance, once some user logs into any computer that is known to be a part of a Windows domain, any Active Directory checks the submitted password, determining whether the user is a normal one or a system administrator. It also allows a storage of information and its management, provides authorization and authentication mechanisms, establishing a framework for deploying other related services, such Certificate Services, Lightweight Directory Services, Rights Management Services and Federated Services.
Active Directory is known to be using the so-called “Lightweight Directory Access Protocol” versions 3 and 2, Microsoft's version of Kerberos, and DNS. DNS is one of the Domain Name Systems that is known to be a hierarchical decentralized naming one used for services, computers, or other resources that are connected to the Internet or a private network.

Example 2. Active Directory Diagram — Tree and Forest
Associating different information with the domain names that were previously assigned to each of the participating entities, DNS translates the readily memorized domain names to the numerical IP addresses that are needed for both identifying as well as locating different computer devices and services with the underlying network protocols. By providing a worldwide, the Domain Name System is simply an essential component of the functionality on the Internet, being in use since 1985.
A network that is utilizing an Active Directory is known to be having more than one licensed Windows server computer. Restore and backup of Active Directory is always possible for any network that has a single domain controller, but Microsoft recommends using more than one domain controller in order to provide an automatic failover protection of the directory. Domain controllers are known to be ideally single-purpose only for directory operations and they should not run any other role or software.
Some Microsoft products such can interfere with the operation of some domain controller, necessitating isolation of these products on the additional Windows servers. Combining such servers can make troubleshooting or configuration of either the domain controller or the other installed software. Any business that is intending to implement the previously mentioned Active Directory can be recommended to purchase a number of Windows server licenses in order to provide for at least two separate domain controllers and the additional domain controllers for redundancy or performance as an option, a separate file server, a separate SQL Server, a separate Exchange server that can be used for supporting different server roles.
The physical hardware costs for many separate servers can be reduced. It can be done through the use of virtualization, but for proper failover protection, Microsoft always recommends not to run the multiple virtualized domain controllers on the same physical hardware. Going into more details about such processes as well as an Active Directory itself it is always possible to find more information about such things on Internet but once the decision has been made and so an Active Directory diagram has to be created, it can be done by using the ConceptDraw DIAGRAM diagramming and drawing application as well as the Active Directory Diagrams solution from another product of CS Odessa — the ConceptDraw STORE one.

Example 3. Active Directory Diagram — Site Links
There are many Microsoft Active Directory management tools that may include the Active Directory Users and Computers, the Active Directory Domains and Trusts, the ADSI Edit, the Active Directory Services and Sites, Local Groups of Users and individual Users, the Active Directory Schema snap-ins for Microsoft Management Console, etc.
The mentioned management tools may not provide enough functionality to enable the efficient workflow in some large environments, but some of the third-party solutions are known to be extending the management and the administration capabilities, providing the essential features for a more convenient administration processes: automation, integration with other services, reports, etc.
There are four stencil libraries full of 69 vector design elements that all can be used for making any needed Active Directory diagrams in the Active Directory diagrams solution. There are 21 vector objects in one of the stencil libraries, such as “Domain”, “Computer”, “User”, “Group”, “Container”, “Print Queue”, “Contact”, “Organizational Unit”, “Policy”, “Volume”, “General Object”, “Site”, “Site Link”, “Site Link Bridge”, “Server”, “NTDS Site Settings”, “IP Subnet”, “Certificate Template”, “Connection”, “Licensing Site” and many other from the other libraries.
Such examples as the one called as an “Active Directory Structure Diagram” or another one named as an “Active Directory Domain Services Diagram”, same as an “Active Directory Diagram — Asymmetric Encryption”, “Active Directory Diagram — AD LDS as a Phone Book Service” and other templates from the mentioned solution can be truly useful and helpful for all the ConceptDraw DIAGRAM users.
TEN RELATED HOW TO's:
This sample shows the Flowchart that displays the process of the achievement the consensus, in other words solving for the acceptable solution.
This Flowchart has start point. The rectangles on it represent the steps of the process and are connected with arrows that show the sequence of the actions. The diamonds with yes/no shows the decisions. The Flowcharts are widely used in marketing, business, analytics, government, politics, engineering, architecture, science, manufacturing, administration, etc.
Picture: Example Basic Flowchart. Flowchart Examples
Related Solution:
It's no secret that there is a list of skills that every average system administrator should have. And it's important to be able to manage domains via active directory technologies. The best way to keep all the details in mind is to draw a diagram representing users, groups and domains.
This diagram represents an Active Directory Services (Active Directory Domain Services). It can be helpful for system and network administrators to organize a network physical and logical elements (domains, data bases, servers, network equipment, end-user computers etc.) into a secure and logical structure. The logical structure of Active Directory is a hierarchical organization of all network components. The data that is stored in Active Directory comes from some diverse sources. The Active Directory diagram created using ConceptDraw Active Directory Diagram solution. It shows allocating group policies and functions assigned to end users. It helps to plan, manage and maintain the certain user access scenario.
Picture: Active Directory Diagram
Related Solution:
Activity Network and Project Evaluation and Review Technique, or PERT, charts are a way of documenting and analyzing the tasks in a project.
This diagram is constructed as part of the process in creating a schedule of corrective actions. The Activity Network Chart (PERT) shows the logical connections and consequence of tasks to be performed. It displays the time period for problem solving and the implementation of all activities through the critical path.
Picture: Activity Network (PERT) Chart
Related Solution:
Using diagrams, you can visualize the flow of the information or build a detailed data structure. There's no need to have a degree in software and database design with ConceptDraw DIAGRAM , because this software has all the tools needed in developing models and diagrams. Project planning, designing and prototyping was never so easy.
This UML diagrams can be used to visualize a model of the data base development process. A UML diagram shows a graphical view of a structure of software system: components and relationships.
Using Unified Modeling Language helps to depict logical and physical elements of a data base, visually represent requirements and sub-systems. UML diagrams allows developers to organize and predict critical issues, as well as collaborate data base information.
Picture: Software and Database Design with ConceptDraw DIAGRAM
Related Solution:
Any business process consists from a number of tasks carrying out the certain business goal. It is useful to diagram business processes to ensure that they are as foolproof, logical and sequential as possible. This business process diagram describes a typical booking process flow by the example of a cab booking process. It can be used as a roadmap for any booking system implementation. Diagramming a business process allows you to look at the entire project and take into account all types of possible scenarios. Business process diagram helps you investigate and clarify the process thoroughly so that you can find out how it can be improved. Business process diagram supports team communications by ensuring that each process element is clear and everyone in the team is on the same page.
Sometimes your company brings you less profit than you expect it to be, and it’s difficult to reveal the causes. Maybe it’s time to learn new technologies, because business diagram are easily developed by means of special software, so you won’t make any extra effort. In return, you will increase your productivity and get more done in a less time.
Picture: Business Diagram Software
Related Solutions:
An abstract representation is usually the first thing you will need while developing a database. To understand the ways that databases are structured, you should look through entity-relationship diagram examples and see the notations features and attributes. With an entity-relationship model you can describe a database of any complexity.
This Entity-relationship diagram is a tool for software developers. It enables every element of database to be managed, communicated and tested before release. This ERD was created using symbols advocated by Chen's notation. Because of a linguistic origin of the Chen’s notation, the boxes representing entities could be interpreted as nouns, and the relationships between them are in verb form, shown on a diagram as a diamond.
Picture: Entity Relationship Diagram Examples
Related Solution:
ConceptDraw DIAGRAM is perfect for software designers and software developers who need to draw Network Active Directory Diagrams.
Picture: Network Diagramming Software for Network Active Directory Diagrams
Entity Relationship Diagram (ERD) is the world-known way to show the logical structure of databases in visual manner. The best software tool for drawing Entity-Relationship Diagram is ConceptDraw DIAGRAM vector graphics software with Entity-Relationship Diagram (ERD) solution from Software Development area which gives the ability to describe a database using the Entity-Relationship model. The vector graphic diagrams produced using this solution can be successfully used in whitepapers, presentations, datasheets, posters, or any technical materials.
Picture: Entity-Relationship Diagram
Related Solution:
Computer networks nowadays are spread all across the world. The large number of parameters, such as geographic scale or communication protocols, can divide networks. One of the most common types of networks is called local area network (LAN). It convenient to represent network examples by means of diagrams.
This local area network (LAN) diagram provides an easy way to see the way the devices in a local network are interacted. The diagram uses a library containing specific symbols to represent network equipment , media and the end-user devices such as computers (PC, mac, laptop) , network printer, hubs, server and finally a modem. There are two types of network topologies: physical and logical. The current diagram represents precisely a physical type of LAN topology because it refers to the physical layout of a local network equipment.
Picture:
What is a Local Area Network?
Examples of LAN Diagrams
Related Solution:
The behavior of worker in organization is influences organizational effectiveness. A simple block diagram made with ConceptDraw Block diagrams solution can improve the understanding of expectations of workers regarding what they l contribute to organization and what they wait to obtain. Making block diagram depicting the individual behavior in organization is used in HR management to obtain an optimal and positive overall contribution to the organization.
Picture: Basic Diagramming
Related Solution: