
Pic 1. Context Diagram Template
The context diagram graphically identifies the system. external factors, and relations between them. It’s a high level view of the system. The context diagrams are widely used in software engineering and systems engineering for designing the systems that process the information.
Using the ready-to-use predesigned objects, templates and samples from the Block Diagrams Solution for ConceptDraw DIAGRAM you can create your own professional looking Block Diagrams and Context Diagram quick and easy.
The Context Diagrams produced with ConceptDraw DIAGRAM are vector graphic documents and are available for reviewing, modifying, and converting to a variety of formats (image, HTML, PDF file, MS PowerPoint Presentation, Adobe Flash or MS Visio).
See Also Samples:
TEN RELATED HOW TO's:
The behavior of worker in organization is influences organizational effectiveness. A simple block diagram made with ConceptDraw Block diagrams solution can improve the understanding of expectations of workers regarding what they l contribute to organization and what they wait to obtain. Making block diagram depicting the individual behavior in organization is used in HR management to obtain an optimal and positive overall contribution to the organization.
The behavior of worker in organization is influences organizational effectiveness. A simple block diagram made with ConceptDraw Block diagrams solution can improve the understanding of expectations of workers regarding what they l contribute to organization and what they wait to obtain. Making block diagram depicting the individual behavior in organization is used in HR management to obtain an optimal and positive overall contribution to the organization.
Picture: Basic Diagramming
Related Solution:
Pie Graph is very popular kind of charts which is widely used in various fields of science and life activities. ConceptDraw DIAGRAM extended with Pie Charts Solution from the Graphs and Charts area is the best software for drawing the Pie Graph Worksheets.
Picture: Pie Graph Worksheets
Related Solution:
If you have no time, you can create a SWOT diagram even on asphalt using a chalk. Although, in case you want a proper scheme, you should use a special software for creating SWOT analysis diagrams that would be comprehensible. SWOT analysis is useful not only for business purposes, but even for cities or for a particular person.
The ConceptDraw SWOT and TOWS Matrix Diagrams solution is a tool for performing both SWOT and TOWS analysis. It provides templates of different sorts of Matrix Diagrams. Besides different embedded templates, the solution enabling create custom SWOT and TOWS matrices. Using the compatibility between the MINDMAP and DIAGRAM is the best way of making SWOT or TOWS diagrams quickly. The mind map templates help identify the core statements of SWOT and TOWS analysis: Strengths, Weaknesses, Opportunities, and Threats. The next step is matrix creation - both SWOT and TOWS analysis use the same basic steps and the only difference is the order in which these criteria are studied.
Picture: Software for Creating SWOT Analysis Diagrams
Related Solution:
Create professional business process diagrams using ConceptDraw Events library with 17 objects from BPMN.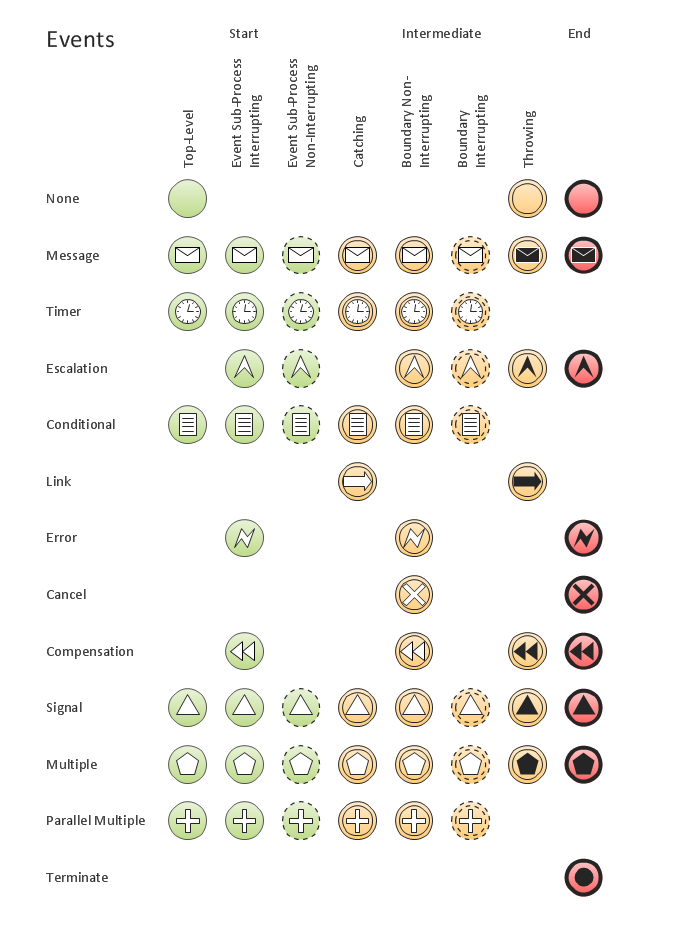
Picture: Business Process Elements: Events
Visual information is easier to perceive. You can teach even a child to make diagrams with a good flowchart example that would be interesting for it. Flowcharts can be fun, it’s not about business processes or programming algorithms.
This flowchart shows step by step process of manufacturing of Nixtamal The product which is obtained by processing maize with calcium hydroxide. We must assume that the Aztecs were very fond of this product, if the recipe of its production came to our times. This flow chart was designed using ConceptDraw DIAGRAM with its solution for designing flowcharts of various types, sizes and purposes. ConceptDraw Flowcharts solution consists from the library of flowchart symbols, containing the set vector objects. Also there are a lot of diverse templates and samples of flow charts.
Picture: Flowchart Examples and Templates
Related Solution:
When trying to figure out the nature of the problems occurring within a project, there are many ways to develop such understanding. One of the most common ways to document processes for further improvement is to draw a process flowchart, which depicts the activities of the process arranged in sequential order — this is business process management. ConceptDraw DIAGRAM is business process mapping software with impressive range of productivity features for business process management and classic project management. This business process management software is helpful for many purposes from different payment processes, or manufacturing processes to chemical processes. Business process mapping flowcharts helps clarify the actual workflow of different people engaged in the same process. This samples were made with ConceptDraw DIAGRAM — business process mapping software for flowcharting and used as classic visio alternative because its briefly named "visio for mac" and for windows, this sort of software named the business process management tools.
This flowchart diagram shows a process flow of project management. The diagram that is presented here depicts the project life cycle that is basic for the most of project management methods. Breaking a project into phases allows to track it in the proper manner. Through separation on phases, the total workflow of a project is divided into some foreseeable components, thus making it easier to follow the project status. A project life cycle commonly includes: initiation, definition, design, development and implementation phases. Distinguished method to show parallel and interdependent processes, as well as project life cycle relationships. A flowchart diagram is often used as visual guide to project. For instance, it used by marketing project management software for visualizing stages of marketing activities or as project management workflow tools. Created with ConceptDraw DIAGRAM — business process mapping software which is flowcharting visio alternative or shortly its visio for mac, this sort of software platform often named the business process management tools.
Picture: Process Flowchart: A Step-by-Step Comprehensive Guide
Related Solution:
A waterfall model describes software development process as a sequence of phases that flow downwards. SSADM is one of the implementations of waterfall method. It’s easier to learn about structured systems analysis and design method (SSADM) with ConceptDraw DIAGRAM because this software has appropriate tools for creating data flow diagrams. You can use all the three main techniques of SSADM method with special tools and predesigned templates.
This data flow diagram illustrates the Structured Systems Analysis and Design Method. This method method considers analysis, projecting and documenting of information systems. Data flow models are the most important elements of SSADM and data flow diagrams are usually used for their description. It includes the analysis and description of a system as well as visualization of possible issues.
Picture: Structured Systems Analysis and Design Method. SSADM with ConceptDraw DIAGRAM
Related Solution:
Process mapping helps with sharing business results and reorganizing workflow. In almost every case, after creating a sales process flowchart the steps that are redundant become obvious for a manager. It's easy to find a flowchart examples that will help in developing one for your business.
This sales process flowchart consists of a sequence of steps that represent a simple sale process. Each step is shown graphically by a rectangle representing processing steps or an activity, or a diamond representing a decision. These rectangles are linked by arrows, that indicate the direction of the sales workflow. ConceptDraw Sales Flowcharts solution delivers a the full set of classical flowchart notation symbols, along with sales-related icons and pictograms.
Picture:
Sales Process Flowchart
Flowchart Examples
Related Solutions:
For depicting the onion model are actively used Stakeholder Onion Diagrams. The ConceptDraw DIAGRAM diagramming and vector drawing software extended with Stakeholder Onion Diagrams Solution from the Management Area of ConceptDraw Solution Park offers the number of useful tools and Stakeholder Onion Diagram template for their easy design.
Picture: Stakeholder Onion Diagram Template
Related Solution:
Any information system receives data flows from external sources. In order to visualize them there is a list of data flow diagram symbols that describes how the system components cooperate. If you want to create a data flow diagram, ConceptDraw DIAGRAM Solution Park has DFD Library that contains both Yourdon and Gane-Sarson notations.
This figure shows the content of vector libraries, delivered with ConceptDraw solution for data flow diagram (DFD). There are three libraries composed from about 50 vector objects used to make data flow diagrams.
They include a complete set of objects utilized by Yourdon-Coad and Gane-Sarson notations - two primary notations that are apply for data flow diagramming. Also, one can discover additional "Data flow diagram (DFD)" library that provides a data flow diagram elements for designing level 1 and context-level data flow diagrams.
Picture: Data Flow Diagram Symbols. DFD Library
Related Solution: