Made with
ConceptDraw
DIAGRAM 18

UML State Machine Diagram.Design Elements

UML State Machine Diagram is a type of Behavior Diagrams that displays the finite state machine with states and state transitions.

UML State Machine Diagram is a realization of the mathematical concept of a finite state machine. State Machine Diagram is an oriented graph for finite state machine in what tops represent states and connectors show transitions between two states. States are represented as rounded rectangles and state transitions as arrows. The Initial State of the system is represented as black circle, and Final State as encircled black circle.

UML State Machine Diagram is the object-based version of Harel State Chart that is extended by UML. UML State Machines keep the main benefits of traditional finite state machines and also overcome their restrictions. UML State Machines extend the notion of actions.

The Rapid UML Solution for ConceptDraw DIAGRAM contains 13 vector stencils libraries with 393 interactive shapes that you can use to design your UML diagrams.

To design a State Machine Diagram use the UML State Machine Diagram library.

UML State Machine Diagram library contains 35 shapes:

  • Send signal state
  • Frame, Fragment
  • Entry point
  • History pseudostate
  • Junction pseudostate
  • Choice pseudostate
  • Note
  • Simple state
  • State with compartments
  • Composite state
  • Transition text
  • Transition
  • Final state
  • Terminate pseudostate
  • Exit point
  • Vertical fork/join pseudostate
  • Horizontal fork/join pseudostate
  • Composite state (with substates)
  • Initial state
  • Internal behavior
  • Self-transition 1
  • Self-transition 2
  • Sub-machine diagram
  • Receive signal state
  • Composite state
  • Subactivity state
  • Divider
  • Synch state
  • Connector
  • Text label
  • Composite state
  • Composite state (2 concurrent substates)
  • Composite state (2 substates)
  • Entry point connector
  • Connector opposite
UML State Machine Diagram library

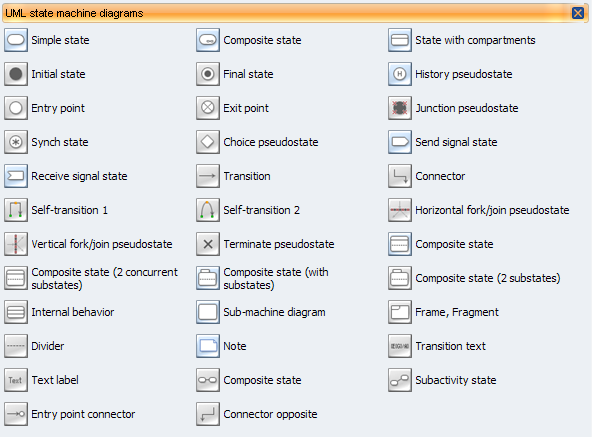
Pic.1. UML State Machine Diagram Library

UML State Machine Diagram.Design Elements *

Pic.2. UML State Machine Diagram Library Elements

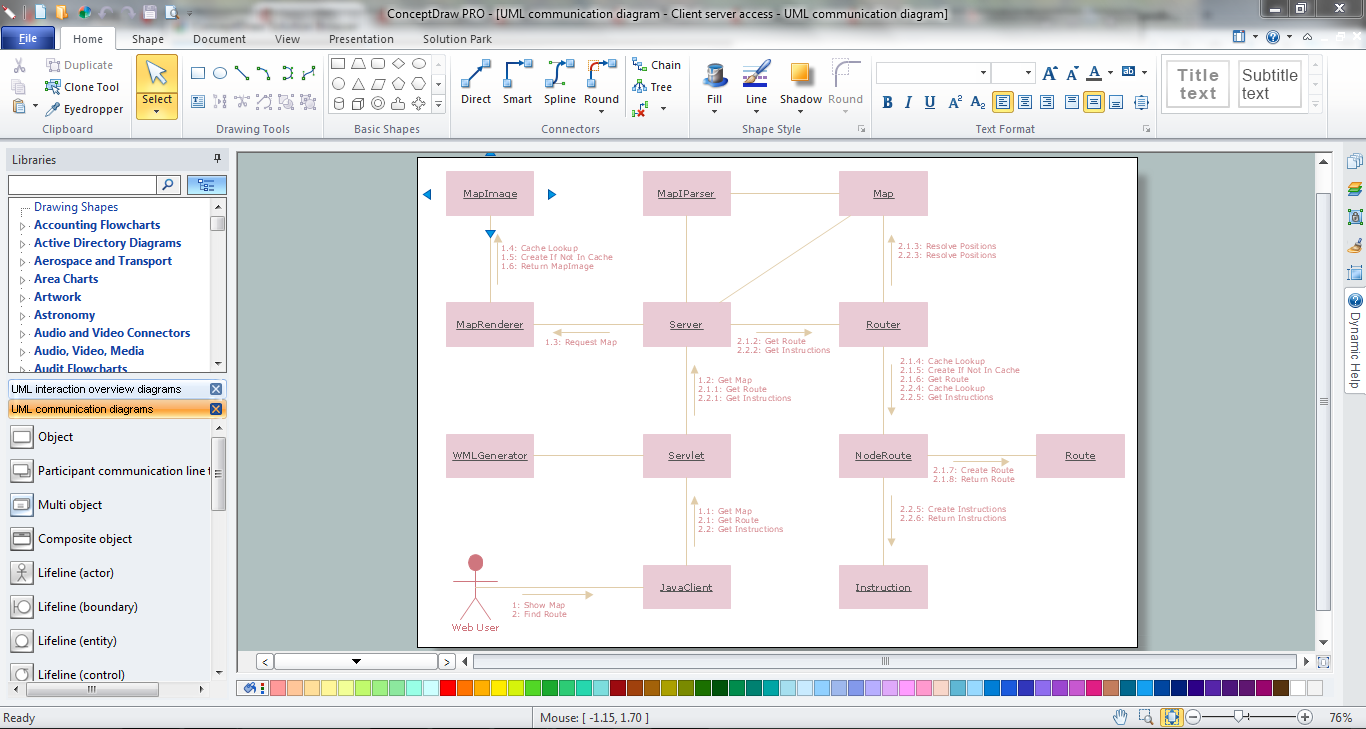
ConceptDraw Rapid UML solution provides UML State Machine Diagram library of vector stencils for drawing the state machine diagrams using state machine blocks and assembly connectors.

UML State Machine Diagram

Pic.3. UML State Machine Diagram (Mac OS X, Windows)

Use design element from the UML State Machine Diagram library to draw your own UML state machine diagrams of complex systems and software applications.

All libraries for creating UML diagrams are available inside the ConceptDraw DIAGRAM Templates and samples are located in the Rapid UML section of ConceptDraw STORE.

UML Diagram Solution

UML State Machine template

Pic.4. UML State Machine Solution in ConceptDraw STORE and UML State Machine template

The UML Diagrams produced with ConceptDraw DIAGRAM are vector graphic documents and are available for reviewing, modifying, and converting to a variety of formats (image, HTML, PDF file, MS PowerPoint Presentation, Adobe Flash or MS Visio).


NINE RELATED HOW TO's:
Lean Six Sigma (LSS) is a well-known in all over the world methodology of quality improvement and business perfection. ConceptDraw DIAGRAM diagramming and vector drawing software is a powerful Lean Six Sigma Diagram Software thanks to the included Value Stream Mapping solution from the Quality Management Area of ConceptDraw Solution Park.Lean Six Sigma Diagram Software *
Picture: Lean Six Sigma Diagram Software
Related Solution:
Usually for drawing HVAC plans you need make a lot of efforts and spend a considerable amount of time. ConceptDraw DIAGRAM software will help you radically change this. HVAC Marketing Plan design without efforts? It is reality with HVAC Plans Solution from the Building Plans Area of ConceptDraw DIAGRAM Solution Park.HVAC Marketing Plan *
Picture: HVAC Marketing Plan
Related Solution:
Mechanical design is a labour-intensive process. To facilitate the task of Mechanical Engineering Diagrams creating, ConceptDraw DIAGRAM diagramming and vector drawing software was extended with Mechanical Engineering solution from the Engineering area. Now, ConceptDraw DIAGRAM is a powerful Mechanical Design Software.Mechanical Design Software *
Picture: Mechanical Design Software
Related Solution:
UML Use Case Diagram Taxi Service - This sample was created in ConceptDraw DIAGRAM diagramming and vector drawing software using the UML Use Case Diagram library of the Rapid UML Solution from the Software Development area of ConceptDraw Solution Park. This sample shows the work of the taxi service and is used by taxi stations, by airports, in the tourism field and delivery service.UML Use Case Diagram Example - Taxi Service *
Picture: UML Use Case Diagram Example - Taxi Service
Related Solution:
The Ishikawa diagram, Cause and Effect diagram, Fishbone diagram — all they are the names of one and the same visual method for working with causal connections. Originally invented by Kaoru Ishikawa to control the process quality, the Ishikawa diagram is well proven in other fields of management and personal scheduling, events planning, time management. It is a chart in the form of a fish, whose head is a problem, the fins are variants for its causes. To design easily the Fishbone diagram, you can use a special ConceptDraw DIAGRAM vector graphic and diagramming software which contains the powerful tools for Fishbone diagram problem solving offered by Fishbone Diagrams solution for the Management area of ConceptDraw Solution Park.Fishbone Diagram Problem Solving *
Picture: Fishbone Diagram Problem Solving
Related Solution:
Any business process consists from a number of tasks carrying out the certain business goal. It is useful to diagram business processes to ensure that they are as foolproof, logical and sequential as possible. This business process diagram describes a typical booking process flow by the example of a cab booking process. It can be used as a roadmap for any booking system implementation. Diagramming a business process allows you to look at the entire project and take into account all types of possible scenarios. Business process diagram helps you investigate and clarify the process thoroughly so that you can find out how it can be improved. Business process diagram supports team communications by ensuring that each process element is clear and everyone in the team is on the same page. Sometimes your company brings you less profit than you expect it to be, and it’s difficult to reveal the causes. Maybe it’s time to learn new technologies, because business diagram are easily developed by means of special software, so you won’t make any extra effort. In return, you will increase your productivity and get more done in a less time.Business Diagram Software *
Picture: Business Diagram Software
Related Solutions:
Designing landscapes nowadays doesn’t require any special skills. Therefore, it’s not rocket science how to use landscape design software and create detailed plans and projects. Special Landscape & Garden Solution from the Building Plans area of ConceptDraw Solution Park provides vivid ready-to-use vector objects of trees, bushes, fences, furniture etc.How To use Landscape Design Software
Picture: How To use Landscape Design Software
Related Solution:
ConceptDraw DIAGRAM system design software is a product of CS Odessa that was developed especially for making it much simpler to create all the needed diagrams, charts, flowcharts, schemes and other drawings when there is such a need in it. Having the Specification and Description Language (SDL) solution installed from the ConceptDraw STORE application may be another bonus to any ConceptDraw DIAGRAM diagramming and drawing software’s user as it offers both stencil libraries with the design elements and the pre-made examples of the diagrams, such as the SDL ones.System Design *
Picture: System Design
Related Solution:
When describing any computer network, we imagine a set of devices and nodes, arranged in some way. Talking about network structures, we should distinguish physical and logical network topologies, as physical topology is about devices location and logical topology illustrates data flow. In the same time, they do not have to match, and some devices, such as repeaters, may have a physical star layout, but a bus logical topology. There are two main types of computer network topologies: Physical topology that show the physical organization of a network - equipment and types of connections. Star network topology involves a set of devices that is connected to a single hub (router). Ring network topology means that, devices connected according this topology have two connections, connecting with nearby devices to make a loop. Bus network topology is the topology presented at the current diagram. It is similar to a ring topology. The difference is that data moves up and down a linear connection, copying itself where network equipment works as bus-stations along the way. This network topology can be used for small network, or when adding an extra device into a network.Network Topologies
Picture: Network Topologies
Related Solution:
ConceptDraw
DIAGRAM 18