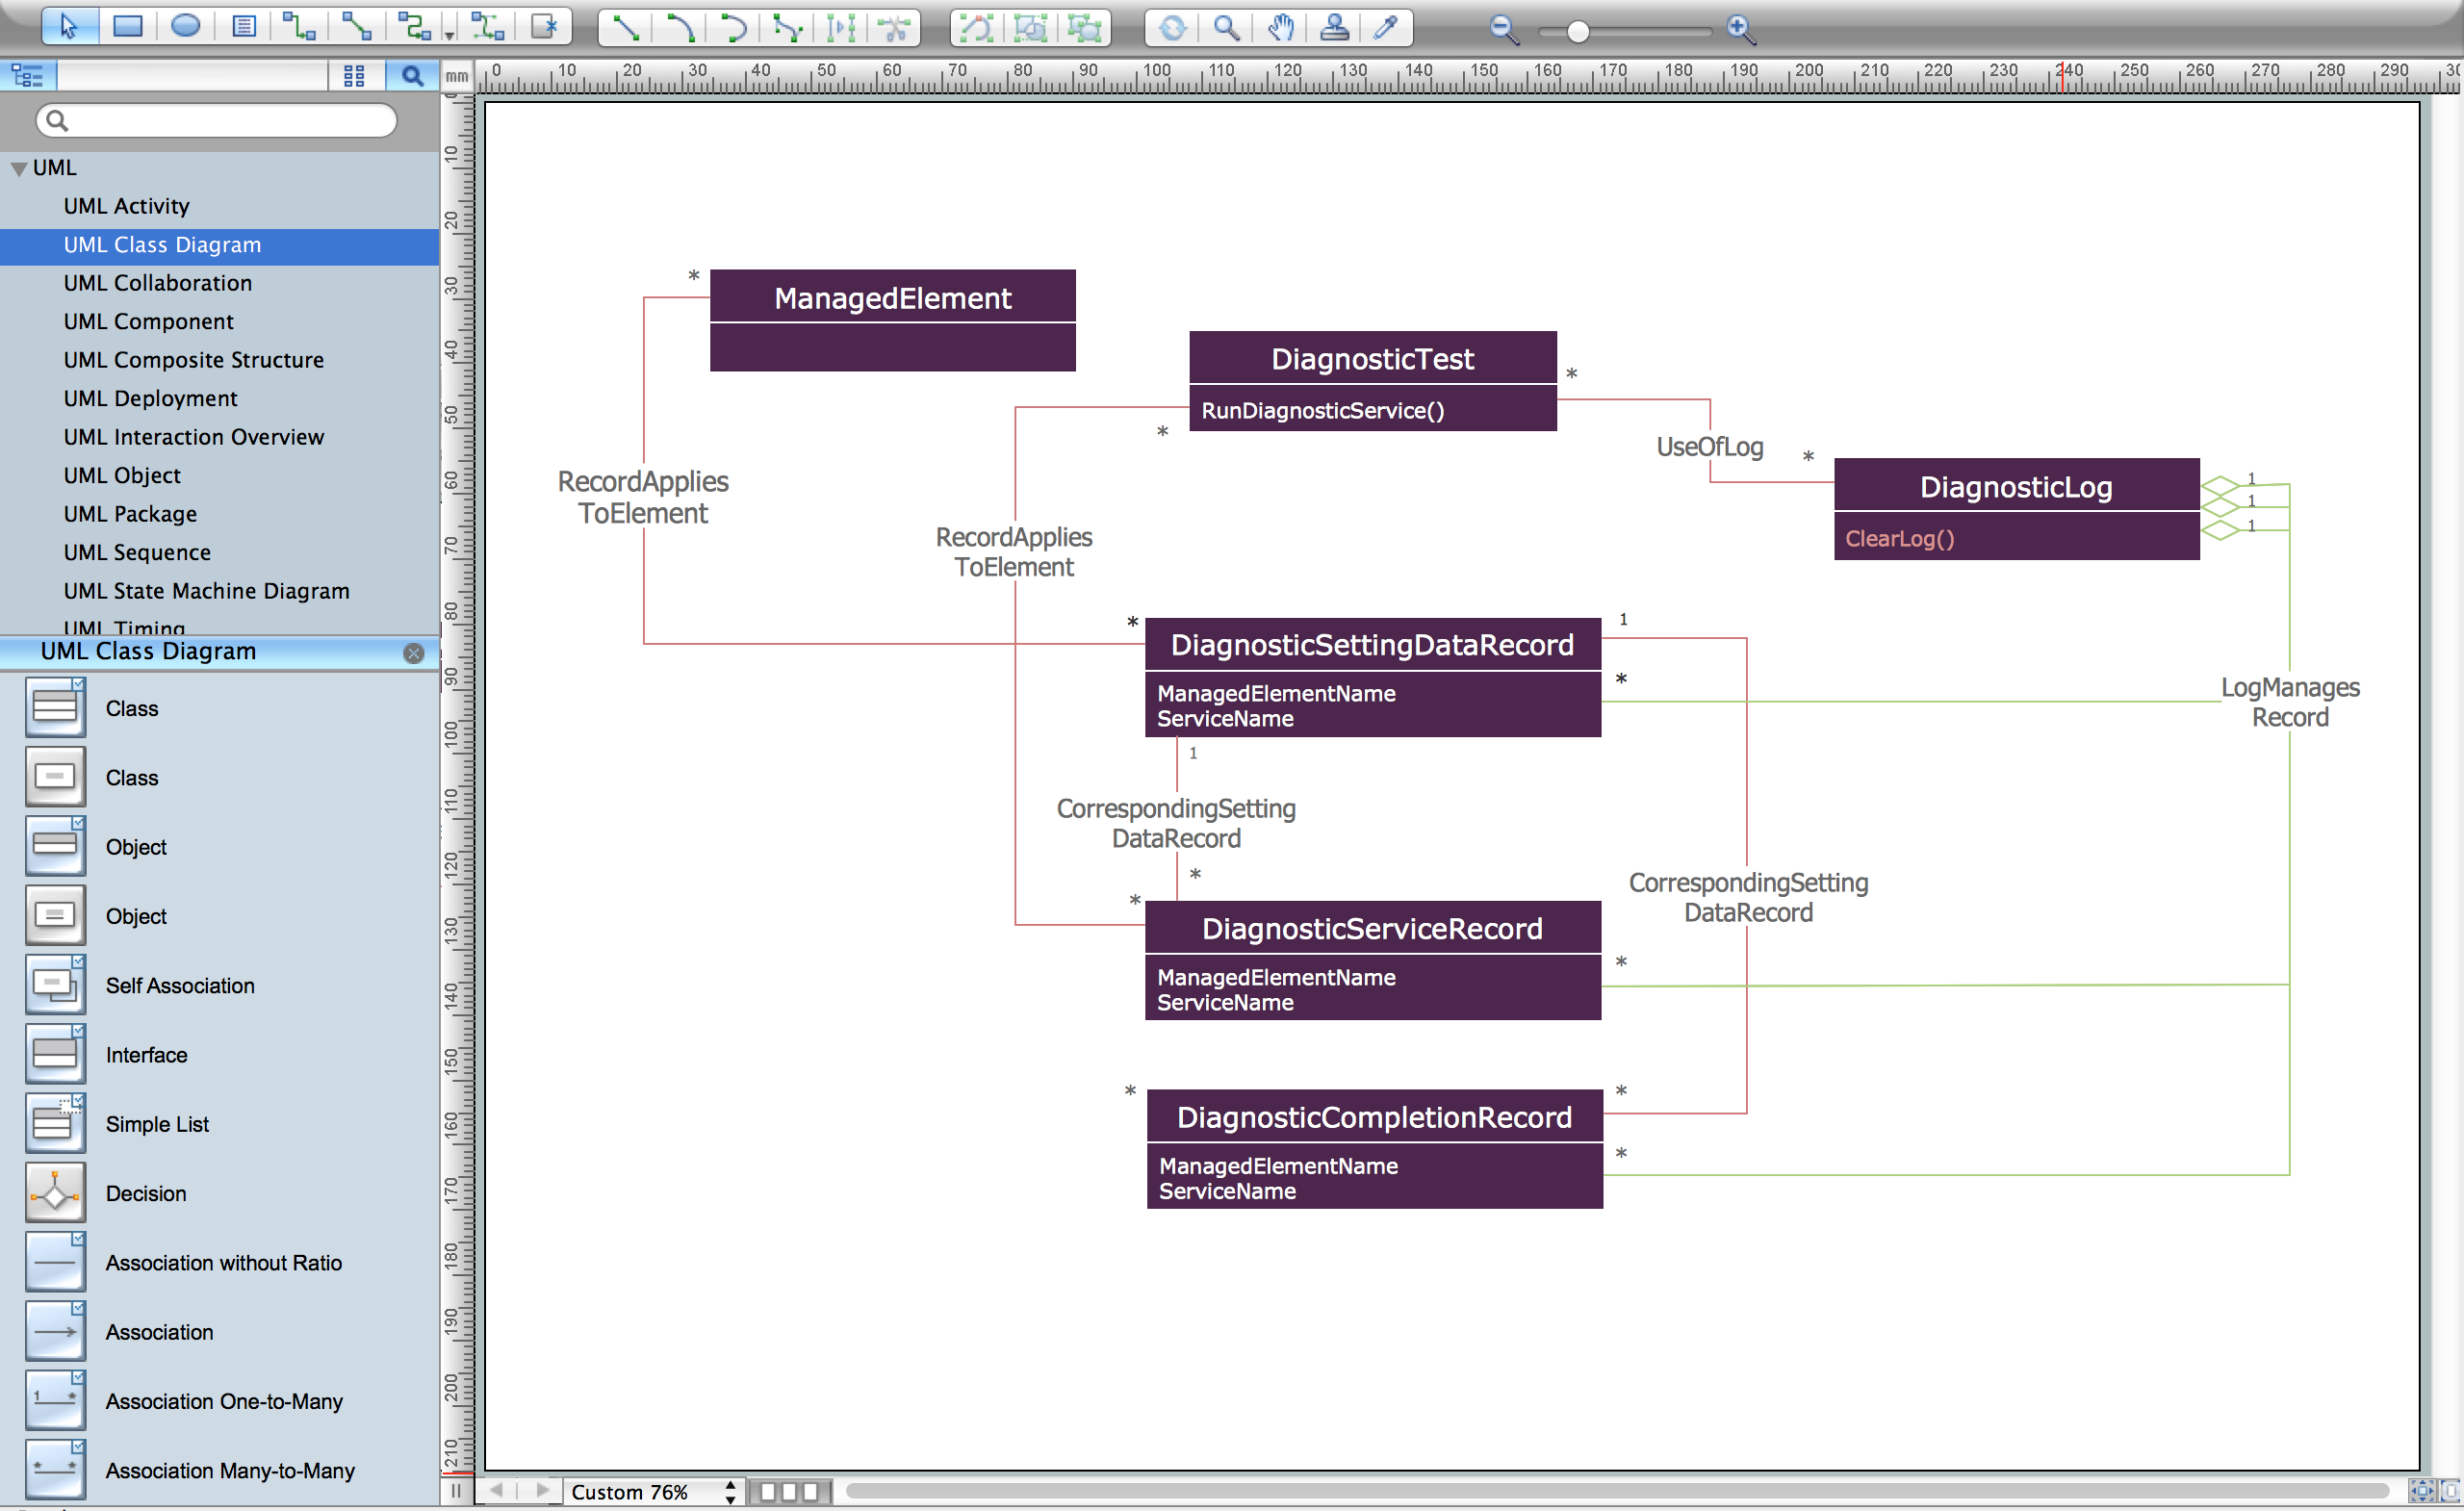
Pic 1. UML Class Diagram Software
On the UML Class Diagram, Classes are represented as boxes that consist of name, attributes of the class, operations or methods, and responsibilities.

Pic 2. UML Class Diagram Components
ConceptDraw DIAGRAM allows you to set the following visibility markers that assign where and how will be available the class components: of a class member: Public (+), Private (-), Protected (#), Derived (/), Static (_), Package (~). The visibility marker must be placed before the name of class member.

Pic 3. UML Class Diagram Components
ConceptDraw DIAGRAM allows you to depict the associations (static relationships) between objects and classes on the Class Diagrams. The association that connects two classes is represented as:
- Aggregation (“has a”) association – as line with empty diamond.
- Composition (“owns a”) association – as line with filled diamond.
- Generalization or Inheritance (“is a”) association – as line with empty triangle.
- Realization association – as unbroken line with empty triangle.
- Dependency association - as unbroken line with an open arrowhead.
- Synchronous message association – as line with filled triangle.
The components with Private visibility (-) are not visible from outside. The Protected visibility (#) allows the components be accessible in any child class. The components with Public visibility (+) are visible for all other classes. The Derived (/) class inherits the properties of the base class. The Static (_) visibility is used at the encapsulation. The Package (~) visibility shows that the components are accessible to any class of this package.

Pic 4. UML Class Diagram Associations
ConceptDraw DIAGRAM allows to indicate the multiplicity of associations, i.e. the quantity of instances of one class that are linked to one instance of the other class. There are four notations:
- 0..1 – no or one instance;
- 1 – one instance;
- 0..* – zero or more instances;
- 1..* – one or more instances.

Pic 5. UML Class Diagram Multiplicity Associations

Pic 6. UML Class Diagram Constructor.
This example represents the aggregation associations and uses the multiplicity of associations.
The Rapid UML Solution of ConceptDraw DIAGRAM also provides templates and samples that help you to create the UML Class Diagram in one moment.

Pic 7. Rapid UML Solution in ConceptDraw STORE
The document of ConceptDraw DIAGRAM with UML Class Diagram is a vector graphic document and can be reviewed, modified or convert to a variety of formats: image, HTML, PDF file, MS PowerPoint Presentation, Adobe Flash or MS Visio.
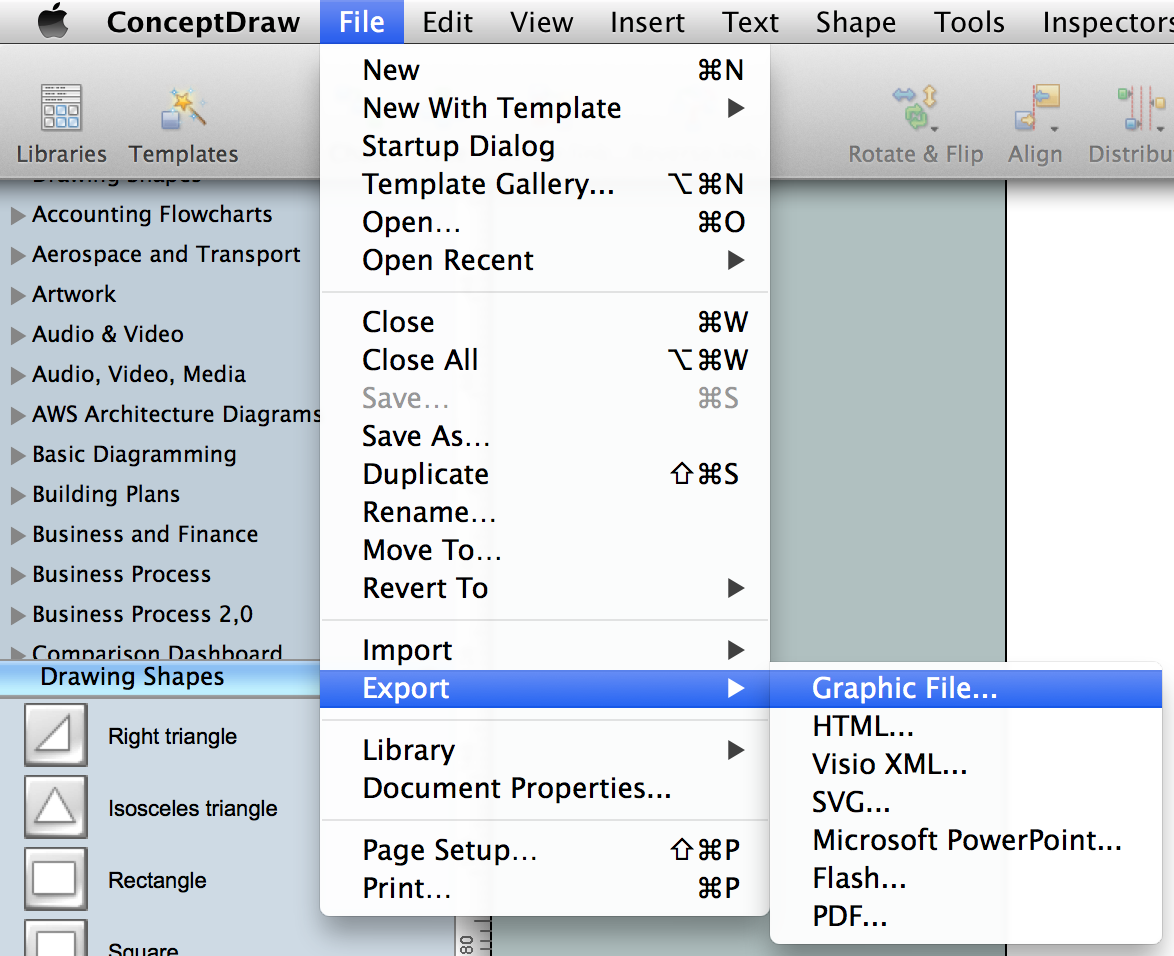
Pic 8. Export options from ConceptDraw DIAGRAM
ConceptDraw DIAGRAM extended with the Rapid UML Solution is perfect for drawing professional UML Class Diagrams.
TEN RELATED HOW TO's:
UML Component for Bank - This sample was created in ConceptDraw DIAGRAM diagramming and vector drawing software using the UML Component Diagram library of the Rapid UML Solution from the Software Development area of ConceptDraw Solution Park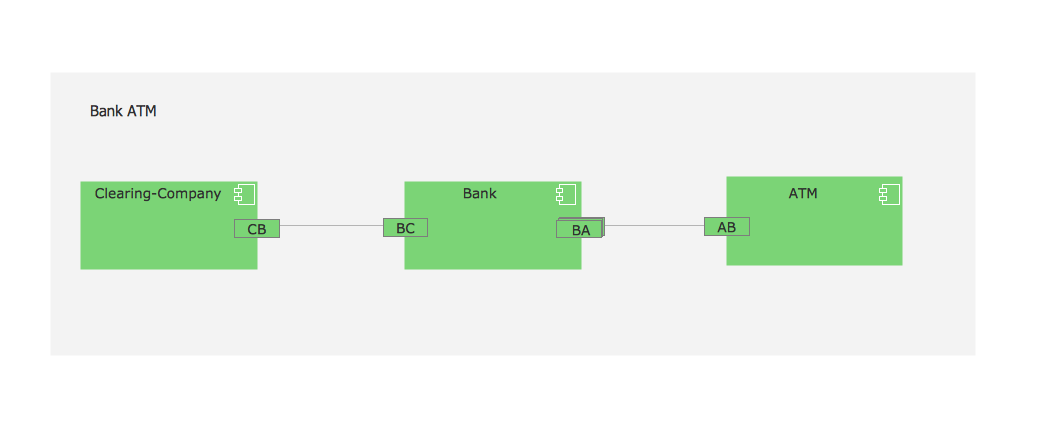
Picture: UML Component for Bank
Related Solution:
Website wireframes are convenient and widely used by developers, visual designers, business analysts, and many other people related with projection, development and promotion websites. Usually website wireframes look lacking of brilliance, but they effectively reflect website functionality, content and visually represent its skeletal framework.
ConceptDraw DIAGRAM software offers a unique Website Wireframe solution from the Software Development area with all needed tools for fast and easy drawing professional looking website wireframe with attractive interface design.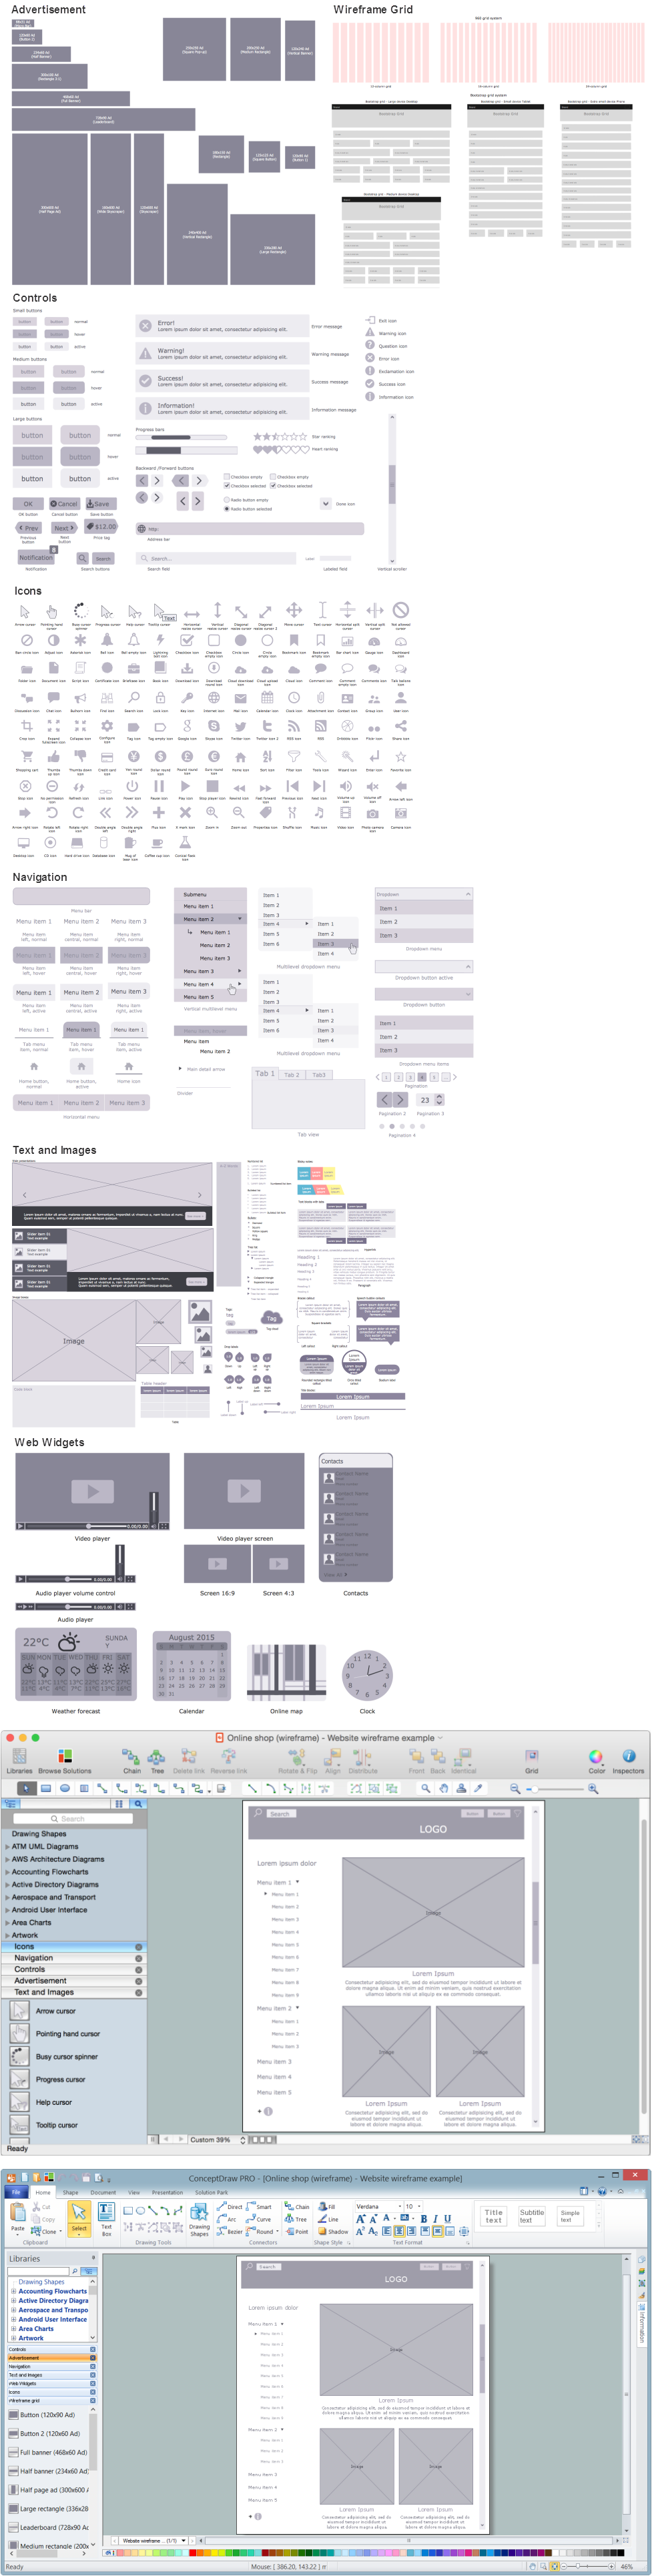
Picture: Interface Design
Related Solution:
Jackson System Development (JSD) is a linear method of system development created by Michael A. Jackson and John Cameron in the 1980s. It comprises the whole software life cycle directly or providing a framework for more specialized techniques.
When implementing the Jackson System Development method and designing JSD diagrams, you can succesfully use the powerful and helpful tools of ConceptDraw DIAGRAM software extended with Entity-Relationship Diagram (ERD) solution from the Software Development area of ConceptDraw Solution Park.
Picture: JSD - Jackson system development
Related Solution:
Unified Modeling Language (UML) is a graphical modeling language for describing, visualizing, projecting and documenting of object oriented systems. UML digram is used for modeling of organizations and their business processes, for development the big projects, the complex software applications. Comprehensive UML diagram allows to create the set of interrelated documents that gives the complete visual representation of the modeling system.
Picture: UML Sample Project
Related Solution:
What is a computer network? This is a set of devices and systems that are connected to each other (logically or physically) and communicate with each other. This could include servers, computers, phones, routers, and so on. The size of this network can reach the size of the Internet, and can consist of only two devices connected by a cable.
This sample shows the connection scheme of the home WLAN equipment to the Internet.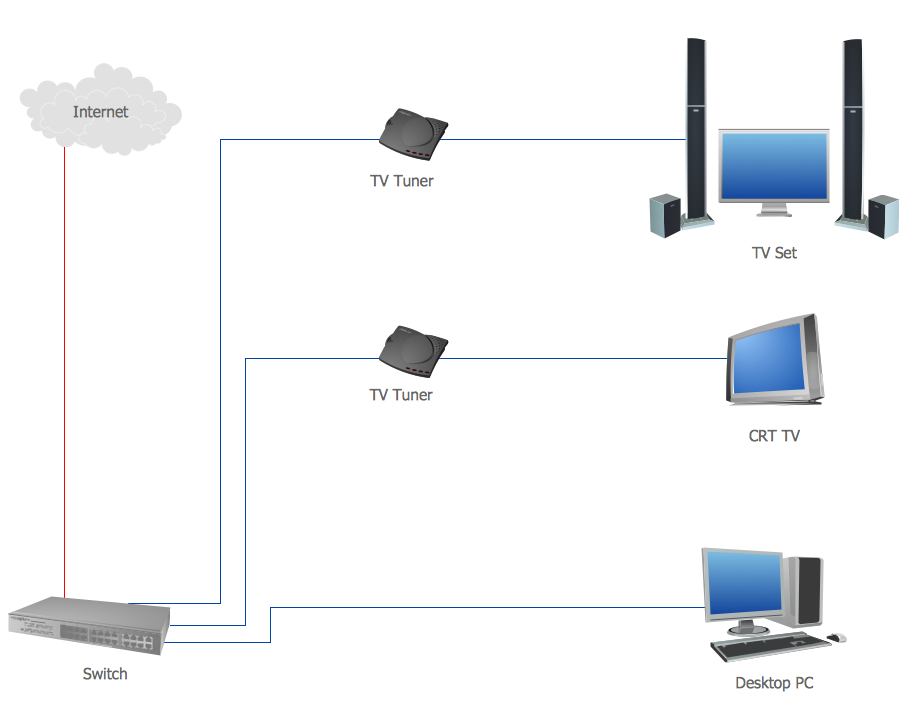
Picture: Diagram of a Basic Computer Network. Computer Network Diagram Example
Related Solution:
It is easy to recreate any informational system structure using diagrams. There are three main components of any ER diagram: entity, attribute and relationship. Basing on these three components, one can define other, less used elements, such as weak entity or relationship, derived attribute, recursive relationship etc.
This is the set of graphic elements of ERD Chen's notation. This ERD notation is used to represent an entity–relationship models. It involves the set of geometric forms: rectangles - depicting entities, ovals - representing attributes and diamonds depicting relationships assigned for first-class objects, that can have relationships and attributes of their own. Connections are displayed with arrowed lines. It is known that the Chen's ERD notation is used to show a detailed view of entities and relationships. ConceptDraw Entity-Relationship Diagram solution from the Software Development section of Solution Park provides the ability to create ERD of database structure for software development purposes using the Chen’s notation elements.
Picture: Components of ER Diagram
Related Solution:
The vector stencils library UML Use Case contains specific symbols of the UML notation such as actors, actions, associations and relationships for the ConceptDraw DIAGRAM diagramming and vector drawing software.
Picture: Jacobson Use Cases Diagram
Related Solution:
This sample shows the concept of working of the transport company and is used by transport companies, carriers at the transportation of various goods.
Picture: UML Class Diagram Example for GoodsTransportation System
Related Solution:
UML Timing Diagram as special form of a sequence diagram is used to explore the behaviours of objects throughout a given period of time.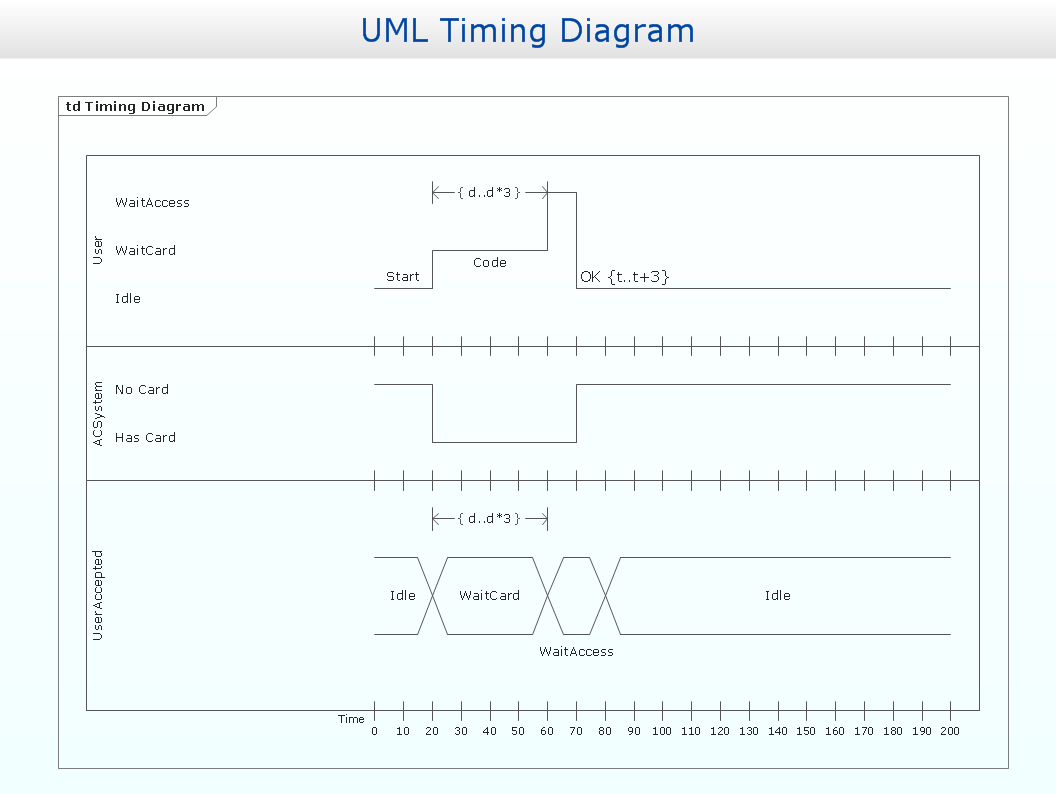
Picture: Timing diagram
Related Solution:
Desbloquee el lenguaje de los diagramas de flujo con nuestra guía de símbolos de diagramas de flujo. 🔸 Todo lo que necesita saber sobre los conceptos básicos del diagrama de flujo, desde ✔️ puntos de decisión hasta ✔️ pasos del proceso, explore el significado detrás de cada símbolo y domine el arte de crear representaciones visuales claras y efectivas de sus procesos.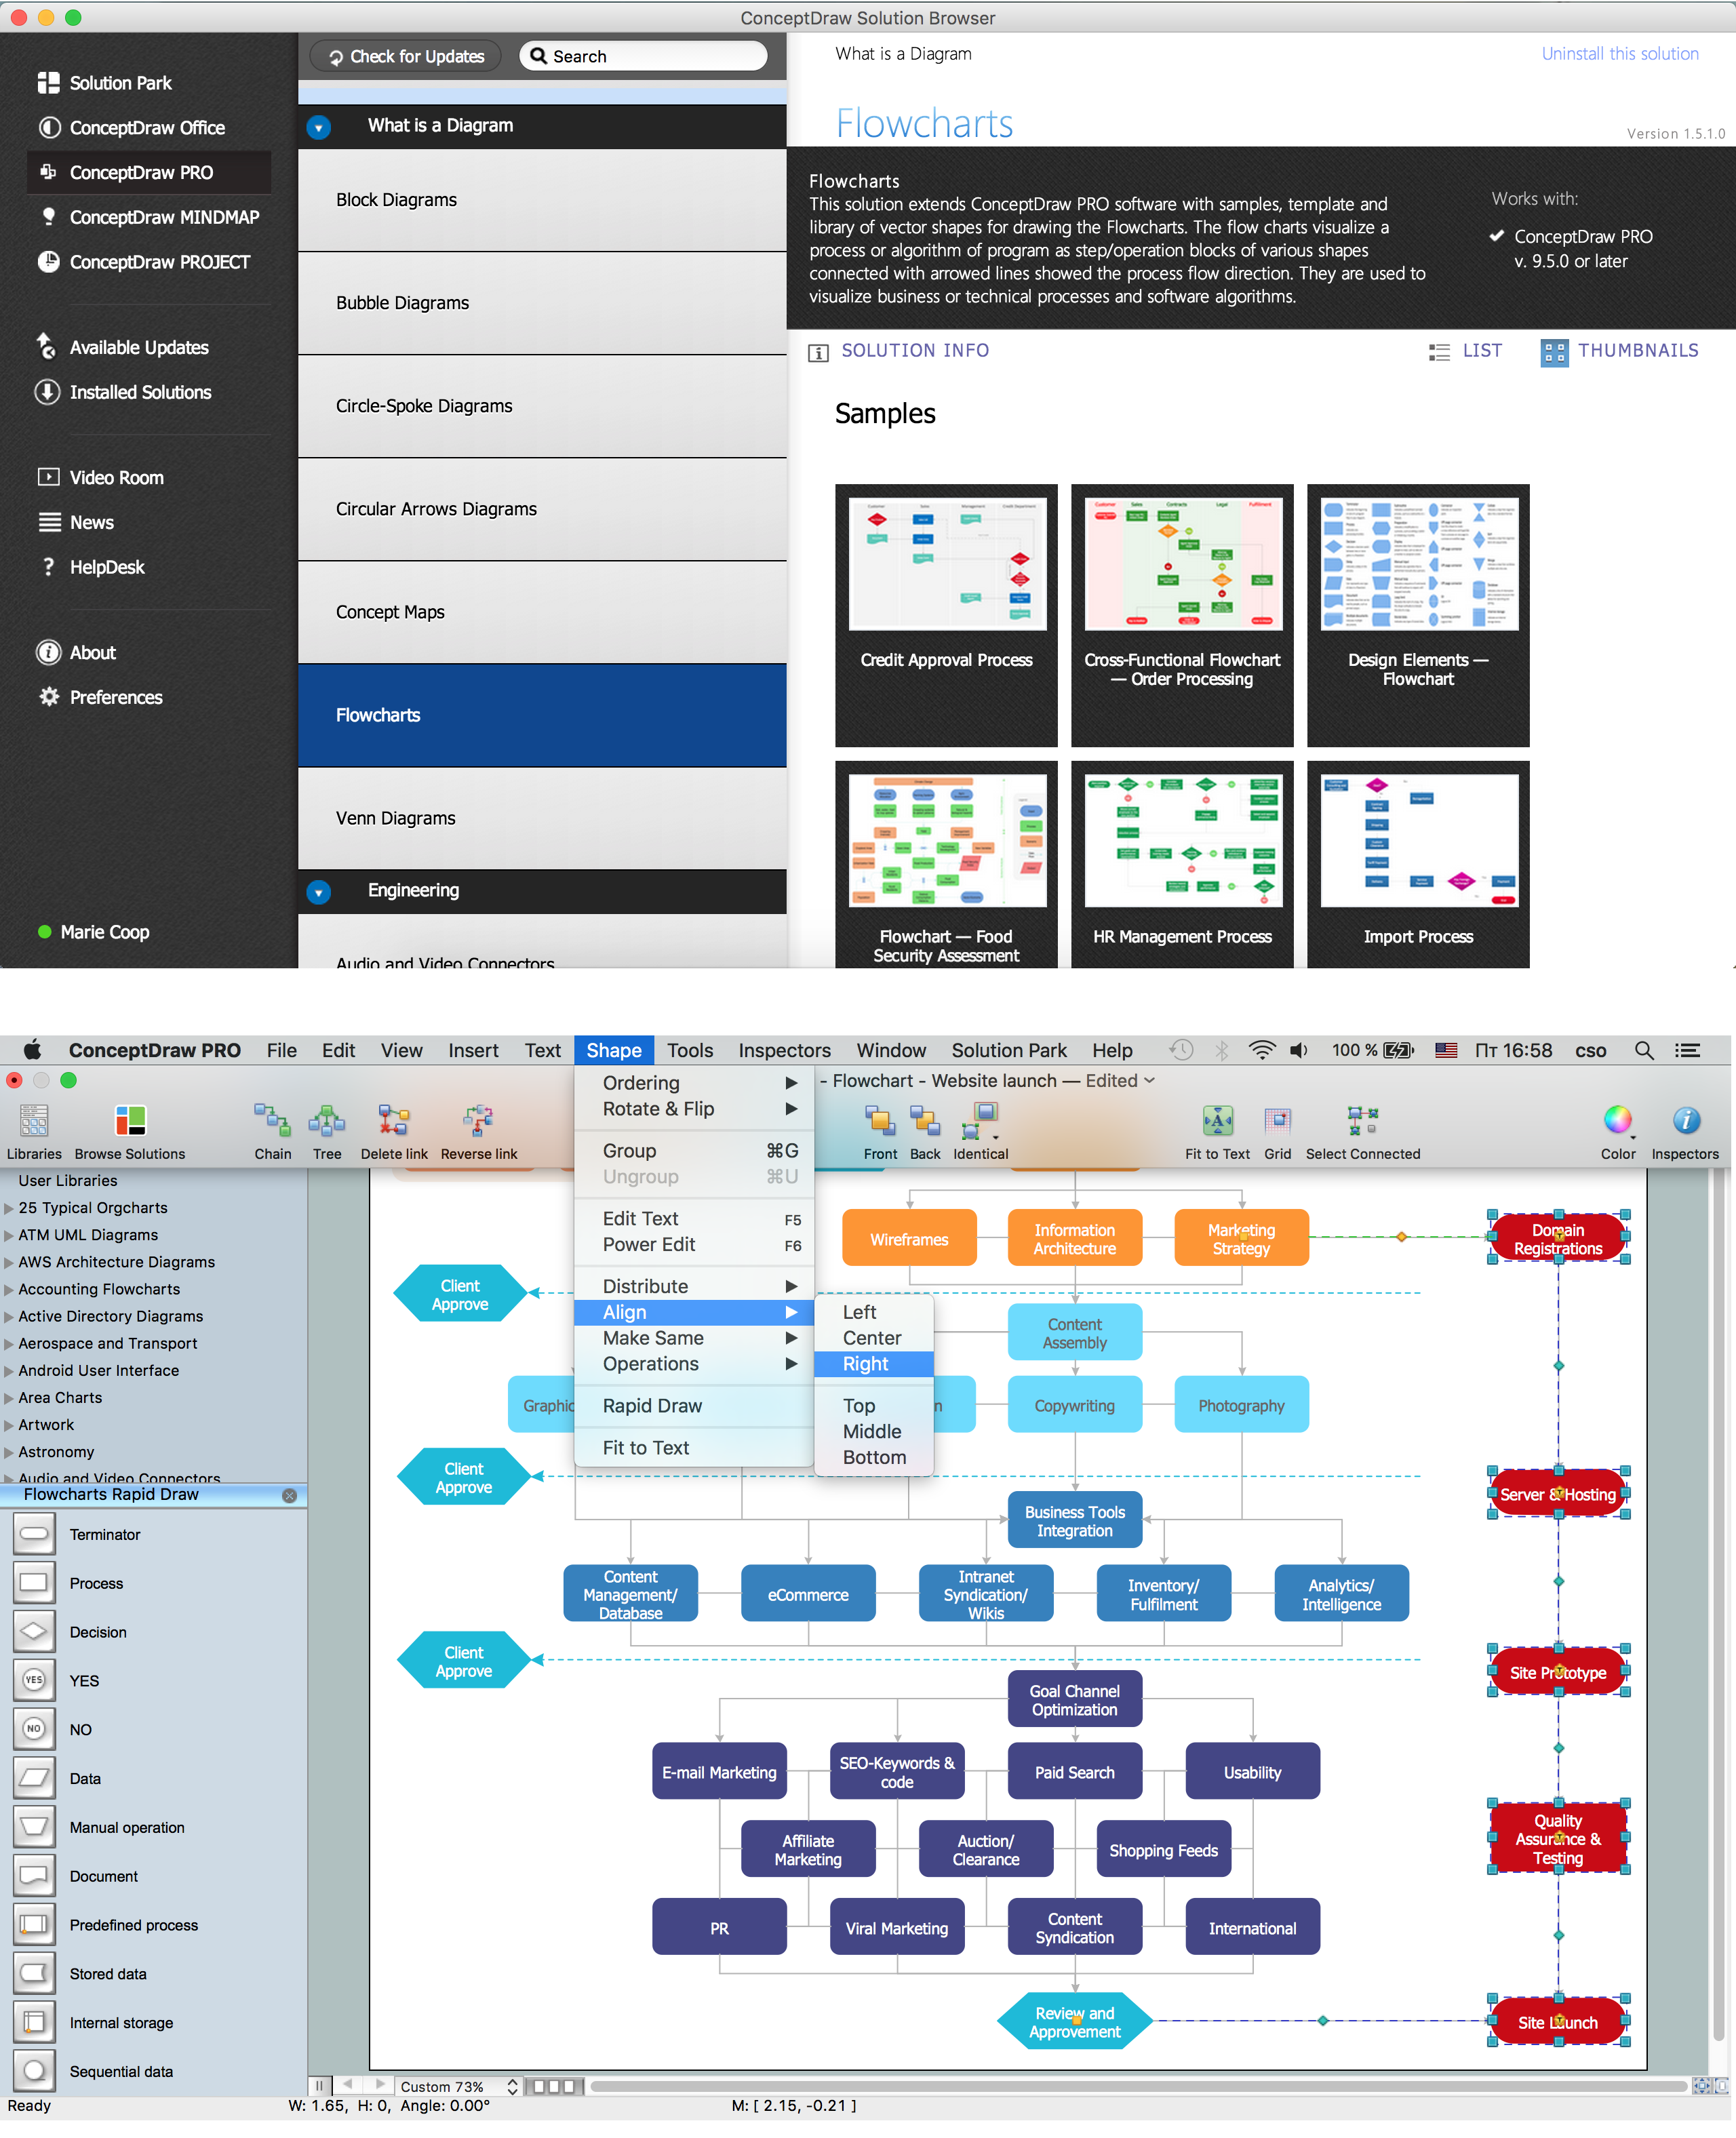
Picture: Symboles Organigramme
Related Solution:

