ConceptDraw DIAGRAM UML Diagrams with ConceptDraw DIAGRAM
|
Unified Modeling Language (UML) is a standardized general-purpose modeling language in the field of software engineering. When creating UML diagrams it is highly recommended that a special UML modeling or design tool be used. ConceptDraw DIAGRAM is a great UML modeling and design tool that enables you to quickly and easily generate all types of UML diagrams. ConceptDraw DIAGRAM includes a large set of templates for UML design, UML diagram samples, and a UML modeling reference guide. ConceptDraw DIAGRAM offers a large collection of industry-standard UML object libraries for all types of UML diagrams:
UML Modeling Tool Samples:
|
TEN RELATED HOW TO's:
ConceptDraw DIAGRAM is a powerful tool for drawing business communication ideas and concepts, simple visual presentation of numerical data in the Mac environment.
Picture: Best Multi-Platform Diagram Software
Related Solution:
Create bar charts for visualizing problem solving in manufacturing and economics using the ConceptDraw DIAGRAM diagramming and vector drawing software extended with the Bar Graphs Solution from the Graphs and Charts area of ConceptDraw Solition Park.
Picture: Bar Diagrams for Problem Solving. Create manufacturing and economics bar charts with Bar Graphs Solution
Related Solution:
To draw a good diagram of a business workflow you should have a ready-to-use set of pre-designed objects you may drag-and-drop to your document focusing on the workflow structure and meaning, not drawing tools. ConceptDraw DIAGRAM with Workflow Diagrams solution provides complete set of design element you may use to draw a good diagram of a business workflow.
Picture: How to Draw a Good Diagram of a Business Workflow?
Related Solution:
UML Timing Diagram as special form of a sequence diagram are used to explore the behaviors of objects throughout a given period of time.
Picture: Diagramming Software for Design UML Timing Diagrams
The Rapid UML Solution from the Software Development area of ConceptDraw Solution Park helps you to create the UML Class Diagrams quick and easy using ConceptDraw DIAGRAM diagramming and vector drawing software.
Picture: UML Class Diagram Tutorial
Related Solution:
Easy charting software comes with beautiful chart templates and examples. This makes it easy to create professional charts without prior experience.
Picture: Chart Examples
Related Solutions:
The EPC diagram shows various business processes in terms of work flows.
Event-Driven Process chain Diagrams for improvement throughout an organisation.
ConceptDraw DIAGRAM - software that reduces the time needed to create a business process model and is great business process improvement tools.
Picture: The Best Tool for Business Process Modeling
Related Solution:
Deployment diagram describes the hardware used in system implementations and the execution environments and artifacts deployed on the hardware.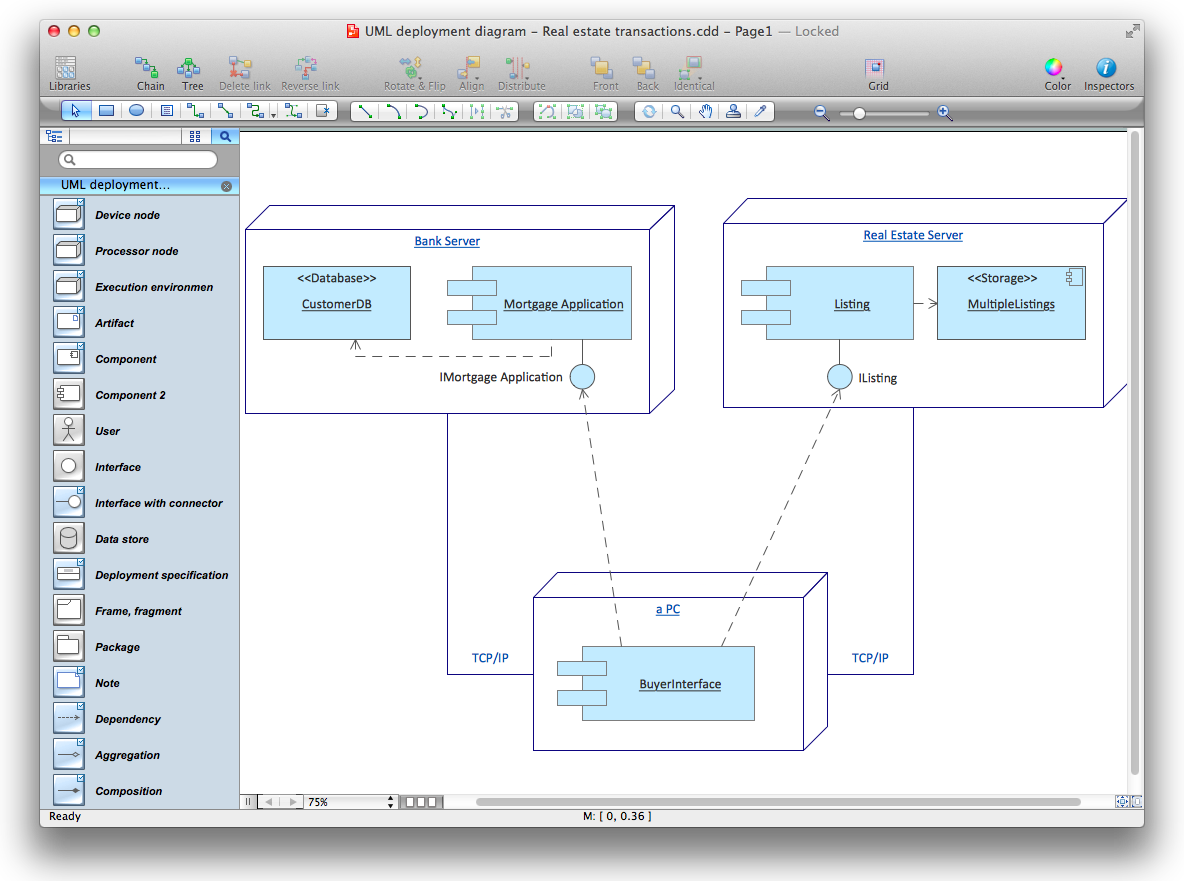
Picture: UML Deployment Diagram. Diagramming Software for Design UML Diagrams
Structure of a software product might get very complex and complicated, if software engineers did not pay much attention to the architecture of the product. It will take a few minutes to create UML diagrams with ConceptDraw DIAGRAM , because this software is just perfect for diagramming. You can alter ready-to-use templates, or make your own, whatever you need.
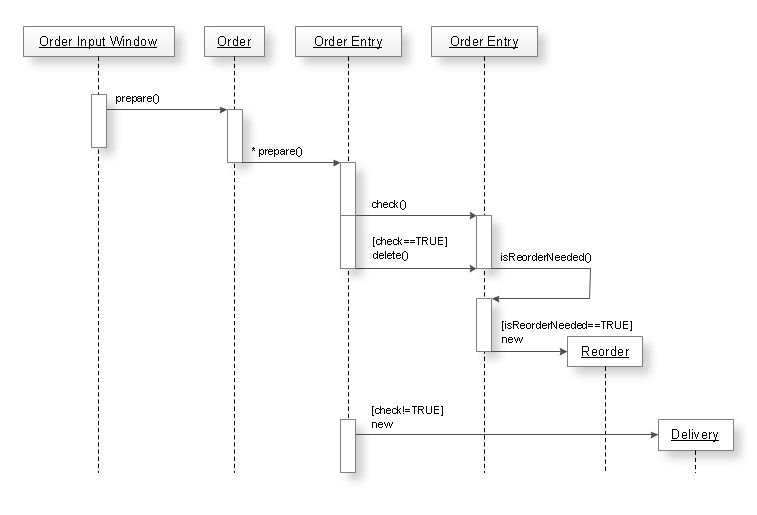
This illustration represent the example of UML diagram made by using ConceptDraw Rapid UML solution. This activity diagram displays the stages of the software development process similar to a flow chart. This diagram depicts the states of elements in the software system. It can be applied to represent software and coding logic. This UML diagram was drawn with the help of the ConceptDraw Rapid UML solution which supplies the kit of vector libraries, containing the symbols of the Unified Modeling Language notations.
Picture: UML Diagrams with ConceptDraw DIAGRAM
Related Solution:
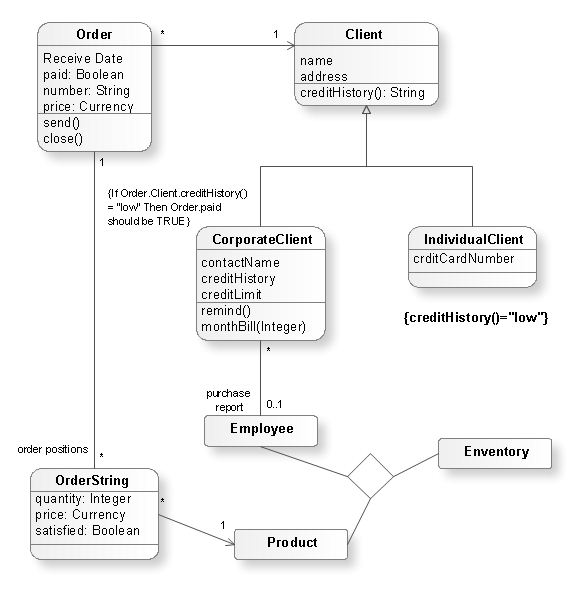
This sample shows the UML Class Diagram of Learning Object Metadata (LOM) base schema. The classes represented as boxes with attributes and are connected with associations. You can see the composition associations on this diagram. The associations are indicated with the multiplicities 0..1, 0..*. This sample can be used in electrical and electronics engineering.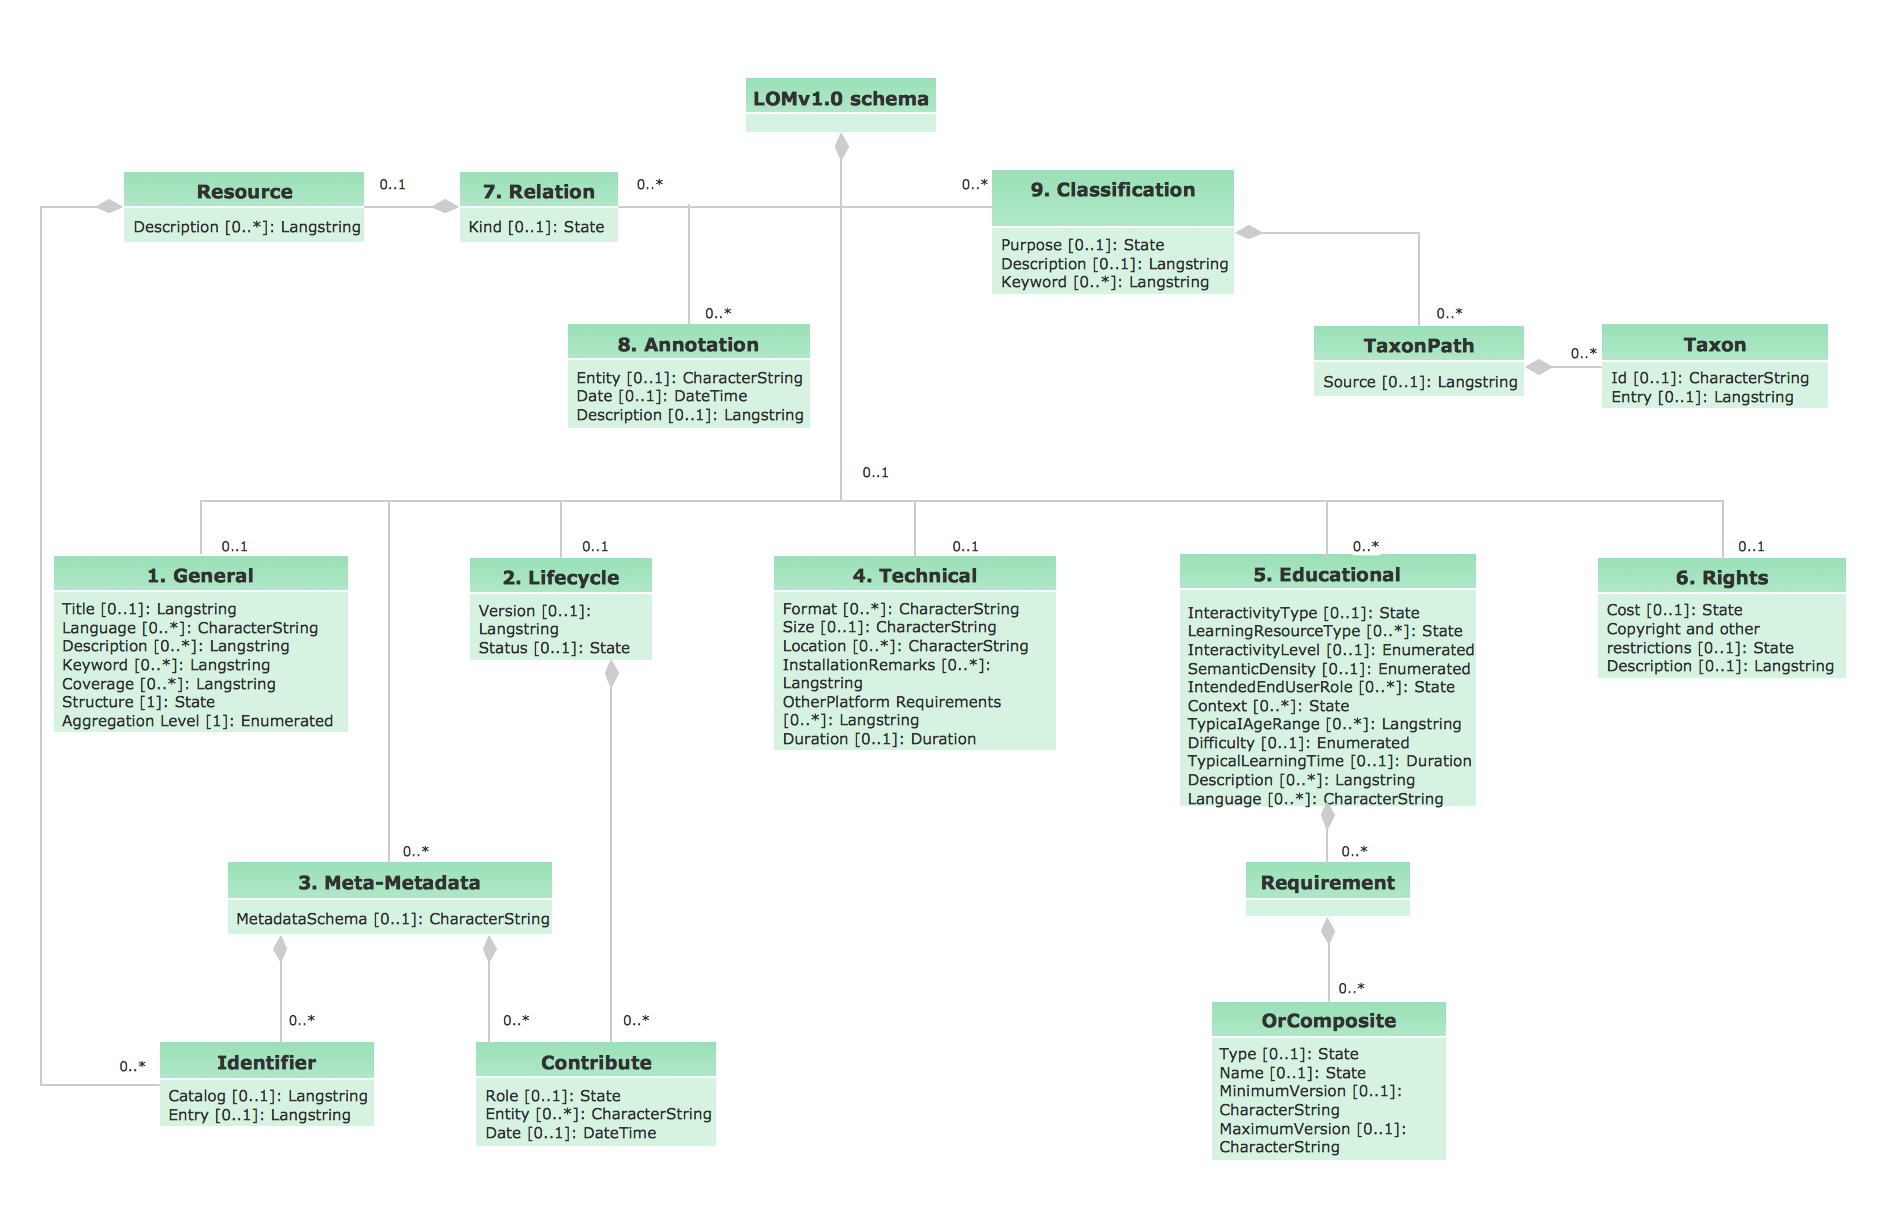
Picture: UML Diagram Editor
Related Solution:
ConceptDraw
DIAGRAM 18