UML Block Diagram
UML Building Blocks
The UML building blocks determine as things, relationships and diagrams.
There are four types of things in UML: Structural, Behavioral, Grouping and Annotational.
Sructural things (the static part of the model):
Class:
Class represents a set of objects that have the same structure, behavior, and relationships with objects of other classes. Classes are represented as boxes that consist of name, attributes, operations, and responsibilities.

Interface:
Interface is an abstract class that defines a set of operations that the object of the class associated with this interface provides to other objects.

Collaboration:
Collaboration determines interactions between the elements.

Use case:
Use case is a description of the system behavior on the request from the outside of this system.

Component:
Component describes the physical part of the system.

Node:
Node is a resource available during the run time.

Behavioral things (dynamic part of the model):
Interaction:
Interaction is a set of messages that the elements exchange for execution the tasks.

State machine:
State machine defines the states of the object that go in response to the events.

Grouping things (the mechanism for grouping the UML model elements):
Package:
Package groups the classes and other packages.

Annotational things (the mechanism for capturing the remarks, descriptions, and comments of the UML model elements):
Note:
Note is a textual explication.

Relationship :
Association:
Association is a relationship that connect two classes.

Dependency:
Dependency is a relationship when some changes of one element of the model can need the change of another dependent element.

Generalization:
Generalization is an association between the more general classifier and the more special classifier.

Realization:
Realization is a relationship between interfaces and classes or components that realize them.

Diagrams:
There are the following types of UML Diagrams: Class, Component, Composite Structure, Deployment, Object, Package, Activity, State Machine, Use Case, Communication (Collaboration), Interaction Overview, Sequence, and Timing.

Using the libraries of the Rapid UML Solution for ConceptDraw DIAGRAM you can create your own visual vector UML diagrams quick and easy.
All libraries for creating UML diagrams are available inside the ConceptDraw DIAGRAM Templates and samples are located in the Rapid UML section of ConceptDraw STORE.

TEN RELATED HOW TO's:
Create bar charts for visualizing problem solving in manufacturing and economics using the ConceptDraw DIAGRAM diagramming and vector drawing software extended with the Bar Graphs Solution from the Graphs and Charts area of ConceptDraw Solition Park.
Picture: Bar Diagrams for Problem Solving. Create manufacturing and economics bar charts with Bar Graphs Solution
Related Solution:
Use Case Diagram Taxi Service UML. This sample was created in ConceptDraw DIAGRAM diagramming and vector drawing software using the UML Use Case Diagram library of the Rapid UML Solution from the Software Development area of ConceptDraw Solution Park.
This sample shows the work of the taxi service and is used by taxi stations, by airports, in the tourism field and delivery service.Picture: UML Block Diagram
Related Solution:
A process flow diagram (PFD) is a diagram commonly used in chemical and process engineering to indicate the general flow of plant processes and equipment.
ConceptDraw DIAGRAM diagramming and vector drawing software extended with Flowcharts Solution from the Diagrams Area of ConceptDraw Solution Park offers the extensive drawing tools for quick and easy design professional looking Process Flow Diagrams.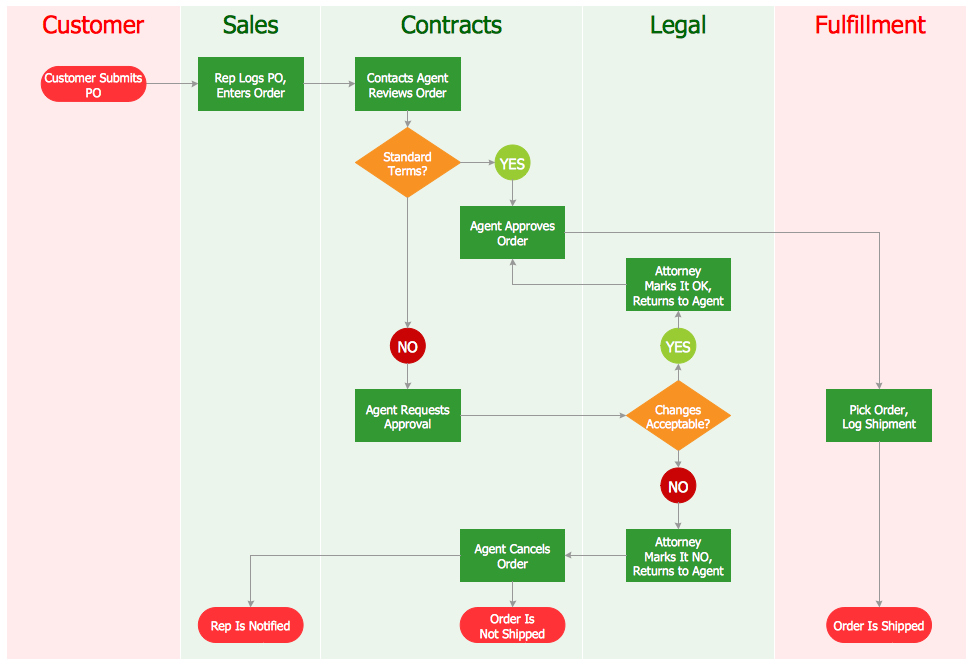
Picture: Process Flow Diagrams
Related Solution:
While developing software, it is very important to have a visual model, because it helps to represent the logic and the architecture of an application. Experienced engineers use UML diagrams to denote relationships between classes and their instances. UML is a general language for a set of diagrams like deployment diagrams, object diagrams or use case diagrams.
This diagram represents UML class diagram used for a software system development using an object-oriented method. Class diagrams are categorized as static structure diagrams that depict the physical structure of a system. Class diagram divides a software system's structure into "classes". Classes are defined by the methods and variables of objects. UML Class diagram is used to depict relationships and source code dependencies between objects.
Picture: UML Diagram
Related Solution:
The following examples cctv network were created in ConceptDraw DIAGRAM diagramming and vector drawing software using the Audio, Video, Media Solution. Using this easily customizable cctv network template you can represent any existing cctv network.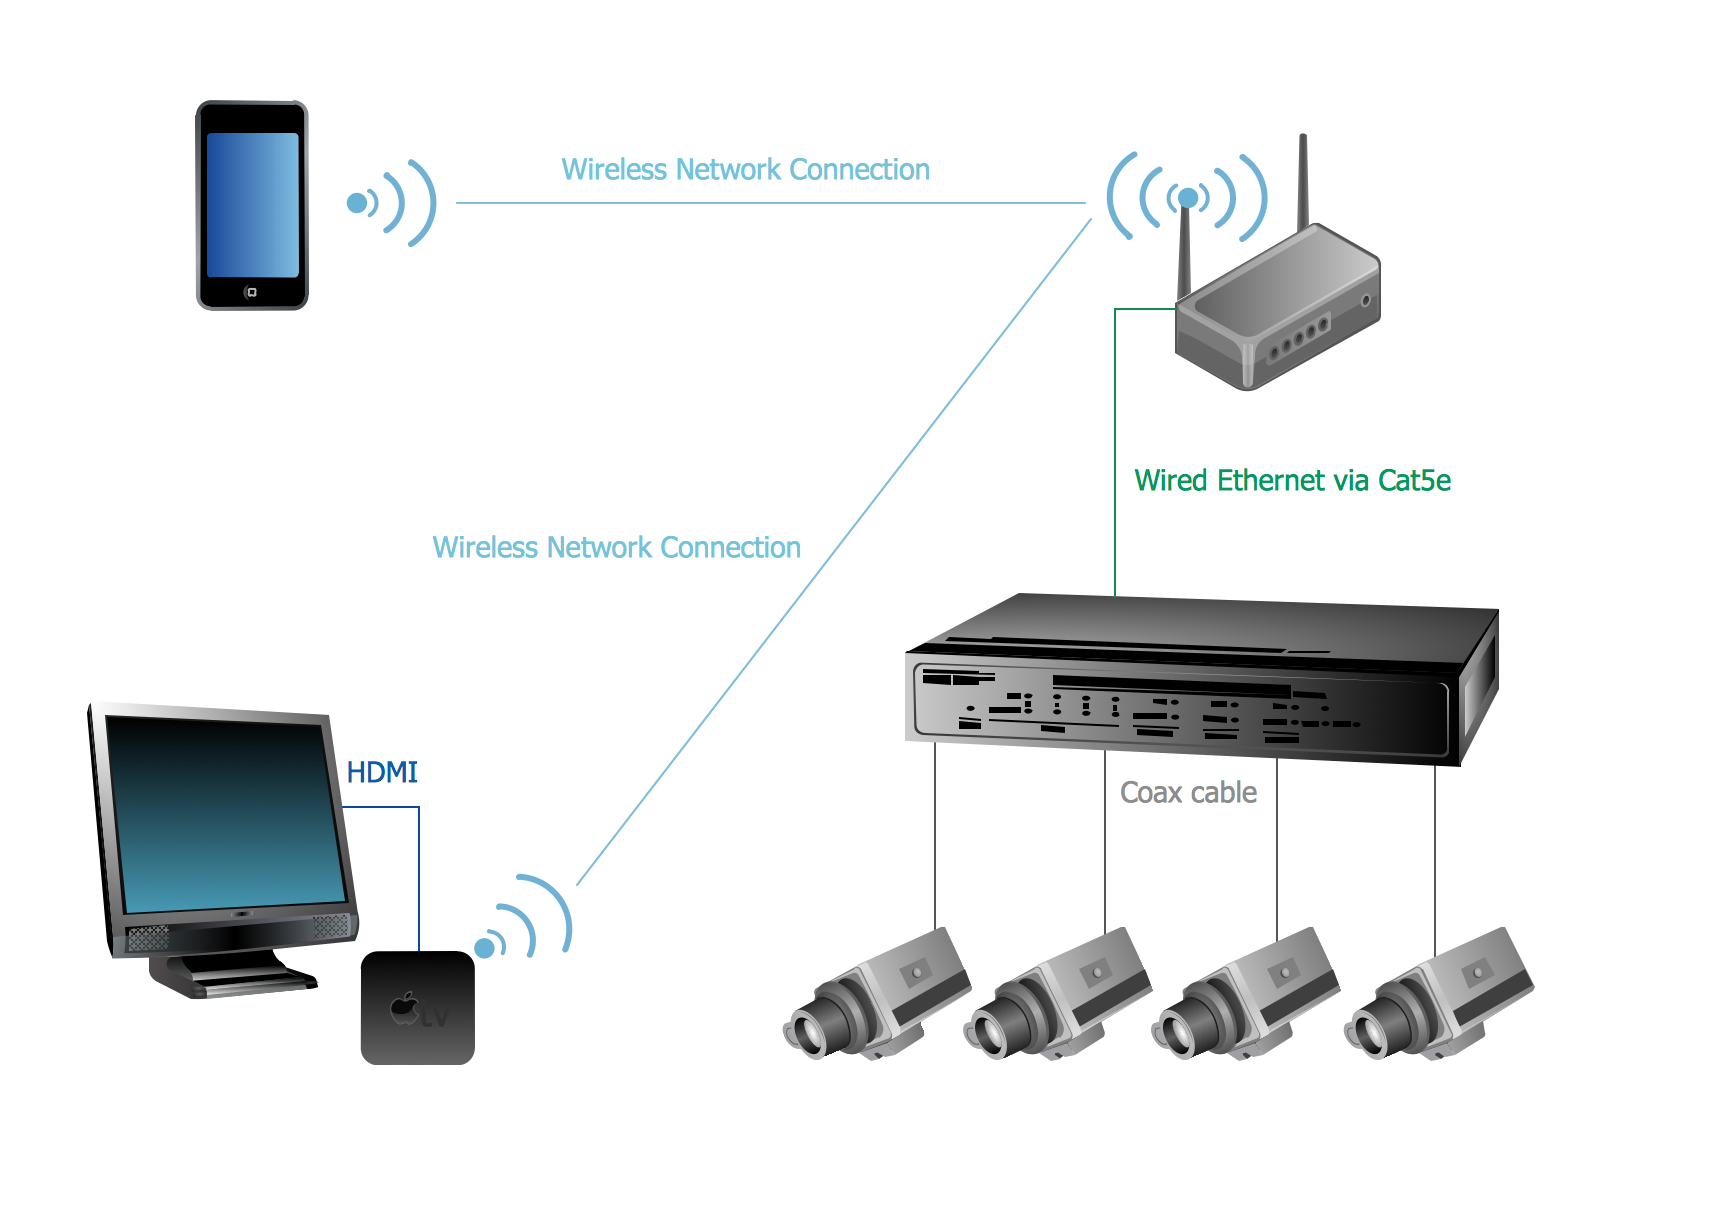
Picture: CCTV Network Example
Related Solutions:
ConceptDraw DIAGRAM enhanced with the Block Diagrams solution is a powerful software to make Block Diagrams of any kind and complexity for the systems of any direction. It supplies its users in drawing Block Diagrams for any purpose, including troubleshooting technical issues, gives the possibility to collaborate with many third-party apps and services, to export your Block Diagrams in different formats, easily share with colleagues, and work in a team.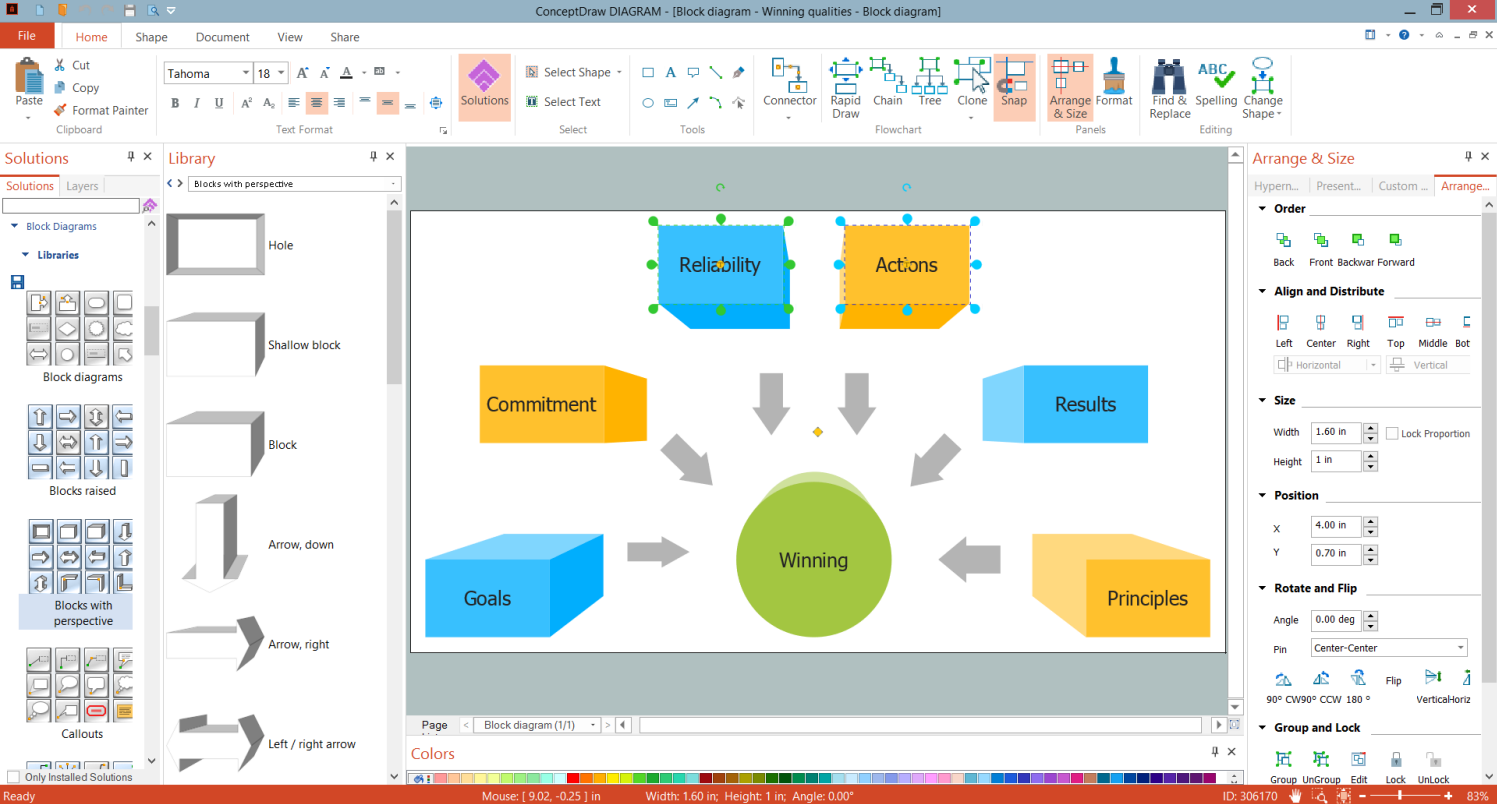
Picture: Software to Make Block Diagrams
Related Solution:
You want design Pictorial Chart or Infographic? And you need powerful infographic software? Then ConceptDraw DIAGRAM diagramming and vector drawing software extended with Pictorial Infographics Solution from the “Infographics” Area is exactly what you need.
Picture: Pictorial Chart
Related Solution:
A Telecommunications network is a network of nodes, links, trunks and telephone switches that are connected, operated by telephone companies and realize telephone, audio, visual and data communications among the users. The telecommunications network can also include Internet, microwave, wireless equipment.
This example was created in ConceptDraw DIAGRAM using the Computer and Networks Area of ConceptDraw Solution Park and shows the Telecommunications network.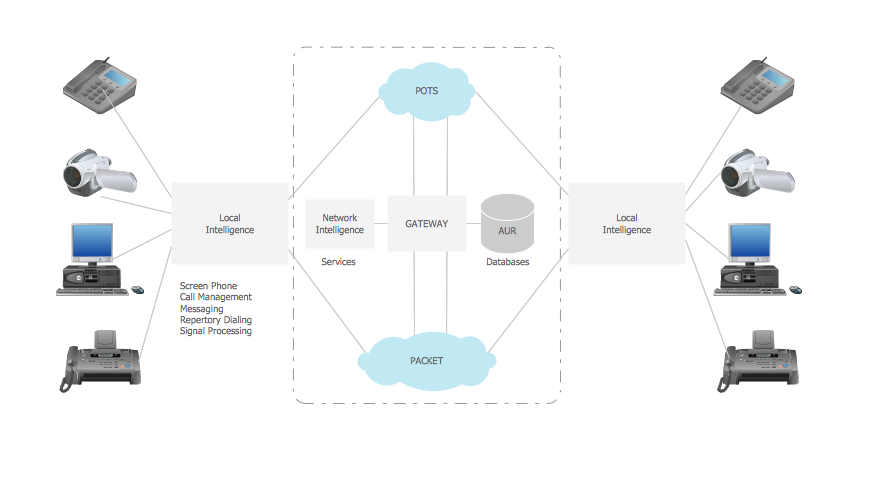
Picture: Telecommunication networks. Computer and Network Examples
Related Solution:
ConceptDraw gives the ability to draw Flowchart documents. Flowcharts solutionis a powerful tool that extends ConceptDraw application for drawing business flowcharts.
ConceptDraw DIAGRAM vector diagramming and business graphics software enhanced with with templates, green and interactive flowchart makers, samples and stencil libraries from ConceptDraw Solution Park which all focused to help with drawing flowcharts, block diagrams, bar charts, histograms, pie charts, divided bar diagrams, line graphs, area charts, scatter plots, circular arrows diagrams, Venn diagrams, bubble diagrams, concept maps, and others.
Picture: The Best Flowchart Software Available
Related Solution:
Connecting objects manually in ConceptDraw DIAGRAM is a snap:
- points;
- Connecting groups of objects;
- Auto-routing;
- Connectors text;
- Snap to Guides ;
- Quick.
Picture: ConceptDraw Arrows10 Technology
