How To Create a Flow Chart in ConceptDraw
Creation Process
ConceptDraw DIAGRAM is a flowchart creating software. This software includes over 20 vector stencils in libraries. These objects allow you to create well-designed flowcharts.

Sample 1. Flow Chart Design Symbols
Put an initial object from library to a page and use RapidDraw technology clicking on direction arrows to add new objects to the flowchart. This way you can make flowchart quickly.

Sample 1. Create a Flow Chart use RapidDraw technology
Each flowchart symbol has its own application, shape, and color.

Sample 2. Flow chart sample: HR management process.
This flow chart example visualizes human resource management process.
Use ConceptDraw DIAGRAM business diagramming and vector graphic software to draw your own business process flowcharts.
See also Samples:
TEN RELATED HOW TO's:
Swimlanes are a visual mechanism of organizing and categorizing activities, in BPMN consist of two types: Pool, Lane. Use ConceptDraw Swimlanes library with 20 objects from BPMN.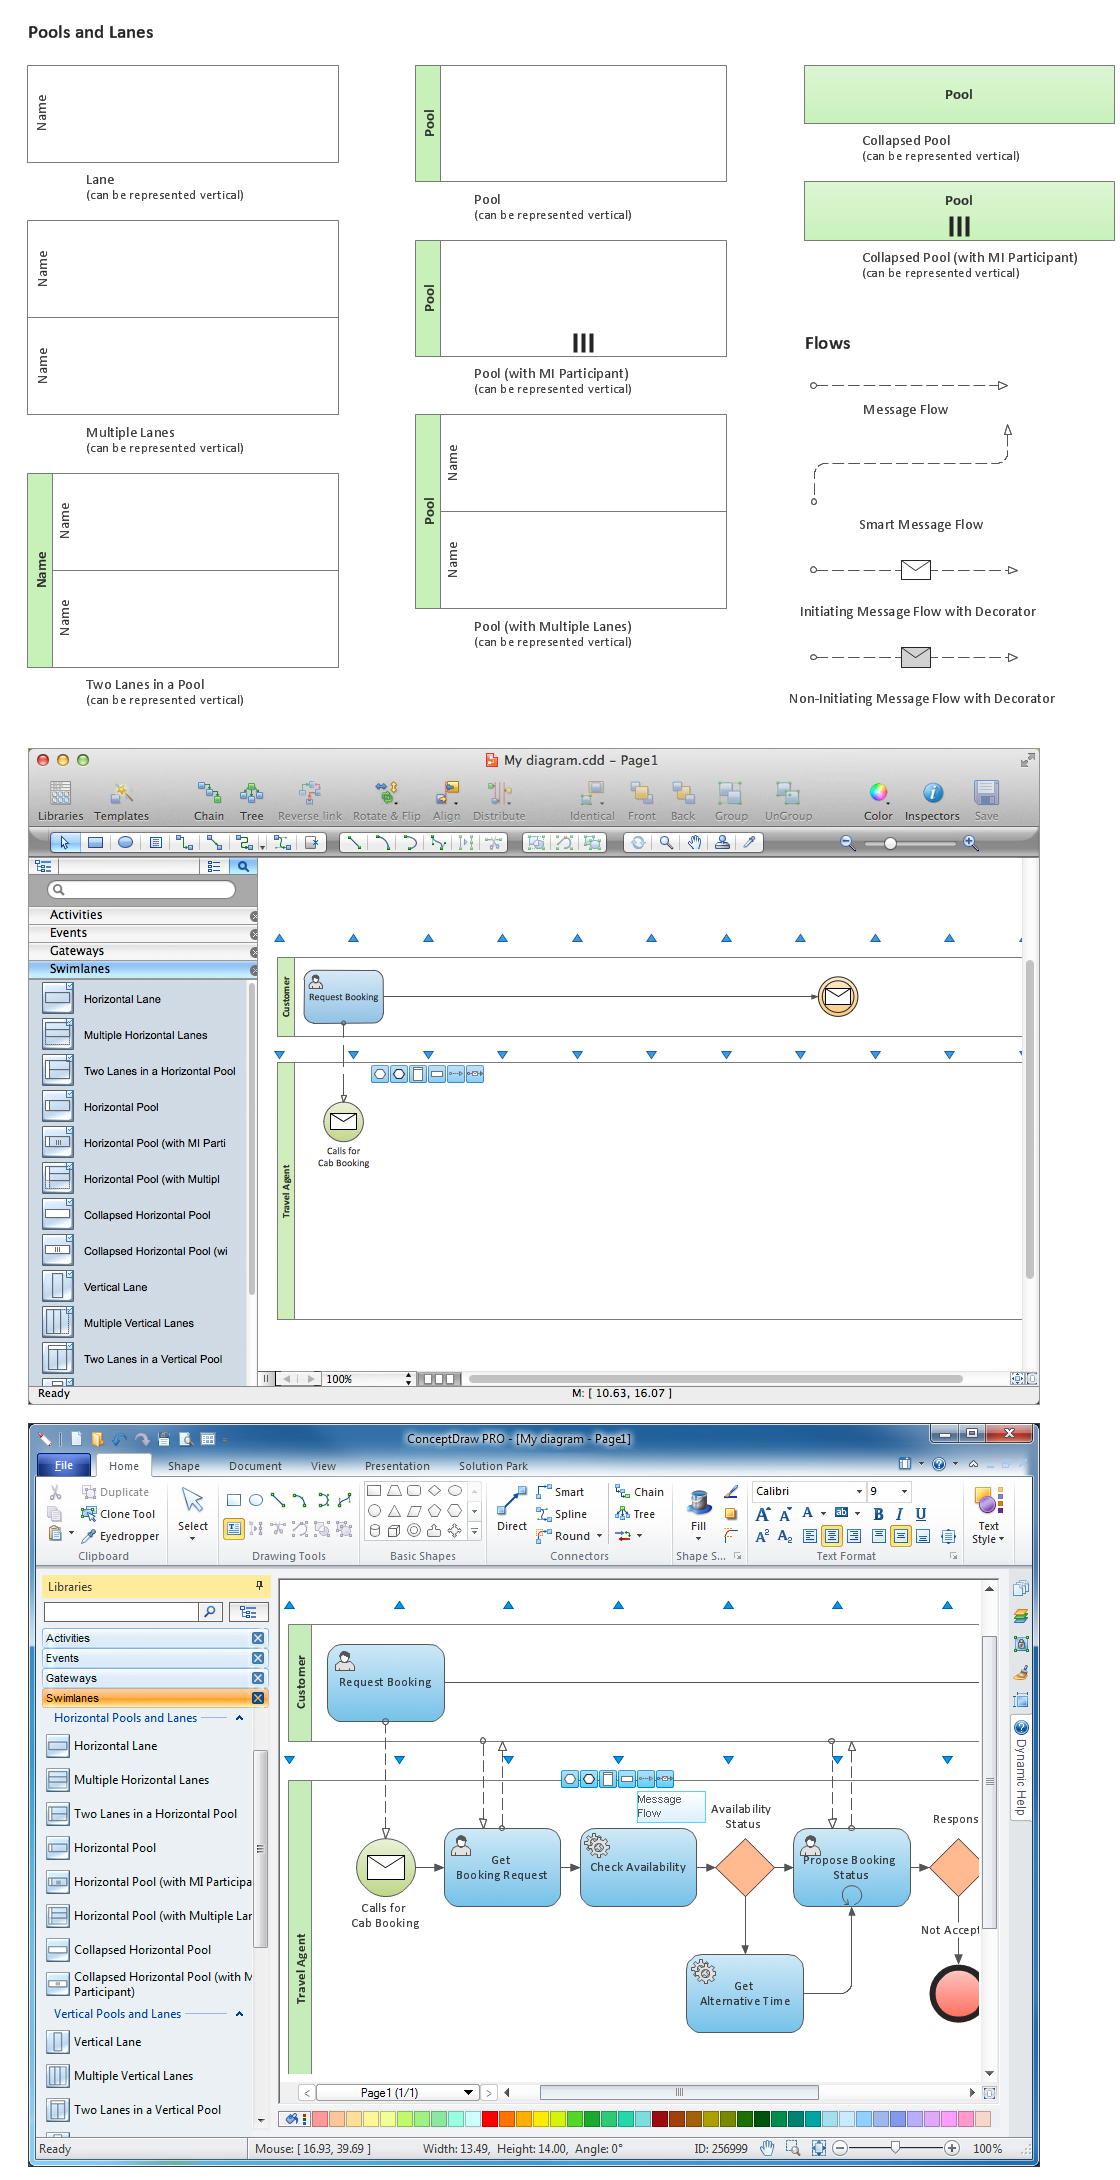
Picture: Diagramming Software for Design Business Process Diagrams
This sample was created in ConceptDraw DIAGRAM diagramming and vector drawing software using the Flowcharts solution from the Diagrams area of ConceptDraw Solution Park.
This sample shows the Flowchart of the Subprime Mortgage Crisis. This Flowchart describes the decline in housing prices when the housing bubble burst and what it caused on the housing and financial markets. You can also see the Government and Industry responses in this crisis situation.
Picture: Flowchart on Bank. Flowchart Examples
Related Solution:
ConceptDraw DIAGRAM diagramming and vector drawing software aspires to help its users in the hiring process and offers a powerful HR Flowcharts Solution from the Management Area of ConceptDraw Solution Park.
Picture: Hiring Process
Related Solution:
ConceptDraw MINDMAP is a fundamental tool in quality management to describe visual instructions on any process.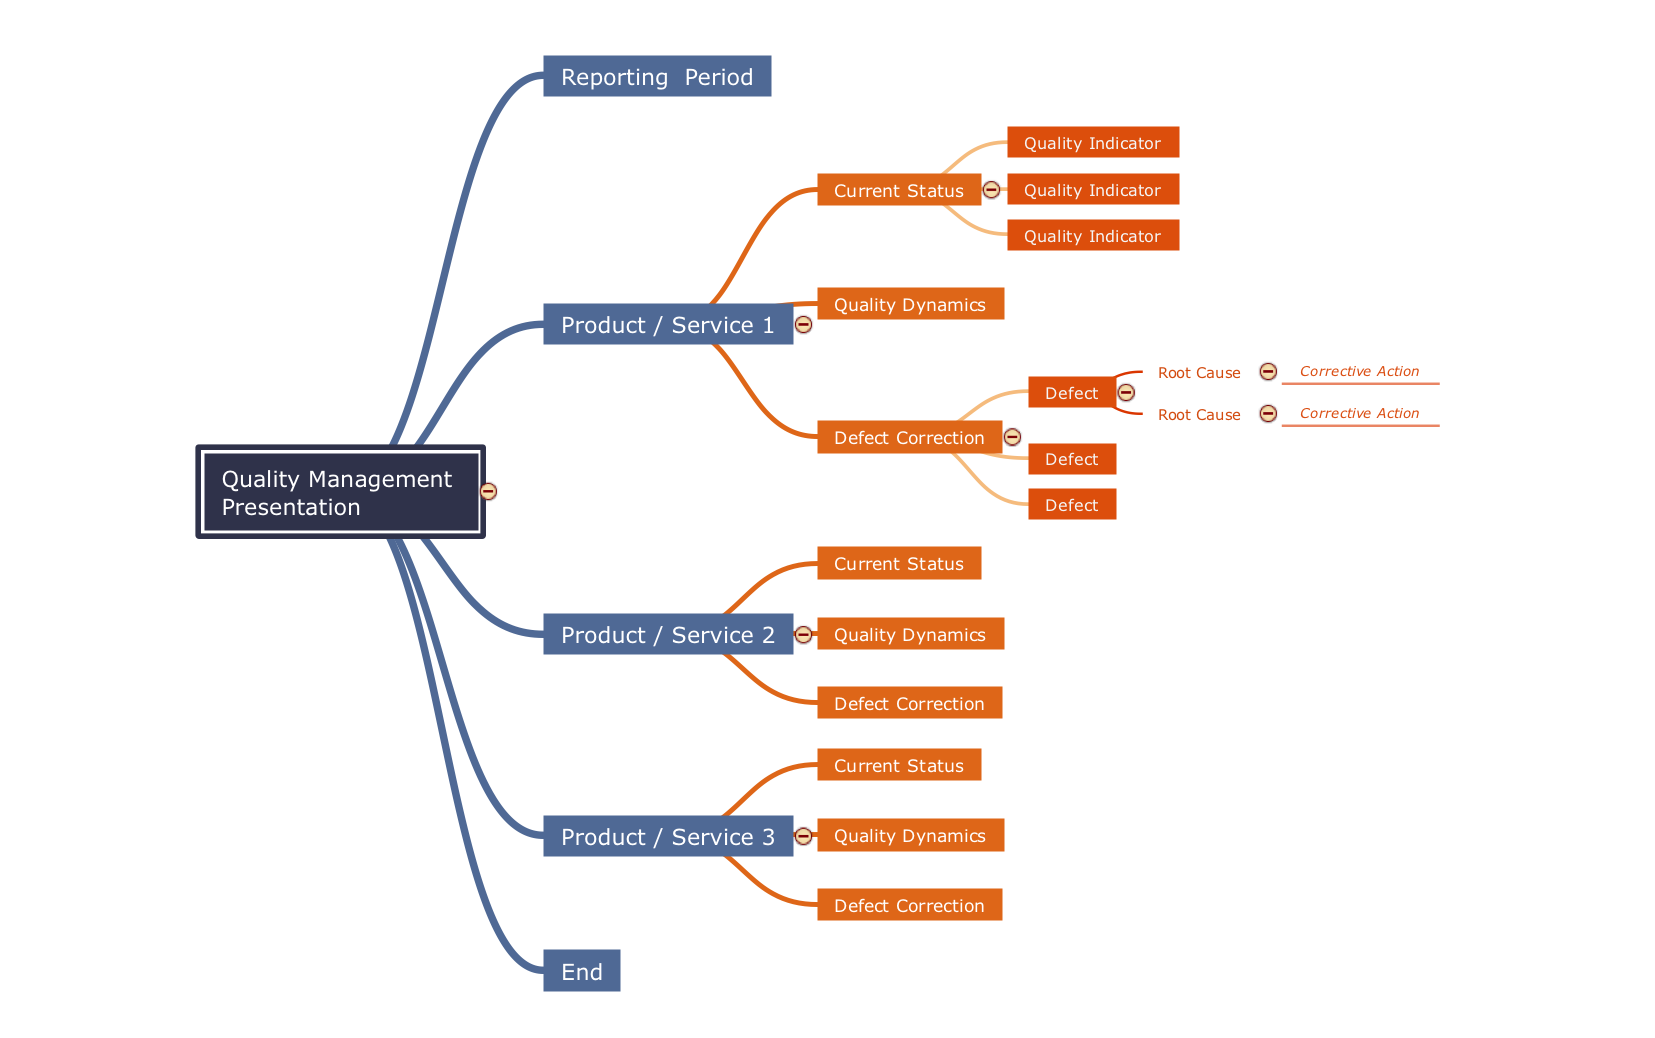
Picture: Fundamental Tool in Quality Management
Related Solution:
This sample shows the Flowchart that displays the solid-state welding processes, the types of welding.
Picture: Types of Welding in Flowchart
Related Solution:
To design a good workflow you have to focus on process analysis, not using the a drawing tool. This is more possible with ConceptDraw DIAGRAM software that brings the most natural drawing manner you have ever tried. First, define steps and procedures using simple rectangle shape, then select all shapes and click the Chain button to connect all shapes just in one click. After that you are able to modify some relations if needed.
Picture: How to Design a Good Workflow
Related Solution:
You need to draw Authority Matrix Diagram quick and easy? Design it with ConceptDraw DIAGRAM!
ConceptDraw DIAGRAM extended with Seven Management and Planning Tools solution from the Management Area is the best Authority Matrix Diagram Software.
Picture: Authority Matrix Diagram Software
Related Solution:
Download ConceptDraw diagram software for easy drawing.
Picture: The Best Choice for Creating Diagram
Related Solution:
Use Case Diagram Taxi Service UML. This sample was created in ConceptDraw DIAGRAM diagramming and vector drawing software using the UML Use Case Diagram library of the Rapid UML Solution from the Software Development area of ConceptDraw Solution Park.
This sample shows the work of the taxi service and is used by taxi stations, by airports, in the tourism field and delivery service.
Picture: UML Block Diagram
Related Solution:
You need to draw the Bar Graph? The automated tool can be useful for you. ConceptDraw DIAGRAM diagramming and vector drawing software extended with Bar Graphs solution from Graphs and Charts area of ConceptDraw Solution Park will help you create any Bar Graph.
Picture: Bar Graph
Related Solution:
ConceptDraw
DIAGRAM 18