
Example 1. Pie Graph Worksheets - Approximate Composition of the Air
Use the extensive drawing tools, Pie Charts library with ready-to-use vector objects, gallery of templates and samples of Pie Charts Solution for creating professional looking Pie Graph Worksheets in minutes.

Example 2. Pie Graph Worksheets - 2008 Autogas Consumption
Pie Graph Worksheets designed in ConceptDraw DIAGRAM software are visual, colorful, clear, so they are attractive and can be successfully used for illustrating and explaining various data and work results in business, statistics, mass media and many other fields.

Example 3. Pie Graph Worksheets - DA Determinations
The Pie Graph Worksheets you see on this page were created in ConceptDraw DIAGRAM using the objects from the Pie Charts library of the Pie Charts Solution. These samples demonstrate the solution's capabilities and the professional results you can achieve. An experienced user spent 5-10 minutes creating every of these samples.
Use the Pie Charts Solution for ConceptDraw DIAGRAM to draw your own Pie Graph Worksheets quick, easy, and effective.
All source documents are vector graphic documents. They are available for reviewing, modifying, or converting to a variety of formats (PDF file, MS PowerPoint, MS Visio, and many other graphic formats) from the ConceptDraw STORE. The Pie Charts Solution is available for all ConceptDraw DIAGRAM or later users.
TEN RELATED HOW TO's:
Any work process visualized as a workflow diagram becomes easier-to-analyse. To visualize work processes regularly we recommend to use ConceptDraw DIAGRAM software extended with the Workflow Diagrams solution. This software contains features and technologies designed to draw workflow diagrams faster.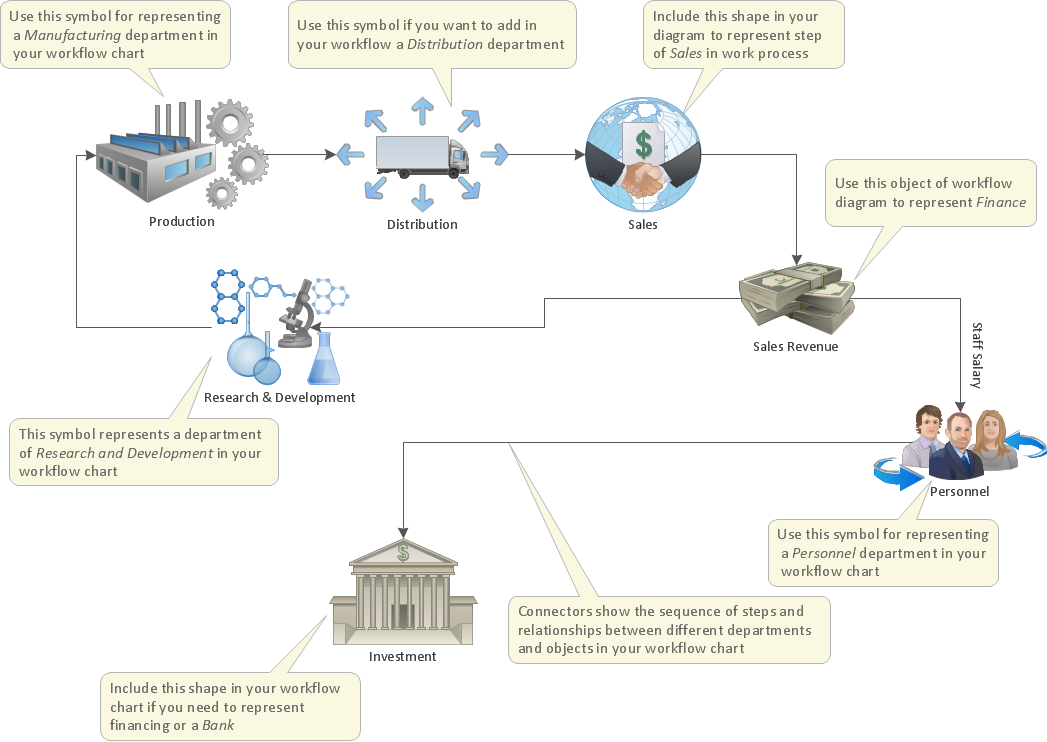
Picture: Work Process
Related Solution:
Business Processes description with ConceptDraw. Business-processes it allows to describe functional blocks, for example production and marketing. ConceptDraw lets creation of business processes description using IDEF0 and IDEF2 methods.
Picture: Business Processes description with ConceptDraw DIAGRAM
Related Solution:
Using the Business Diagrams Solution you can create your own professional-looking Venn Diagrams quick and easy.
Picture: 3 Circle Venn Diagram. Venn Diagram Example
Related Solution:
The Line Graphs solution from Graphs and Charts area of ConceptDraw Solution Park contains a set of examples, templates and design elements library of scatter charts.
Use it to draw scatter graphs using ConceptDraw DIAGRAM diagramming and vector drawing software for illustrating your documents, presentations and websites.
Picture: Scatter Chart Examples
Related Solution:
Local area network connects computers and other network appliances within an area, such as office building or a campus. It can be difficult to provide such network without a predesigned plan. For these purposes you can use network diagram software, which helps you to create LAN network diagrams and office network diagrams quickly and effortless. This will speed up your work and you can save the diagram for the future network improvements.
The following diagram illustrates a network topology of the small office. LAN configuration has a star topology. The local network joins 8 computers among which are several desktop PCs, laptop, two iMacs and iBook. The end-point devices are divided into three groups. Each group is connected to its hub. There is a network printer and a modem, which are interconnected with other devices through a network server. Each computer on the LAN can access the server through a corresponding hub.
Picture: Network Diagram Software. LAN Network Diagrams. Physical Office Network Diagrams
Related Solution:
pyramida
Picture: Pyramid Diagram
Related Solution:
The Onion Diagram is a type of circular diagram which consists of the core circle and concentric circles that look like the cross sections of onion. The key value of the Onion Diagram is to visually demonstrate the relationships that lead to a successful final product or deliverable.
Design of Onion Diagrams and Stakeholder Onions Diagrams is a complex process, but ConceptDraw DIAGRAM diagramming and vector drawing software makes it easier thanks to the Stakeholder Onion Diagrams Solution from the Management Area of ConceptDraw Solution Park, and the set of included libraries and Onion Diagram templates.
Picture: Onion Diagram Templates
Related Solution:
The vector stencils library SSADM from the solution Systems engineering contains specific symbols of SSADM diagrams for ConceptDraw DIAGRAM software.
Picture: SSADM Diagram
The ConceptDraw Flowchart component includes a set of samples and templates. This geathered as flowchart maker toolbox which focused on drawing flowcharts of any industry standards.
Picture: Flowchart Components
Related Solution:
Business People Clipart - Business and Finance solution from Illustration area of ConceptDraw Solution Park.
Use it to quick draw illustrations, diagrams and infographics for your business documents, presentations and websites.
The vector stencils library Business People Clipart includes 12 images.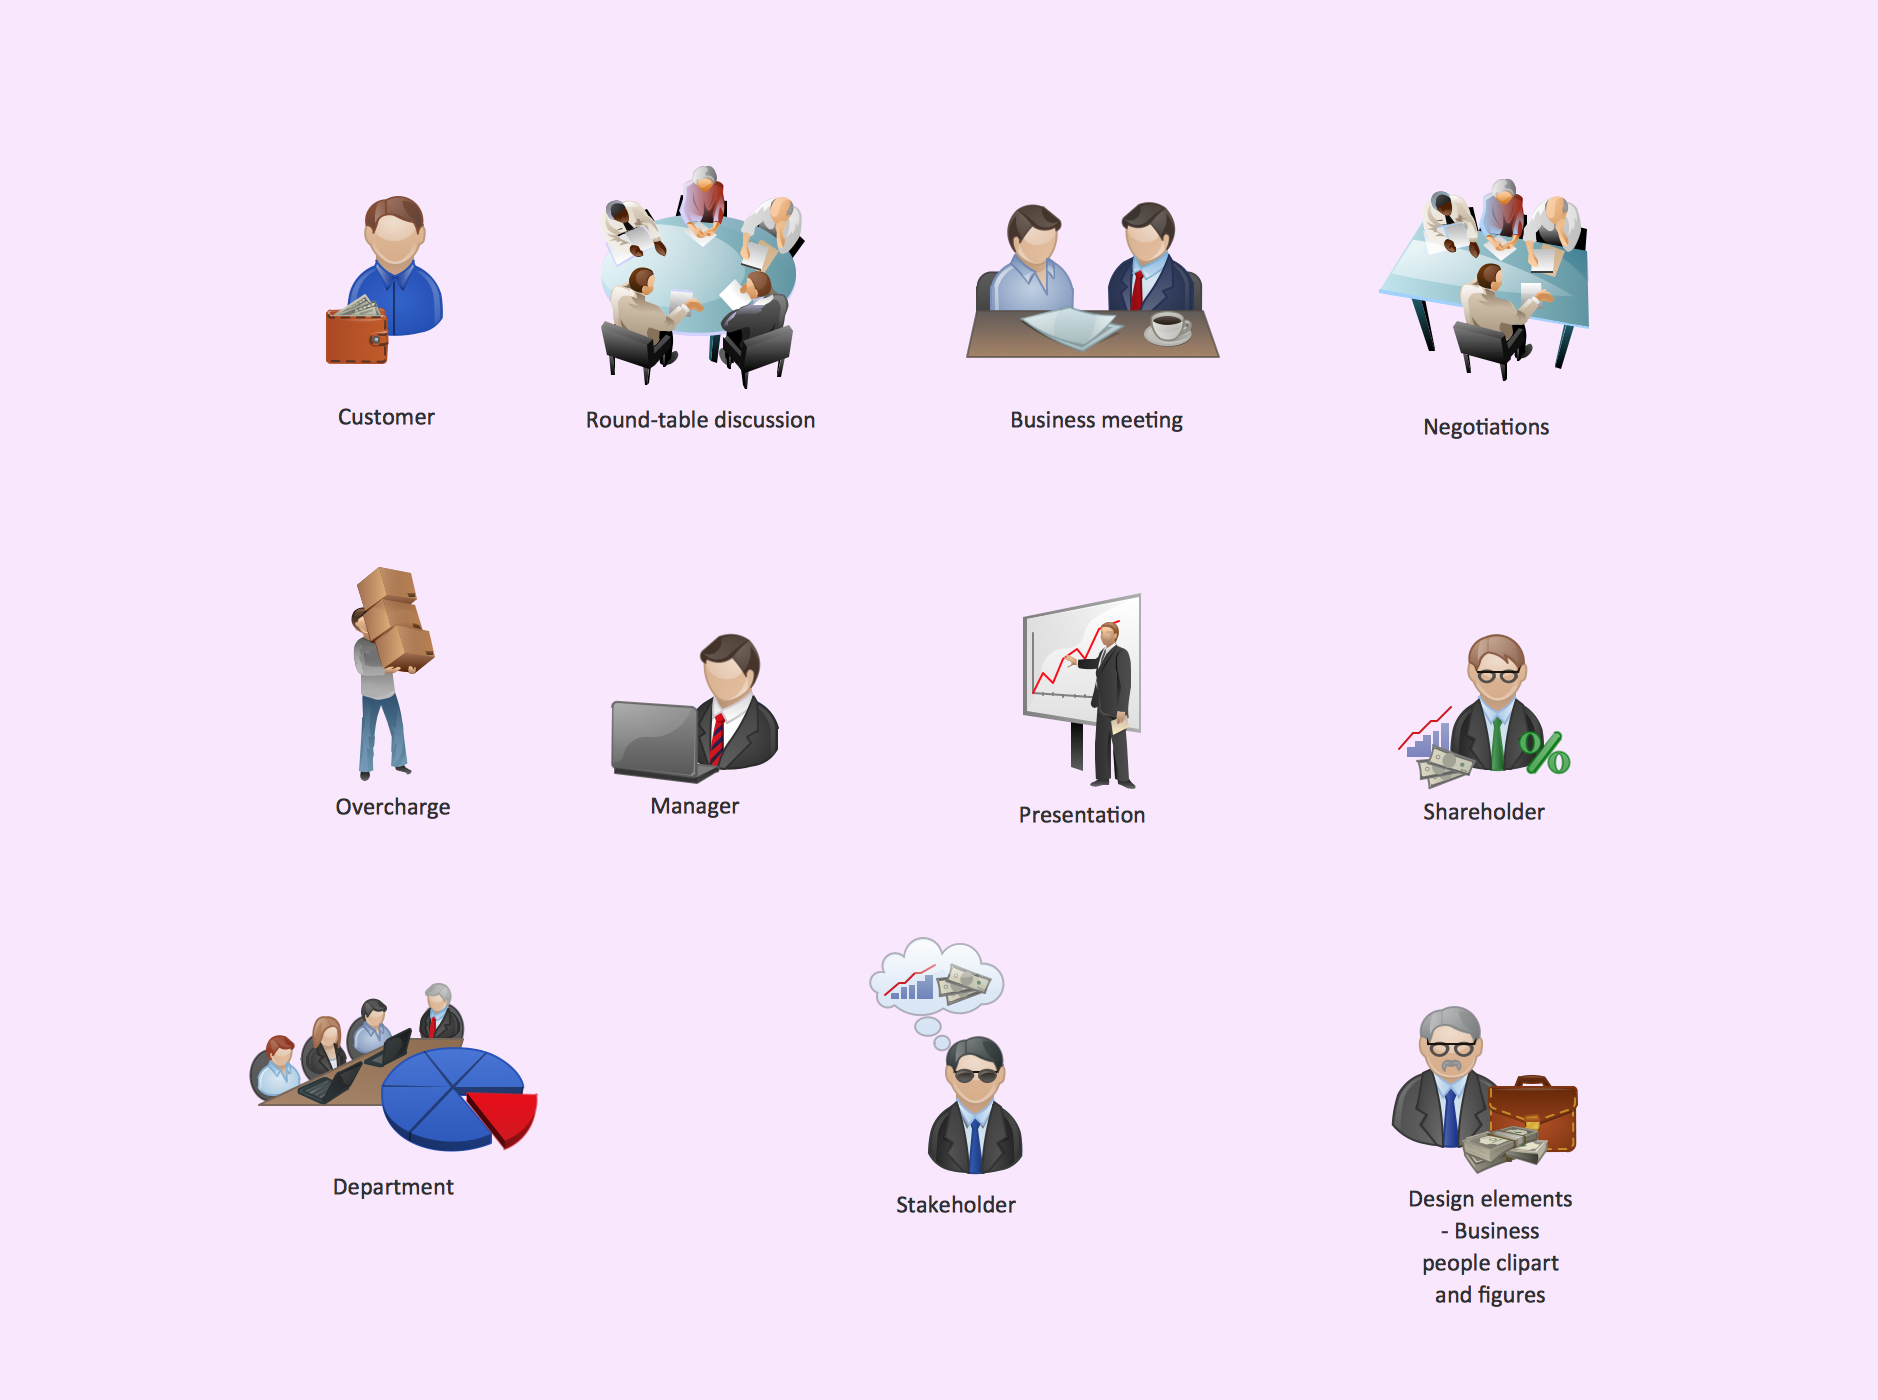
Picture: Business People Clipart
Related Solution:

