
Example 1. Donut Chart - Budgeted Appropriations
First of all the Pie Charts Solution includes collection of various templates which can become the excellent base for your own Donut Chart. They are available from ConceptDraw STORE. You can open any of them and fill according to your data.
Will be also convenient to use the Donut Chart samples from ConceptDraw STORE and large quantity of predesigned vector objects included to Pie Charts library for Pie Charts solution.

Example 2. Donut Chart
The samples and templates of Donut Charts you see on this page were created in ConceptDraw DIAGRAM using the tools of Pie Charts Solution from the Graphs and Charts area. All they demonstrate the solution's capabilities and the professional results you can achieve.
Use Pie Charts Solution for ConceptDraw DIAGRAM to draw your own Donut Chart quick, easy, and effective.
All source documents are vector graphic documents. They are available for reviewing, modifying, or converting to a variety of formats (PDF file, MS PowerPoint, MS Visio, and many other graphic formats) from the ConceptDraw STORE. The Pie Charts Solution is available for all ConceptDraw DIAGRAM or later users.
TEN RELATED HOW TO's:
What Is a Circle Spoke Diagram? It is a diagram which has a central item surrounded by other items in a circle. The Circle Spoke Diagrams are often used to show the features or components of the central item in marketing and management documents and presentations. ConceptDraw DIAGRAM extended with Business Diagrams Solution from the Management Area is the best software for creating Circle-Spoke Diagrams.
Picture: What Is a Circle Spoke Diagram
Related Solution:
Living room is the place where all family comes together, where receive guests. The interior of the living room complements the piano which helps to create a warm atmosphere. The piano is not just a musical instrument, in the room interior it becomes the most noticeable detail. The piano always organically entered in any interior.
Best Interior Design Software for Mac OS&Windows ConceptDraw DIAGRAM allows you design the interior of your dreams quick and easy.
Picture: Living Room. Piano in plan
Related Solution:
Describing a workflow or approval process can take hours and be too complicated, especially since there are options to do it quickly and vividly. Diagrams called flowcharts replace long paragraphs of boring text and represent information in a graphic way. You can draw one on paper or you can use flowchart software to do it quickly and scalable. This kind of software is easy to use and you don’t need any special skills to start using it. In addition, there are a lot examples and predesigned templates on the Internet.
Flowcharts are a best tool for staking out a huge and complex process into some small readable parts. Surely, flowcharts can be drawn manually but the use of standard symbols that make it clear for a wide audience makes a software tool preferred for this task. The core for a successful flowchart is its simplicity. That is why often before beginning making flowchart through software, people draw the sketch on a piece of paper. Designing an effective flowchart means the combination of the data needed to be shown and the simplicity with which you depict it.
Picture: Flowchart Software: A Comprehensive Guide
Related Solution:
This sample shows the Flowchart of the ACC general account creation. This Flowchart describes the Start point, the process of the handling the user requests and the End point – creating of the account. The shapes represent the subprocesses and the arrows between the shapes shows the sequence of the actions.
This sample was created in ConceptDraw DIAGRAM diagramming and vector drawing software using the Flowcharts solution from the Diagrams area of ConceptDraw Solution Park.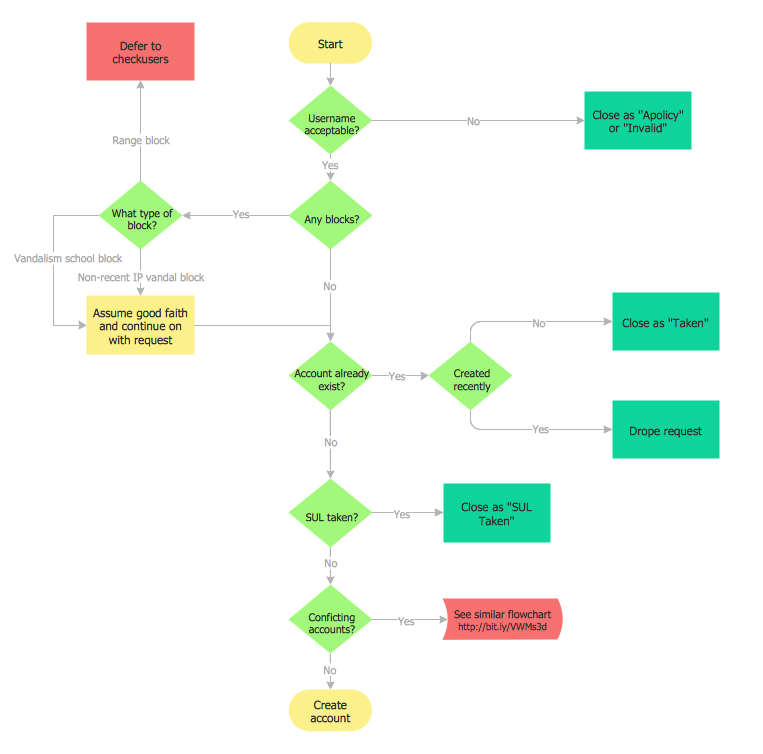
Picture: Examples of Flowchart
Related Solution:
Using diagrams, you can visualize the flow of the information or build a detailed data structure. There's no need to have a degree in software and database design with ConceptDraw DIAGRAM , because this software has all the tools needed in developing models and diagrams. Project planning, designing and prototyping was never so easy.
This UML diagrams can be used to visualize a model of the data base development process. A UML diagram shows a graphical view of a structure of software system: components and relationships.
Using Unified Modeling Language helps to depict logical and physical elements of a data base, visually represent requirements and sub-systems. UML diagrams allows developers to organize and predict critical issues, as well as collaborate data base information.
Picture: Software and Database Design with ConceptDraw DIAGRAM
Related Solution:
This sample shows the Purchasing Flow Chart Diagram that displays the money flow in the carbon offset sphere. The carbon offsets are the compensatory measures that the companies make for the carbon emissions. You can see on this sample the groups that have interests in the carbon offsets and the money flow after the carbon offset vendors sold the carbon offsets.
Picture: Purchasing Flow Chart.Purchasing Flowchart Example
Related Solution:
This sample was created in ConceptDraw DIAGRAM diagramming and vector drawing software using the Line Graphs Solution from Graphs and Charts area of ConceptDraw Solution Park.
This sample shows the Line Chart of annual percentage change. The Line Chart allows you to clearly see the changes of data over the time.
Picture: Line Chart Template for Word
Related Solution:
Venn Diagrams visualize all possible logical relations between several sets and are widely used in mathematics, logic, statistics, marketing, sociology, etc.
This Venn Diagram shows the relative complement of the set A with respect to the set B. It is the set of the elements in B, but not in A. In other words it is the set-theoretic difference B-A.
Picture:
Basic Circles Venn Diagram
Venn Diagram Example
Related Solution:
You need to draw a Functional Flow Block Diagram? You are an artist? Now it doesn't matter. With Block Diagrams solution from the Diagrams area for ConceptDraw Solution Park you don't need more to be an artist to design the Functional Flow Block Diagram of any complexity.
Picture: Functional Flow Block Diagram
Related Solution:
Using the ready-to-use predesigned objects, samples and templates from the Business Diagrams Solution you can create your own professional-looking Venn Diagrams quick and easy.
Picture: 2 Circle Venn Diagram. Venn Diagram Example
Related Solution:


