
Example 1. Circle Spoke Diagram Template
The predesigned Circle Spoke Diagram template is available from ConceptDraw STORE. You need only open it and fill to get your own professional-looking Circle-Spoke Diagram. You are able to type the text to the circles of template, resize circles and change their color.

Example 2. Circle-Spoke Diagrams Solution in ConceptDraw STORE
The Business Diagrams Solution offers a variety of different Circle-Spoke Diagram samples which are also presented in ConceptDraw STORE, and Circle-Spoke Diagrams library with variety of predesigned objects.

Example 3. Circle-Spoke Diagram - Target Market
This sample was created in ConceptDraw DIAGRAM using the Circle Spoke Diagram Template from the Business Diagrams Solution and shows the main components of the target market. An experienced user spent 5 minutes creating this sample.
Use the Business Diagrams Solution for ConceptDraw DIAGRAM software to create your own professional-looking Circle-Spoke Diagram on the base of Circle Spoke Diagram template quick, easy and effective.
All source documents are vector graphic documents. They are available for reviewing, modifying, or converting to a variety of formats (PDF file, MS PowerPoint, MS Visio, and many other graphic formats) from the ConceptDraw STORE. The Business Diagrams Solution is available for all ConceptDraw DIAGRAM or later users.
TEN RELATED HOW TO's:
Draw your own business process flowcharts using ConceptDraw DIAGRAM diagramming and business graphics software.
The Flowcharts Solution for ConceptDraw DIAGRAM is a comprehensive set of examples and samples in several different color themes for professionals that need to graphically represent a process.
Picture: Flow Chart Diagram Examples
Related Solution:
Helps to create professionally looking and detailed Sales Flowcharts with all sales steps visually represented on them.
Use the Sales Flowcharts Solution for ConceptDraw DIAGRAM software to create your own Sales Flowcharts of any complexity quickly, easily and effectively to use them successfully in your work activity.
ConceptDraw DIAGRAM diagramming and vector drawing software supplied with unique Sales Flowcharts solution from the Marketing area of ConceptDraw Solution Park allows fast and easy visualize all sales steps of the sales process on a sales process Map or sales process flowchart, and then realize them easily.
Picture: Sales Steps
Related Solution:
Flow diagrams is a diagram used for structuring complex system and visually representing a flow and interactions of elements in a system.
ConceptDraw DIAGRAM diagramming and vector drawing software enhanced with Flowcharts Solution from the Diagrams Area of ConceptDraw Solution Park is perfect for easy drawing professional looking Flow Diagrams.
For drawing Flow Diagrams the Flowcharts Solution provides: 2 libraries with commonly used predesigned vector objects - Flowchart library and Flowcharts Rapid Draw library; collection of Flow Diagrams samples; Basic Flowchart template.
Picture: Flow Diagrams
Related Solution:
Planning a water supply system is one of the stages of developing a building drawing. Although materials are constantly improved, design elements for plumbing haven't changed sufficiently for decades. This is due to necessity of maintaining very old systems.
The plan and schematic drawing of plumbing equipment, water pipe junctions and, kitchen facilities a is a rather significant element of a building plan. The suite of 4 vector libraries supplied with ConceptDraw solution for Plumbing and Piping Planning includes near 130 vector images of pipes, boilers, water pipe junctions, tanks and other plumbing devices, helpful when creating plumbing and piping plans, and blueprints of sewerage or water supply systems.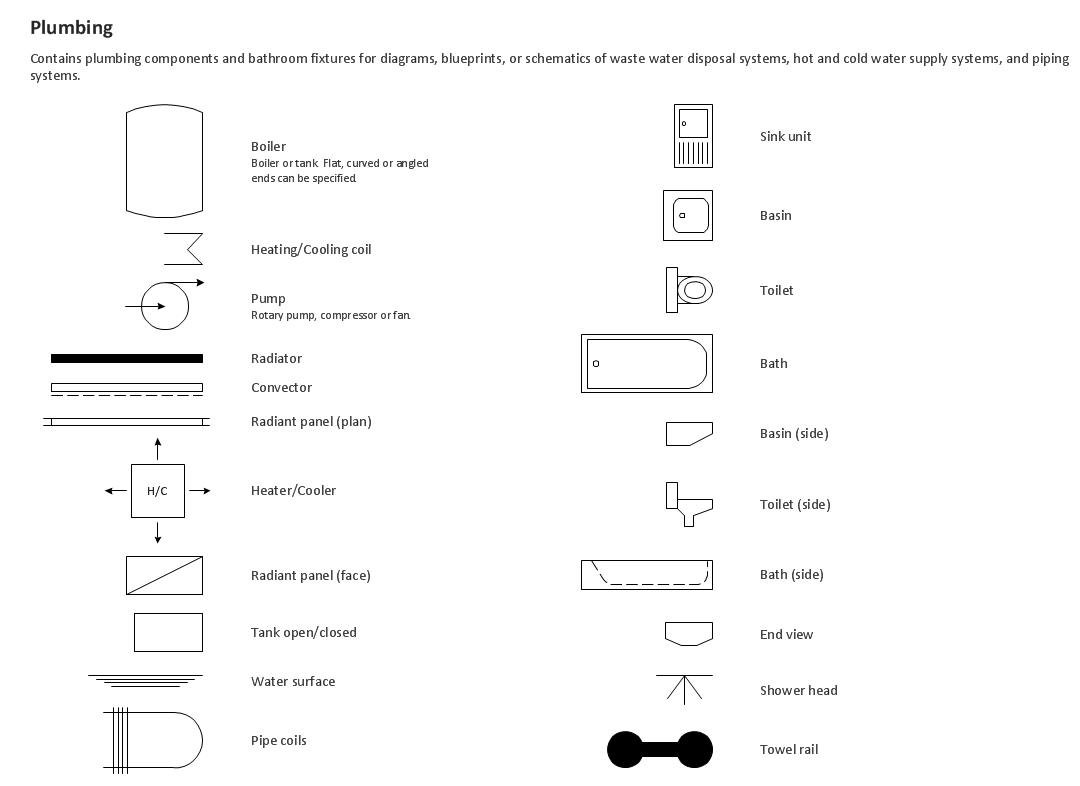
Picture: Building Drawing. Design Element — Plumbing
Related Solution:
An onion diagram is a kind of chart that shows the dependencies among parts of an organization or process. The chart displays items in concentric circles, where the items in each ring depend on the items in the smaller rings. The Onion Diagram is able to show layers of a complete system in a few circles.
But how to create Onion Diagram? Now, it's very easy thanks to the ConceptDraw DIAGRAM diagramming and vector drawing software extended with Stakeholder Onion Diagrams Solution from the Management Area of ConceptDraw Solution Park.
Picture: How To Create Onion Diagram
Related Solution:
An example flowchart of marketing analysis shows main steps you have to challenge writing a marketing analysis.
Picture: Flowchart Example: Flow Chart of Marketing Analysis
Related Solution:
If you want to find a way to understand complex things in minutes, you should try to visualize data. One of the most useful tool for this is creating a flowchart, which is a diagram representing stages of some process in sequential order. There are so many possible uses of flowcharts and you can find tons of flow charts examples and predesigned templates on the Internet. Warehouse flowchart is often used for describing workflow and business process mapping. Using your imagination, you can simplify your job or daily routine with flowcharts.
Warehouse flowcharts are used to document product and information flow between sources of supply and consumers. The flowchart provides the staged guidance on how to manage each aspect of warehousing and describes such aspects as receiving of supplies; control of quality; shipment and storage and corresponding document flow. Warehouse flowchart, being actual is a good source of information. It indicates the stepwise way to complete the warehouse and inventory management process flow. Also it can be very useful for an inventory and audit procedures.
Picture: Flow Chart Example: Warehouse Flowchart
Related Solution:
The Cisco Network Diagrams Solution from the Computer and Networks area of ConceptDraw Solution Park helps you to create the Cisco Network Diagrams quick and easy using the ConceptDraw DIAGRAM diagramming and vector drawing software.
The Cisco Network Diagrams Solution contains 14 libraries with 450 ready-to-use predesigned vector objects.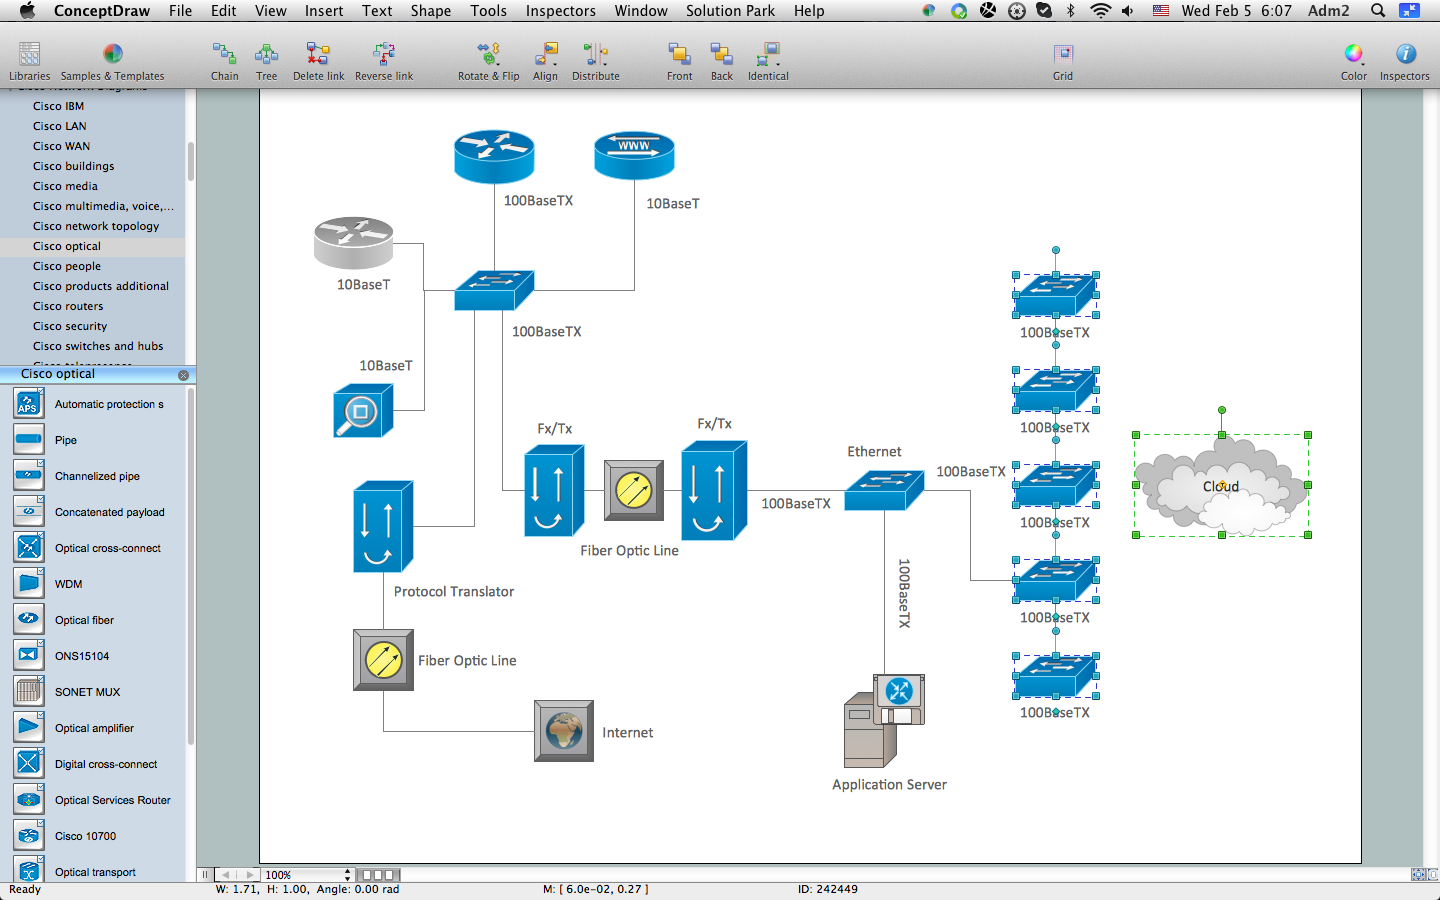
Picture: How to Create Cisco Network Diagram
Related Solution:
The Affinity Diagram shows the structure of large, complex factors that have an influence on a problem, and then divides them up into a smaller and simpler structure. The Affinity Diagram does not show a causal relationship between the factors. This diagram is designed to prepare the data for further analysis of the cause-effect relationships.
Picture: Affinity Diagram
Related Solution:
Use the libraries from the Block Diagrams solution to draw block diagrams for your business documents, presentations and websites in a few minutes.
Picture: Block Diagram
Related Solution:

