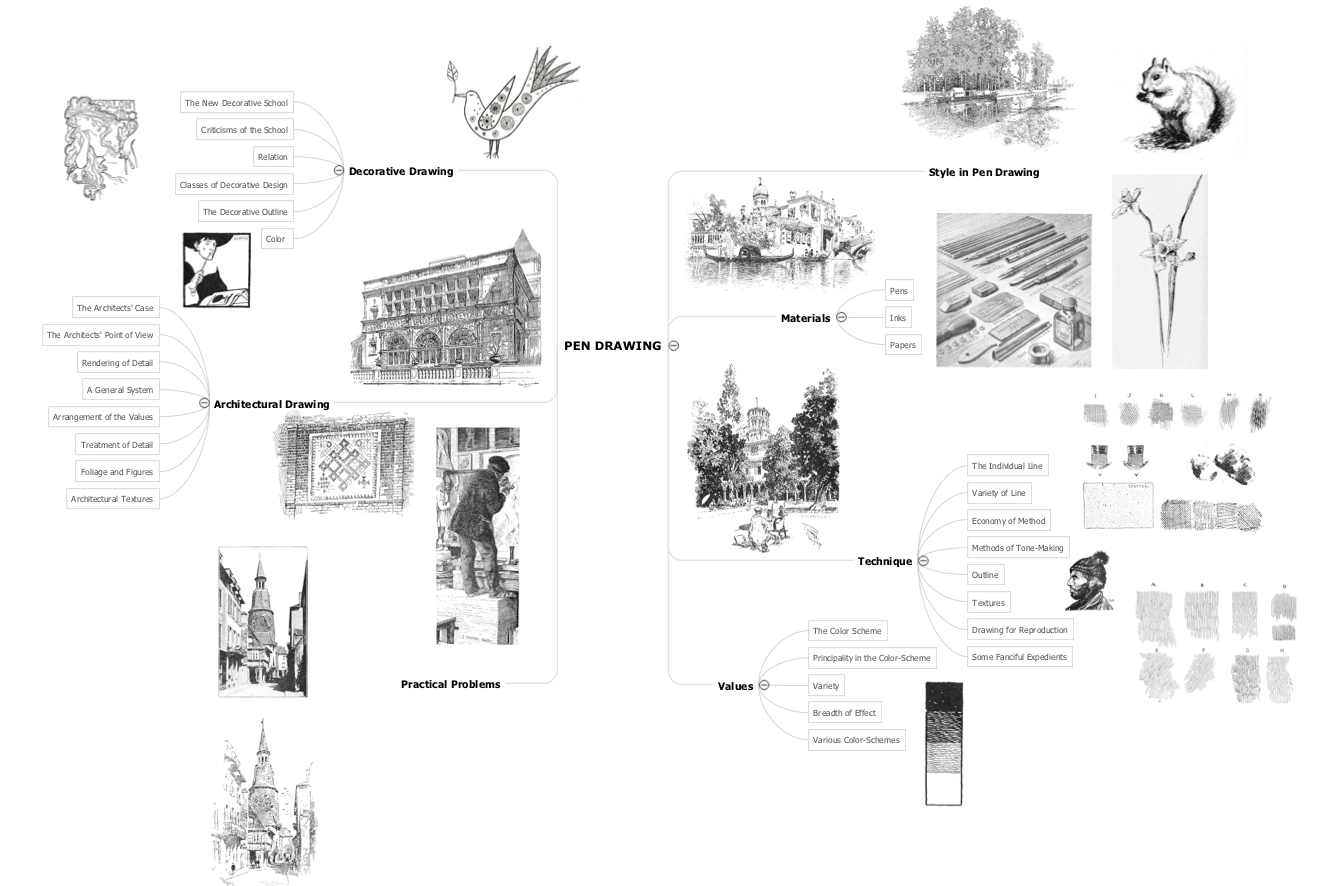
Sample 1. Mind map presentation - Pen drawing.
Why to import PowerPoint slides into ConceptDraw MINDMAP ?
There are three usable scenarios.
Scenario 1 — Need to Review PowerPoint Content.
A major proposal to your company includes a PowerPoint slide deck covering some of the more detailed points. Flipping from slide to slide takes time, and in the process you can lose or obscure the meaning behind the presentation. With the latest update to ConceptDraw MINDMAP, you can easily extract the content from the presentation and see how it all fits together in a single view.
Scenario 2 — Organization of Presentation Content.
You have to give an important presentation to the Board of Directors on Friday. The last presentation you gave they picked apart. They said it wasn’t presented properly, and that it was very hard to follow. They felt you should have done a better job of supporting your critical points.
Scenario 3 — Improve Learning from Slides.
The class you are attending has distributed slide presentations that contain lots of study content. The challenge is to take all of the material from class and use it to better leverage the time you have to study. With ConceptDraw MINDMAP you can pull the content into a map that gives you better access to the class materials.
TEN RELATED HOW TO's:
These donut chart templates was designed using ConceptDraw DIAGRAM diagramming and vector drawing software extended with Pie Charts solution from Graphs and Charts area of ConceptDraw Solution Park.
All these donut chart templates are included in the Pie Charts solution.
You can quickly rework these examples into your own charts by simply changing displayed data, title and legend texts.
Picture: Donut Chart Templates
Related Solution:
There are many ways to define the flow of information within a system. Structured-systems analysis method often uses data flow diagrams to show data flow, data storages and data processing visualization. These diagrams are easy to develop and quite useful.
Here is a dataflow diagram presenting an example of the manufacturing process flow. The oval process shapes represent a process that controls data within the current system. The process may produce data or make some action based on data. Data flows are represented by lines. They show the movement of information through the system. The direction of the data flow is depicted by the arrow. The external entities are shown by rectangles. They represent the external entities interacting with the system. The data store objects (unclosed rectangles) are used to show data bases participating in a process flow.
Picture: Data Flow Diagram
Related Solution:
Use ConceptDraw MINDMAP for creative thinking, planning, organization, problem solving, presentations, decision making, note taking, team brainstorming and other tasks.
Picture: Applications
ConceptDraw map templates are great starting points to identify, track, and address quality initiatives in your organization.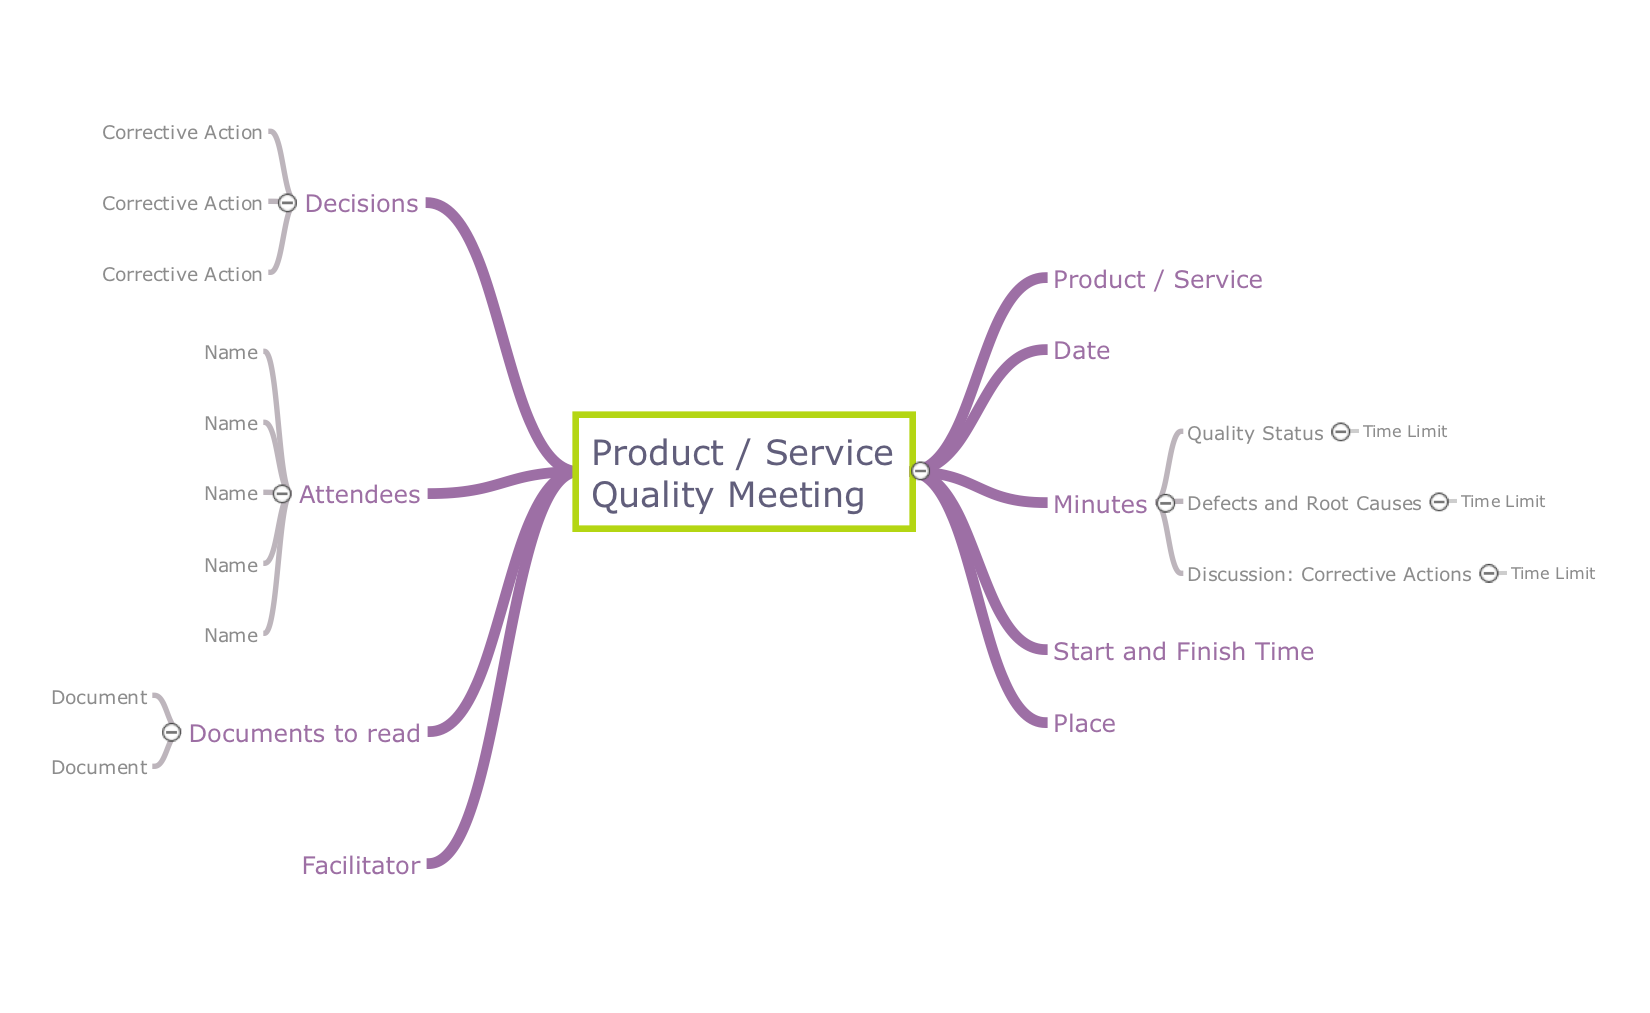
Picture: Quality Mind Maps
Related Solution:
One of the stages of the problem's solving process scenario is Corrective Action Planning.
Corrective action planning define people and groups involvement in corrective actions by roles, identify logical sequences of scheduled actions and critical path of problem solving, identify possible risks of action plan and propose preventive actions.
Picture: Corrective Action Planning
Designing of food images, fruit art illustrations, pictures of vegetables, and many other food and cafe related images and infographics has never been easier than it is now with ConceptDraw DIAGRAM software.
ConceptDraw DIAGRAM diagramming and vector drawing software extended with Food Court solution from the Food and Beverage area of ConceptDraw Solution Park is perfect food pictures design software.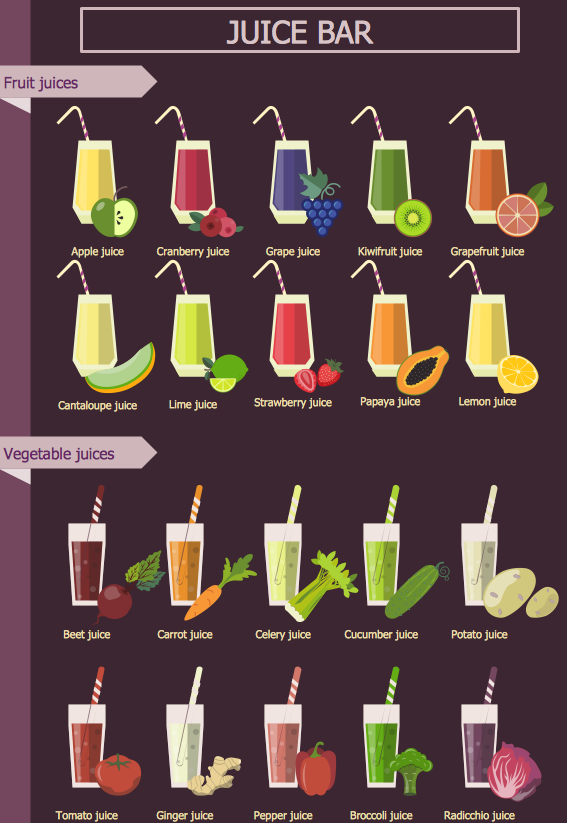
Picture: Pictures of Vegetables
Related Solution:
ConceptDraw MINDMAP is a powerful business and personal productivity software application that provides visual organization and access to information for individuals and organizations.
Picture: ConceptDraw MINDMAP :Brainstorming, Mind Mapping for macOS and Windows
Draw Company Structure Diagram - get the detailed information about the company structure and hierarchy - who execute what tasks and who is in charge at this company. This information shows the reasoning and success of business and is indispensable for investors and financial institutions.
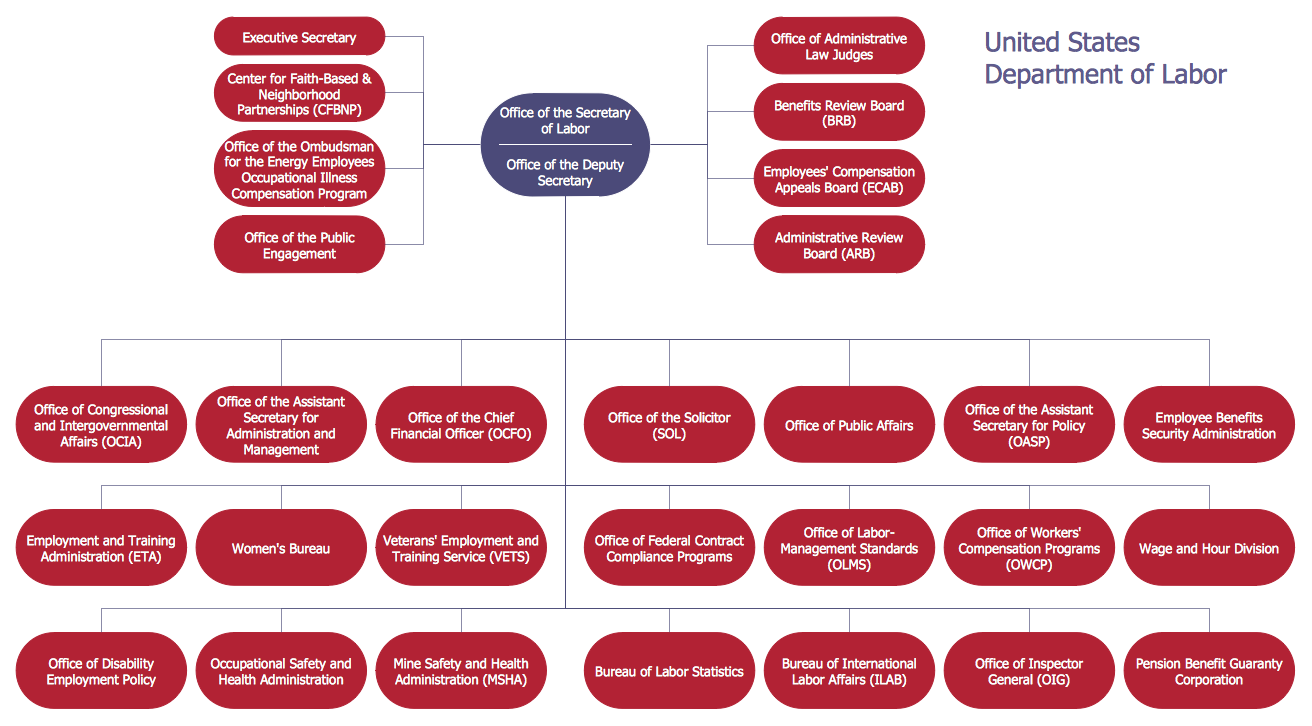
Picture: Draw Company Structure with Organization Charting Software
Related Solution:
Video tutorials on ConceptDraw products. Try it today!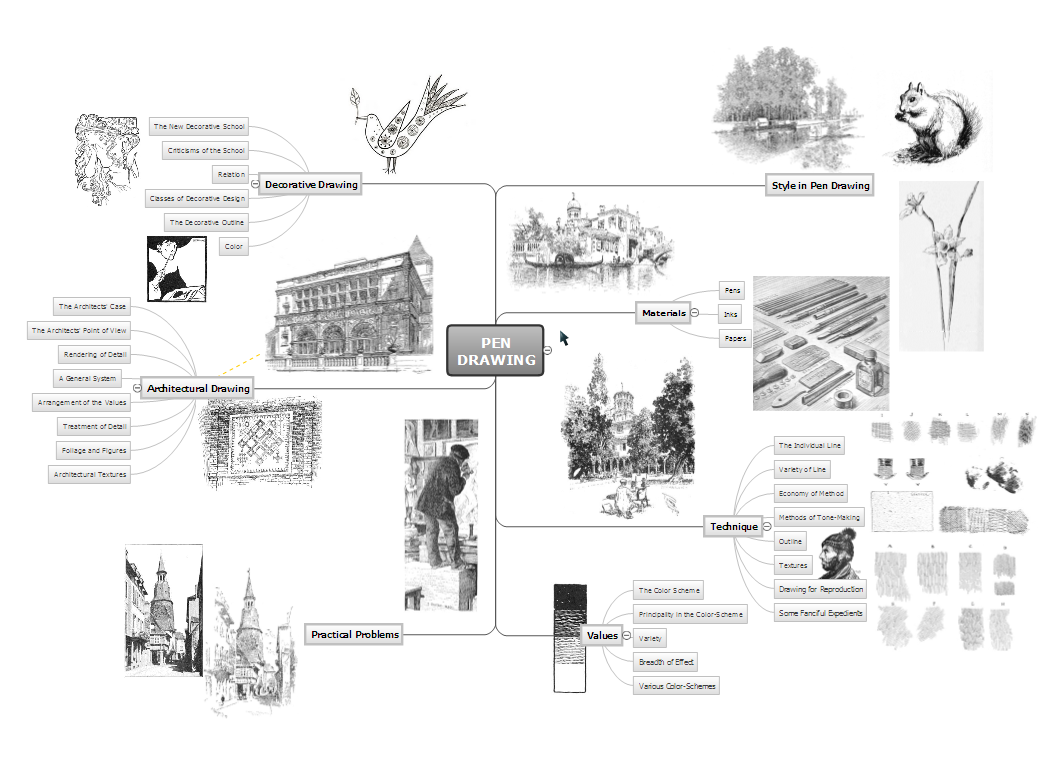
Picture: Exporting maps as graphics or to other applications from ConceptDraw MINDMAP (for Macintosh)
The CCTV is the process that carried out using the video cameras for transmitting the signal to the specific location, on the limited set of monitors. We are talking about the video cameras that are used for monitoring on such guarded objects as airports, banks, stores, military objects, etc. CCTV equipment is also used in the industrial installations, for surveillance in the public places, for recording the video on the digital video recorders.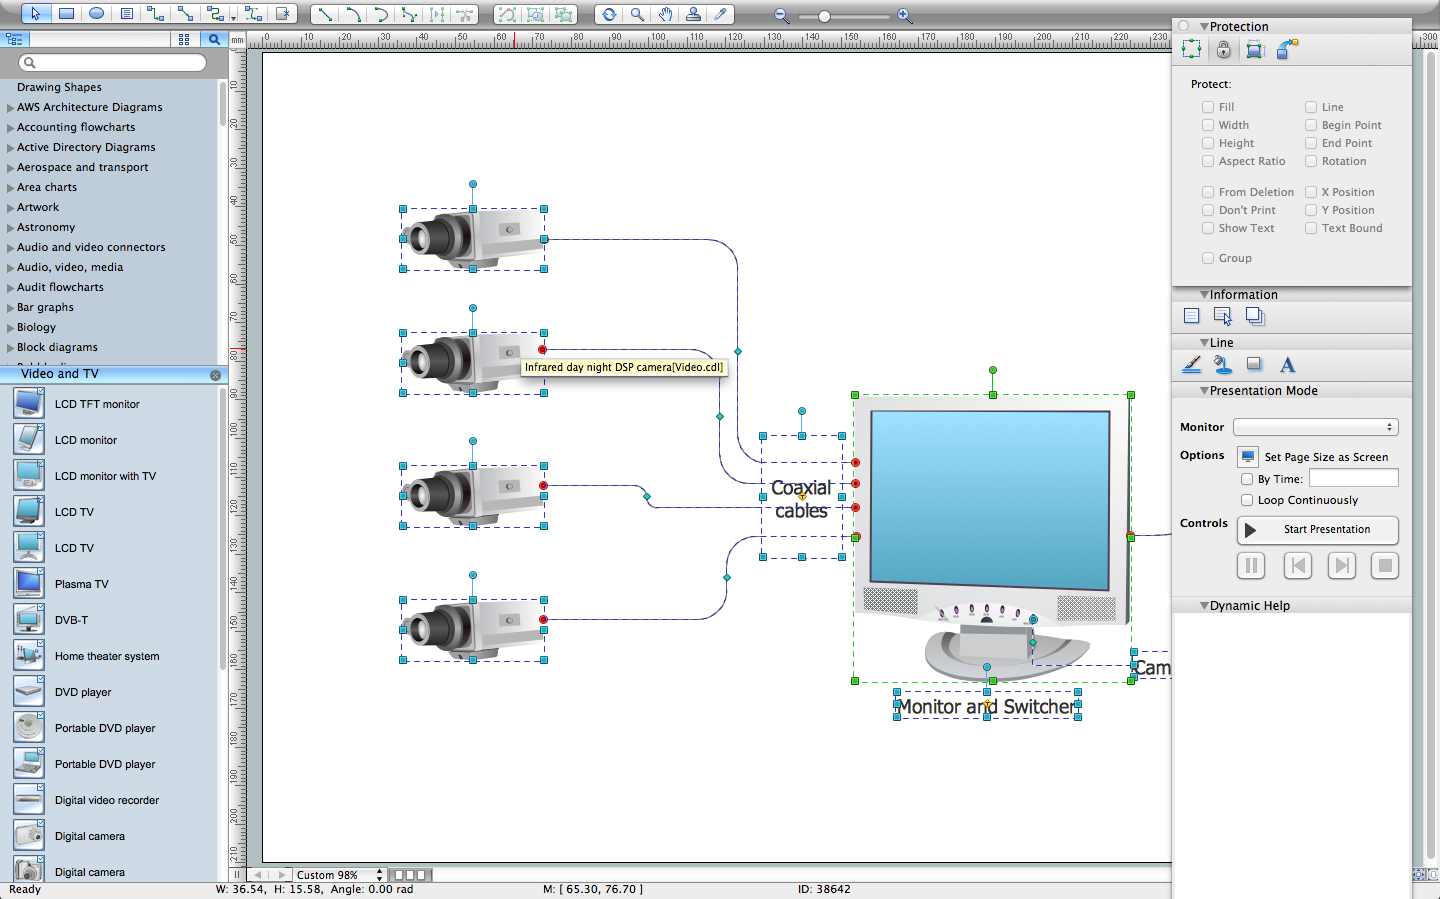
Picture: CCTV Network Diagram Software
Related Solutions: