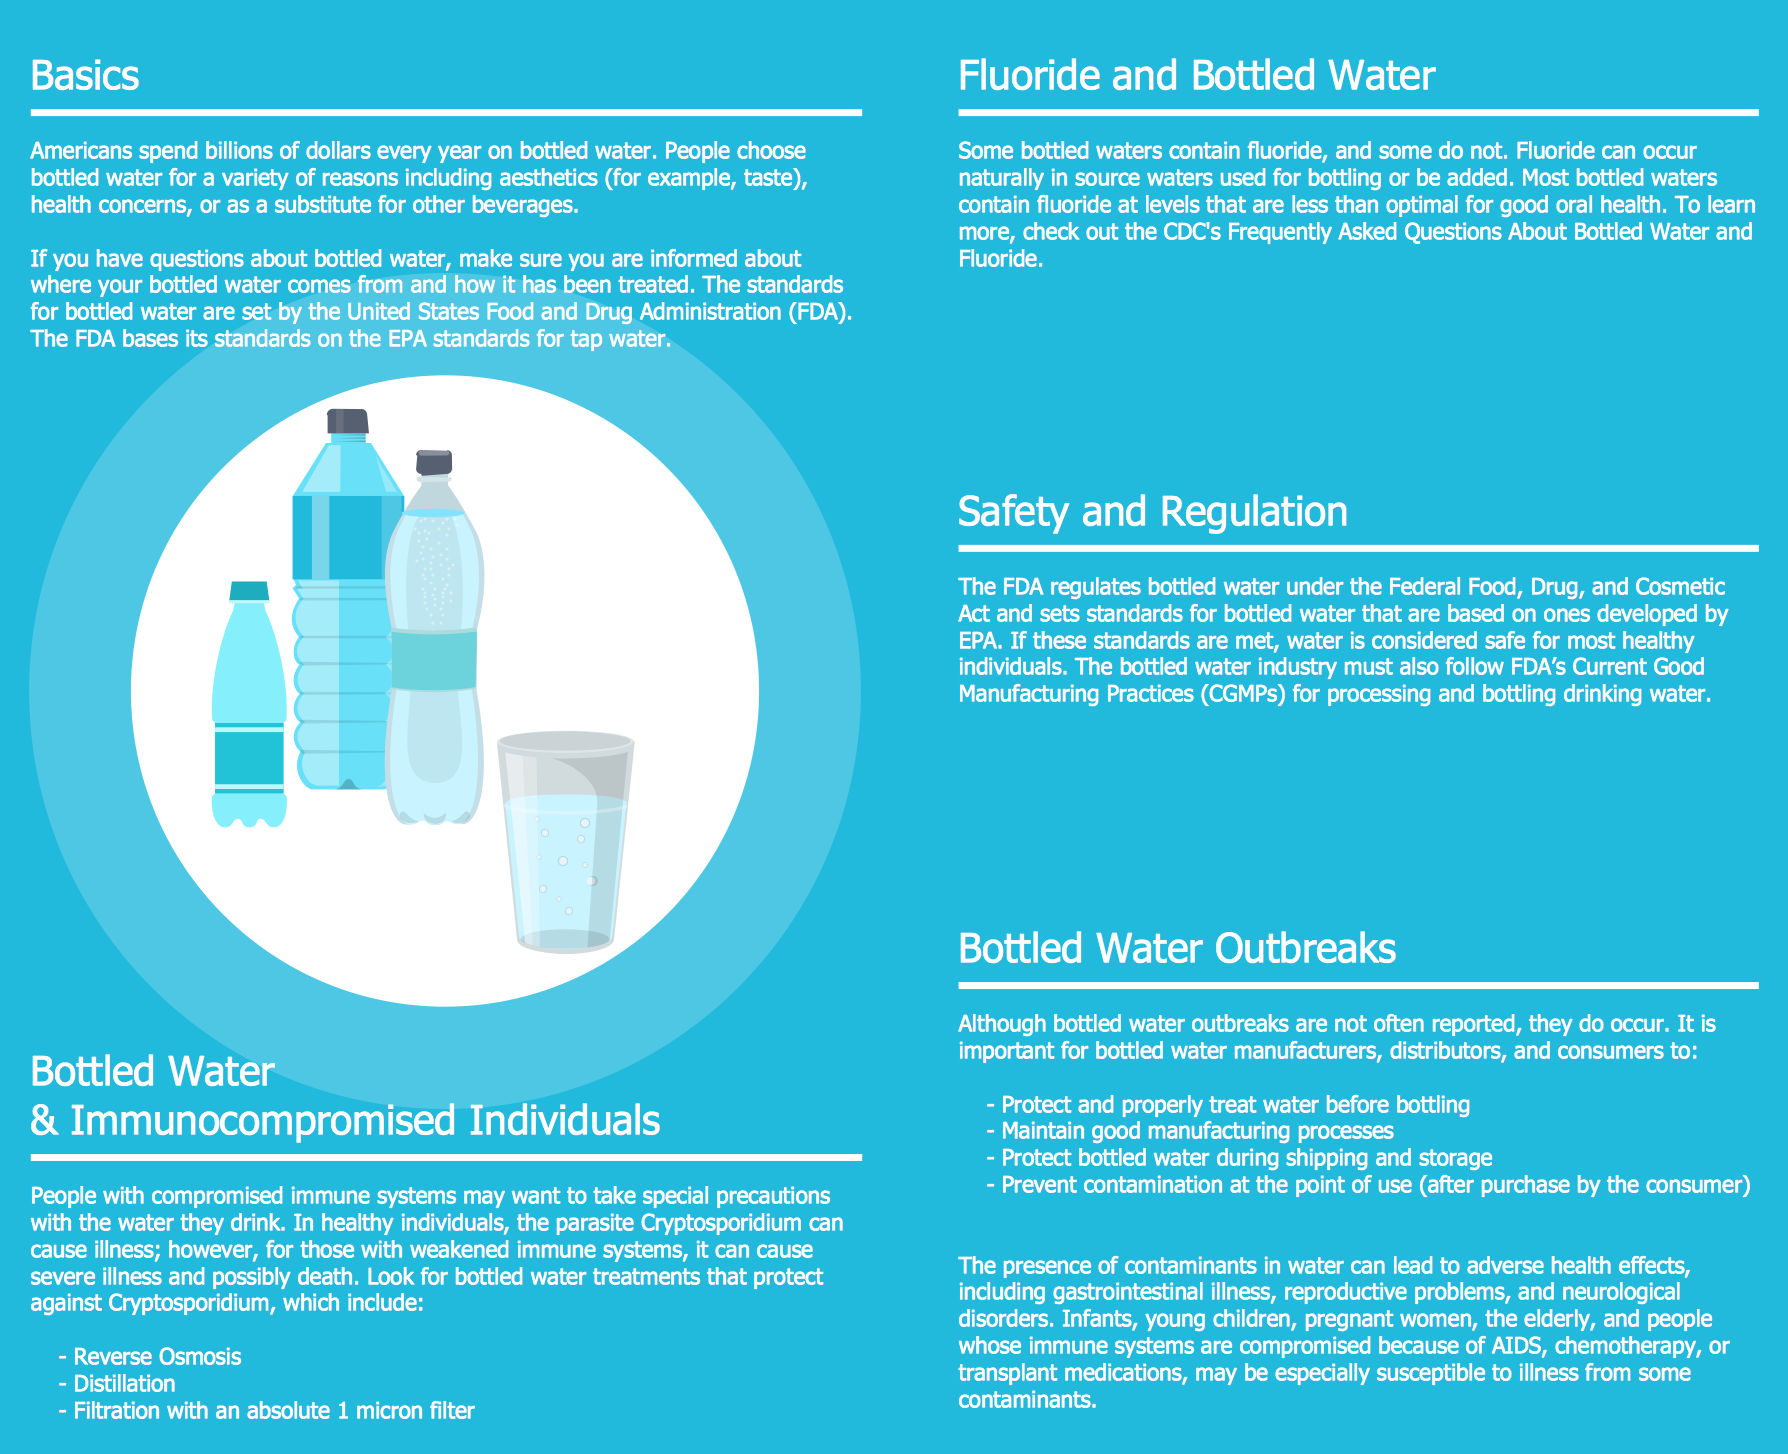
Example 1. Healthy Food Ideas
Health Food Solution offers at your disposal 8 libraries with 238 ready-to-use predesigned vector objects and clipart to make your drawing healthy foods illustrations fast and easy. Don't afraid to experiment, invent, depict and realize your daring healthy food ideas with ConceptDraw DIAGRAM software!

Example 2. Health Food Solution in ConceptDraw STORE
Health Food Solution offers also large collection of predesigned samples and examples which are available for viewing and editing from ConceptDraw STORE. You can use any desired of them as the base for your own illustration.

Example 3. Healthy Food Ideas - Dark Chocolate Facts
The samples you see on this page were created in ConceptDraw DIAGRAM software using the Health Food Solution. An experienced user spent 10-15 minutes creating each of these healthy food samples.
Use the tools of the Health Food Solution for ConceptDraw DIAGRAM Solution Park to quickly and simply represent and illustrate your own healthy food ideas.
All source documents are vector graphic documents. They are available for reviewing, modifying, or converting to a variety of formats (PDF file, MS PowerPoint, MS Visio, and many other graphic formats) from the ConceptDraw STORE. The Health Food Solution is available for all ConceptDraw DIAGRAM users.
TEN RELATED HOW TO's:
It is so simple making the drawing process easier and faster. you just need to choose the right drawing software.
ConceptDraw Arrows10 Technology - This is so easy and fast to draw any type of diagram with any degree of complexity.
Picture: Simple & Fast Diagram Software
Related Solutions:
Sometimes, it's not easy to fit everything you need into your premise. So, you can discover how to use building plan examples and get inspired from viewing them. You can find a lot of office layout and floor plans templates in the ConceptDraw Solution Park.
This drawing shows the sample of interior design of a middle-size restaurant. It was designed with a help of ConceptDraw Cafe and Restaurant Plans solution. Extensive libraries of vector objects of the interior element enabled us to design this example quickly and with no efforts. You can use this interior plan as a template while designing an interior for your own restaurant. It will help you to compose and organize elements of the interior, to bring a balance between free space and furniture in your establishment. It can be applied to organize and arrange the furniture, equipment and decorative elements in the restaurant interior and achieve balance between furniture and free space.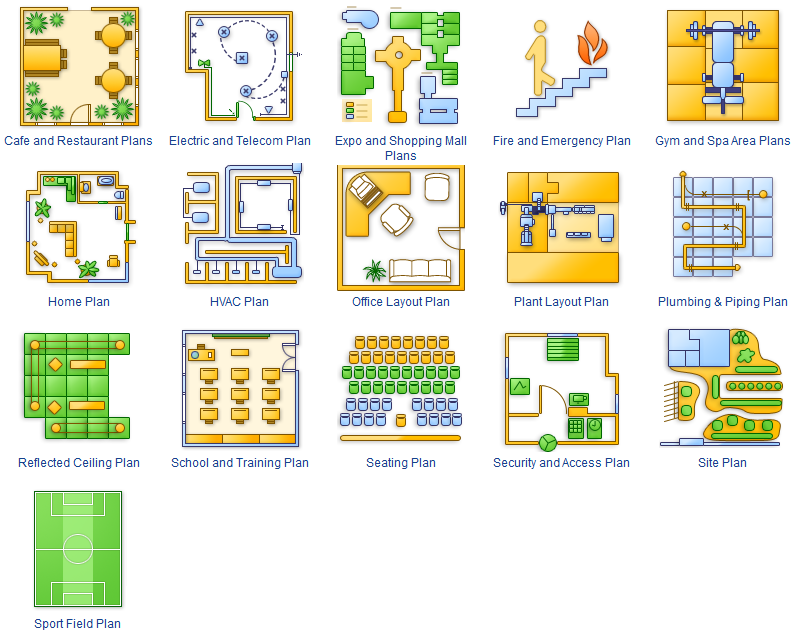
Picture: How To use Building Plan Examples
Related Solution:
The modern garden design is a full complex of works for design, decorating and gardening. Landscape design offers a large number of styles for the modern garden design, their origins go back centuries. But do not forget that the modern garden design is first of all an individual project for a specific landscape and specific owner of the land, and sometimes it is appropriate to apply the combination of styles.
ConceptDraw DIAGRAM diagramming and vector drawing software offers the unique Landscape & Garden Solution from the Building Plans area for effective development the modern garden design.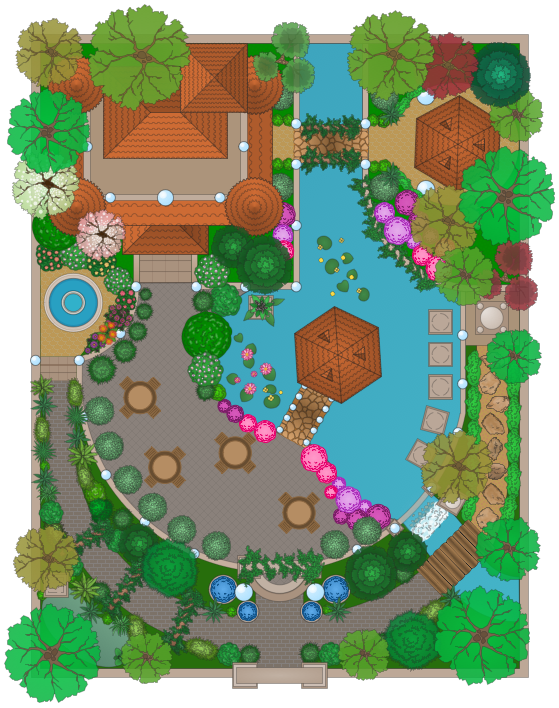
Picture: Modern Garden Design
Related Solution:
ConceptDraw DIAGRAM diagramming and vector drawing software extended with unique SCRUM Workflow solution from the Project Management area of ConceptDraw Solution Park allows fast and easy design professional-looking Scrum Workflow Diagrams and Scrum workflow scheme for projects required when working on projects and managing them, when developing software with cutting-edge Agile methodologies.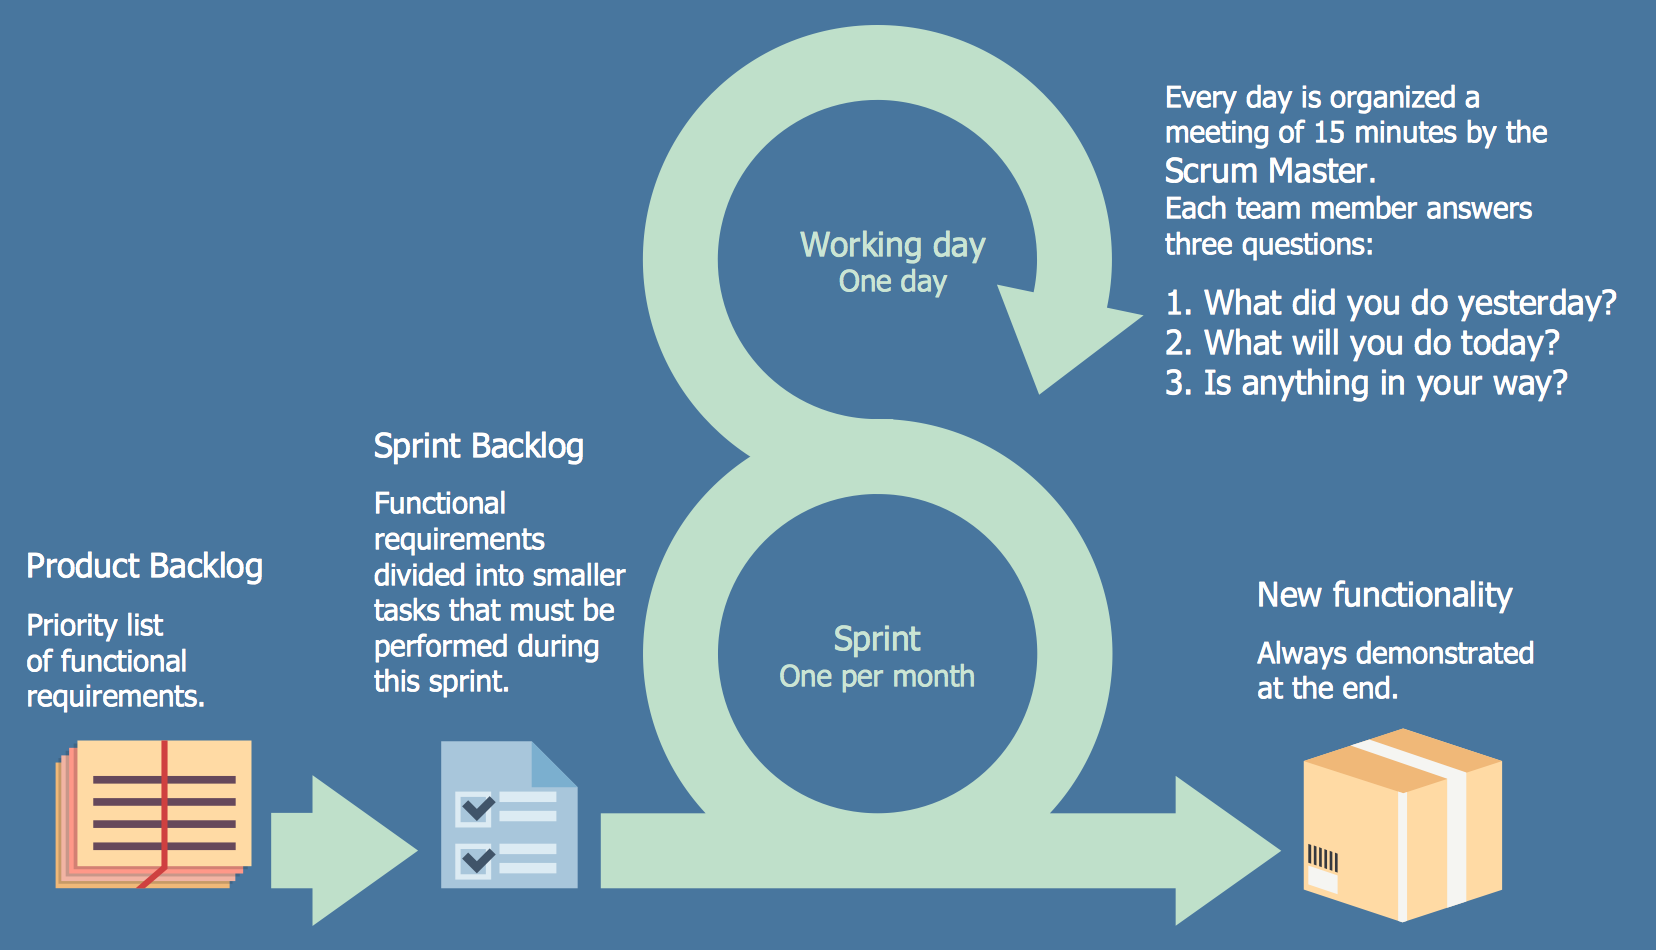
Picture: Scrum workflow
Related Solution:
Creating and organizing presentations, structuring received presentations, presenting mind maps, and preparing for public presenting.
Picture: How to Deliver Presentations using Mind Maps
Related Solution:
Once you have created your document in ConceptDraw DIAGRAM and you want to share it with your colleagues and friends, who uses MS Visio on their computers, you can easily export your document using ConceptDraw DIAGRAM export to Visio XML files (VDX) feature.
Now you can share your ConceptDraw documents with MS Visio users.
Picture: Export from ConceptDraw DIAGRAM Document to MS Visio® XML
Electrical Diagram is a visual graphical representation of an electrical circuit. ConceptDraw DIAGRAM diagramming and vector drawing software supplied with unique Electrical Engineering Solution from the Industrial Engineering Area will help you design Electrical Diagram of any complexity without efforts.
Picture: Electrical Diagram
Related Solution:
Electrical Engineering Solution used together with ConceptDraw DIAGRAM drawing facilities makes short a work of drawing various electrical and electronic circuit schemes. A library of vector objects composed from symbols of Analog and Digital Logic elements of electric circuit includes 40 symbolic images of logic gates, bistable switches of bi-stable electric current, circuit controllers, amplifiers, regulators, generators, etc. All of them can be applied in electronic circuit schemes for showing both analog and digital elements of the circuit.
Electrical Engineering Solution used together with ConceptDraw DIAGRAM drawing facilities makes short a work of drawing various electrical and electronic circuit schemes. A library of vector objects composed from symbols of Analog and Digital Logic elements of electric circuit includes 40 symbolic images of logic gates, bistable switches of bi-stable electric current, circuit controllers, amplifiers, regulators, generators, etc. All of them can be applied in electronic circuit schemes for showing both analog and digital elements of the circuit.
Picture:
Electrical Diagram Symbols F.A.Q.
How to Use Electrical ConceptDraw Diagram Software
Related Solution:
ConceptDraw Pyramid Diagram software allows drawing column charts using predesigned objects or drawing tools.
Picture: Pyramid Diagram
Related Solutions:
This sample was created in ConceptDraw DIAGRAM diagramming and vector drawing software using the UML Class Diagram library of the Rapid UML Solution from the Software Development area of ConceptDraw Solution Park.
This sample shows the structure of the building and can be used by building companies, real estate agencies, at the buying / selling of the realty.
Picture: UML Class Diagram Example - Buildings and Rooms
Related Solution:

