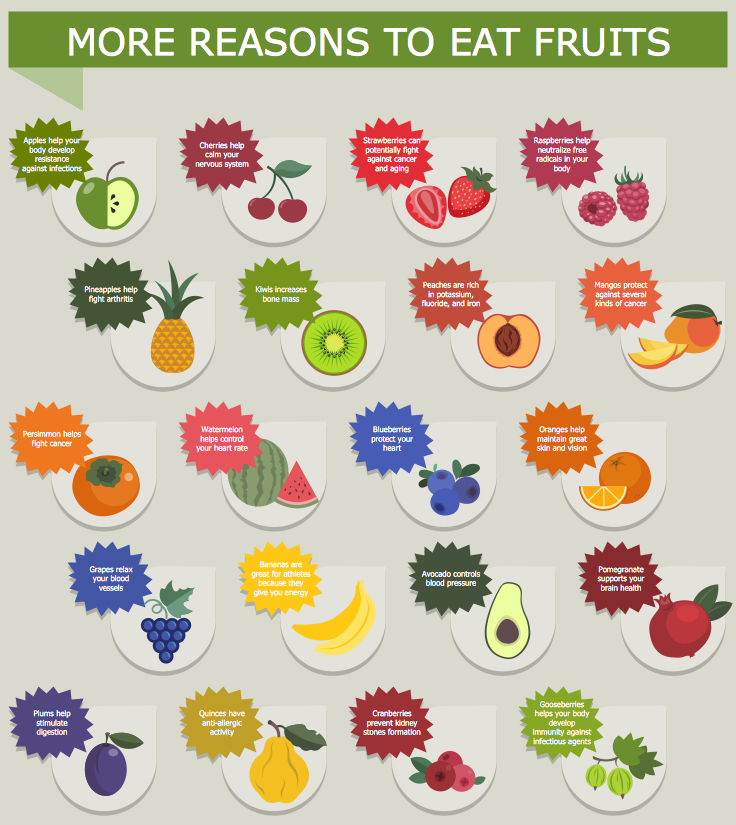
Example 1. Food Pictures - More Reasons to Eat Fruits
Various food pictures are also often used by dietitians and other experts in the field of nutrition. Food Court Solution offers 7 libraries with 201 vector objects of different fruits, vegetables, meat, fast foods, desserts, mixed drinks, and people for easy designing pictures of food and illustrating various nutrition charts and graphs.

Example 2. Food Court Solution in ConceptDraw STORE
Food Court Solution offers also large collection of pictorial food and beverage images, food related illustrations, food pictures, etc. All they are represented in ConceptDraw STORE.

Example 3. Food Pictures - Reducing Sodium
The food pictures you see on this page were created in ConceptDraw DIAGRAM software using the Food Court Solution for ConceptDraw Solution Park. An experienced user spent 15 minutes creating each of these samples.
Use the tools of Food Court Solution for drawing your own illustrations of any complexity quick, easy and effective, and then successfully use them for developing your business.
All source documents are vector graphic documents. They are available for reviewing, modifying, or converting to a variety of formats (PDF file, MS PowerPoint, MS Visio, and many other graphic formats) from the ConceptDraw STORE. The Food Court Solution is available for all ConceptDraw DIAGRAM users.
TEN RELATED HOW TO's:
ConceptDraw DIAGRAM is a powerful electrical design software. The Electrical Engineering solution from the Engineering area of ConceptDraw Solution Park allows you easy, quick and effective draw the professional looking electrical, circuit and wiring diagrams and schemes, maintenance and repair diagrams for electronics and electrical engineering, and many other types of diagrams.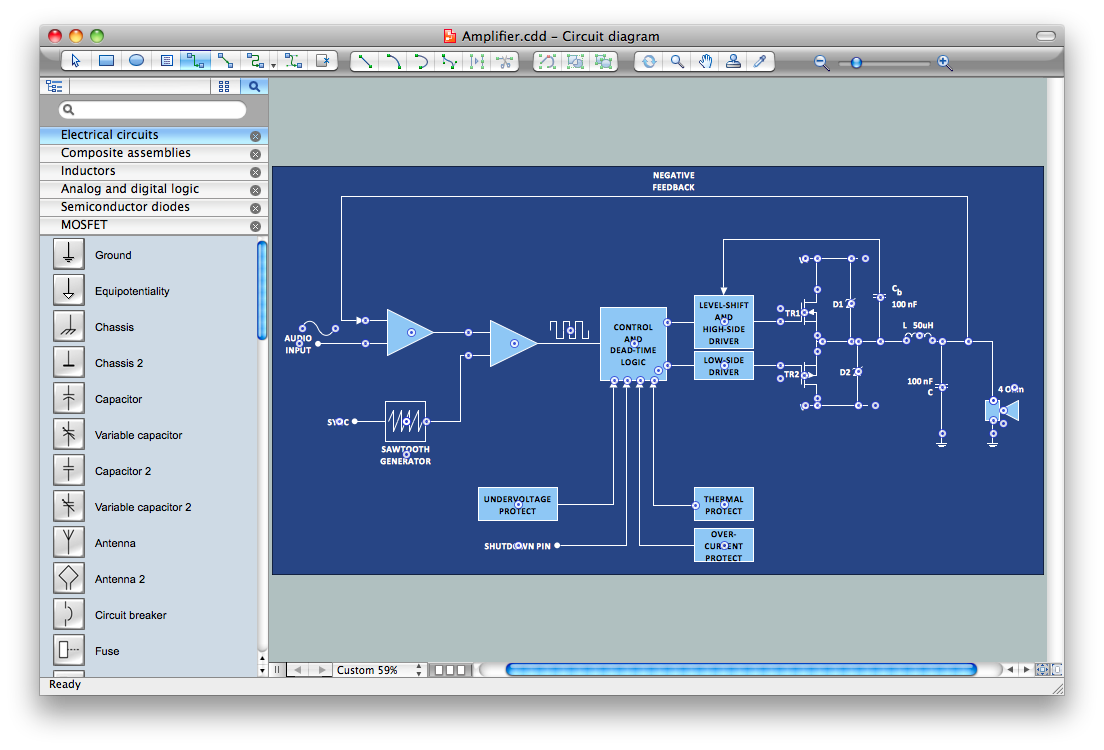
Picture: Electrical Design Software
Related Solution:
Do you like infographics and data visualization? Creating infographics is super-easy with ConceptDraw.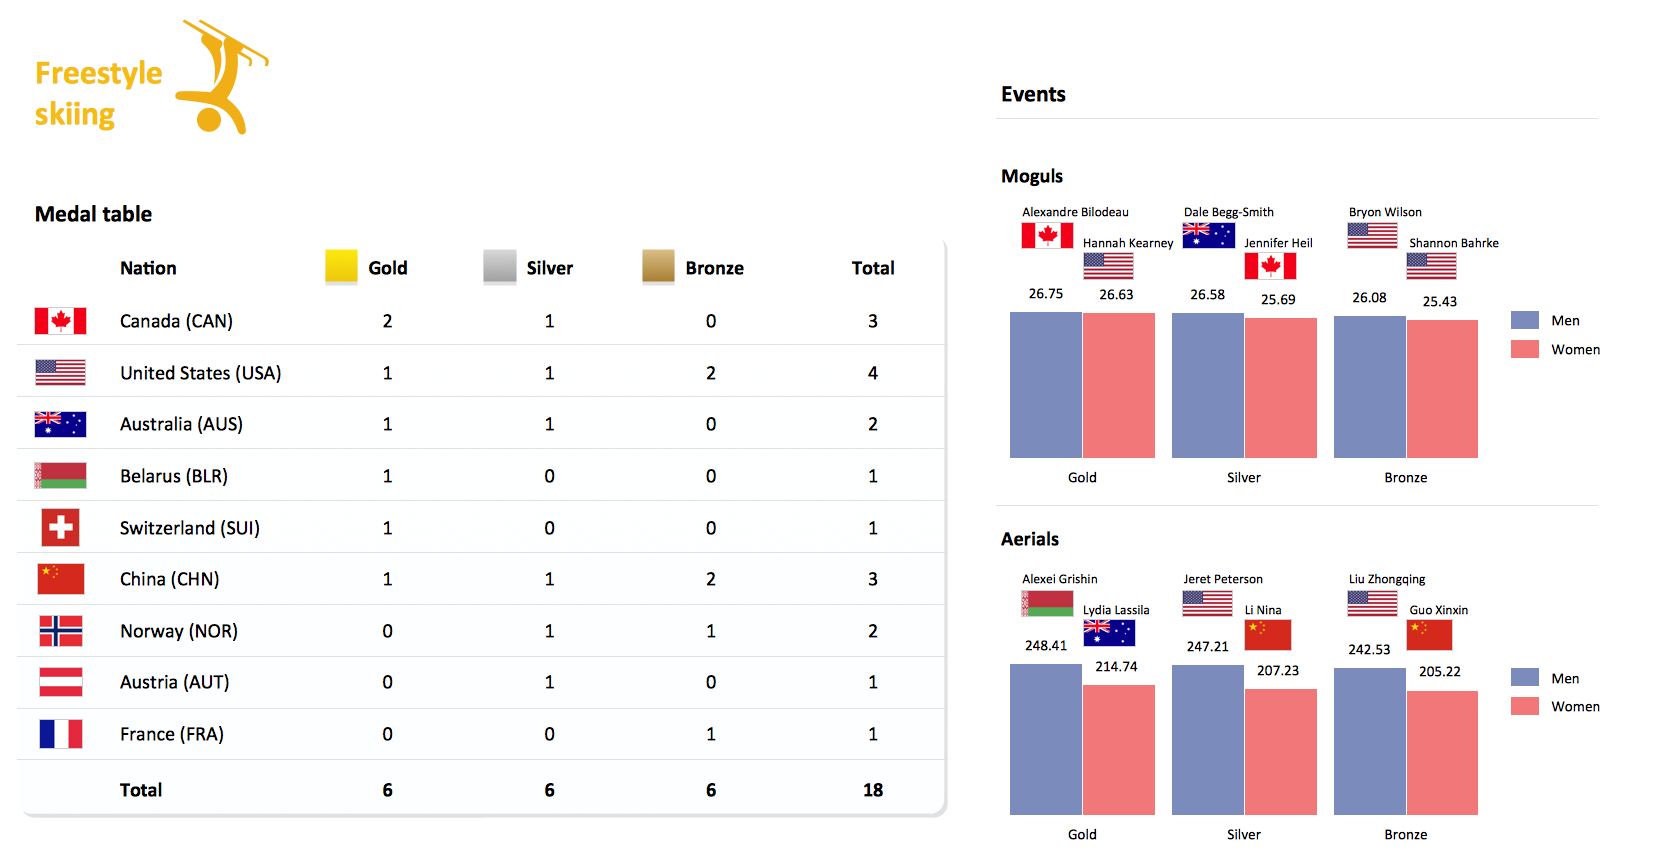
Picture: Winter Sports. Olympic Games Illustrations. Medal Summary
Related Solution:
The first thing that your clients will see, is your restaurant's interior. It doesn’t matter, whether you own a Michelin-starred restaurant or a lunch counter, you will need a restaurant floor plan that will reflect every detail of the establishment’s interior. It is the second most important thing after the menu. Restaurant essentials include kitchen area, dining area, restrooms, bar area, staff quarters.
Designing a layout of cafe and restaurant floor plan is a real art. It should be beautiful restaurant seating plan which convenient for visitors. Restaurant essentials include kitchen area, dining area, restrooms, bar area, staff quarters. Being planned wisely a layout of restaurant floor plan and restaurant seating chart (cafe floor plan or bar) guides to prosperous sales and good profit. Making a restaurant floor plan or restaurant seating chart involves many different elements that can be managed using ConceptDraw Cafe and Restaurant Floor Plan solution. Cafe and Restaurant library delivers a number of vector graphic objects for depicting various layouts of any style and design establishments. ConceptDraw DIAGRAM is great and simple restaurant floor plan software with thousands features.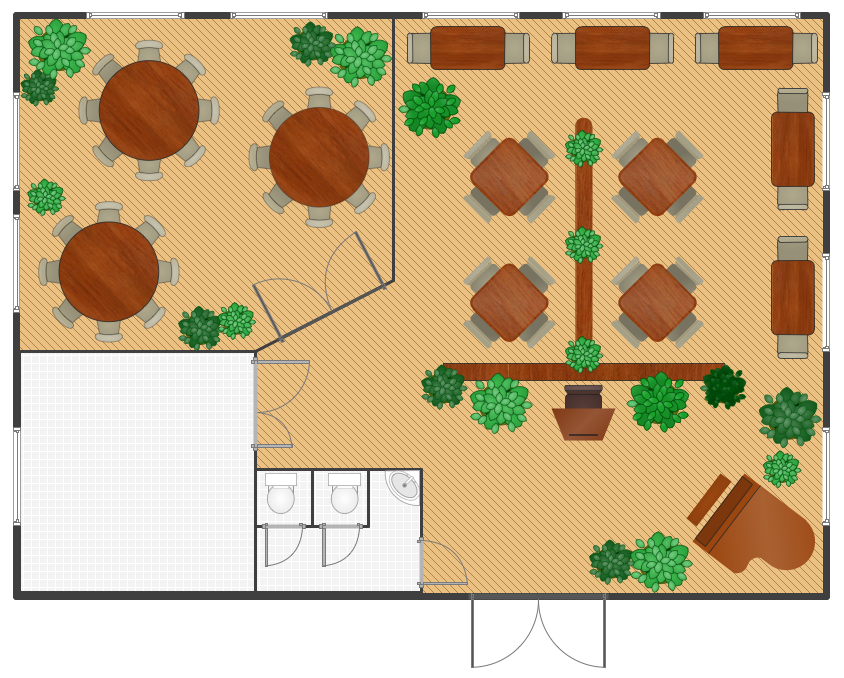
Picture: Restaurant Floor Plan
Related Solution:
But it never matters which hotel plan you want to illustrate in a way of a floor plan, you can always do it with ConceptDraw DIAGRAM especially it can be simple to do having the “Floor Plans” solution, which can be downloaded from the Building Plans area of ConceptDraw Solution Park.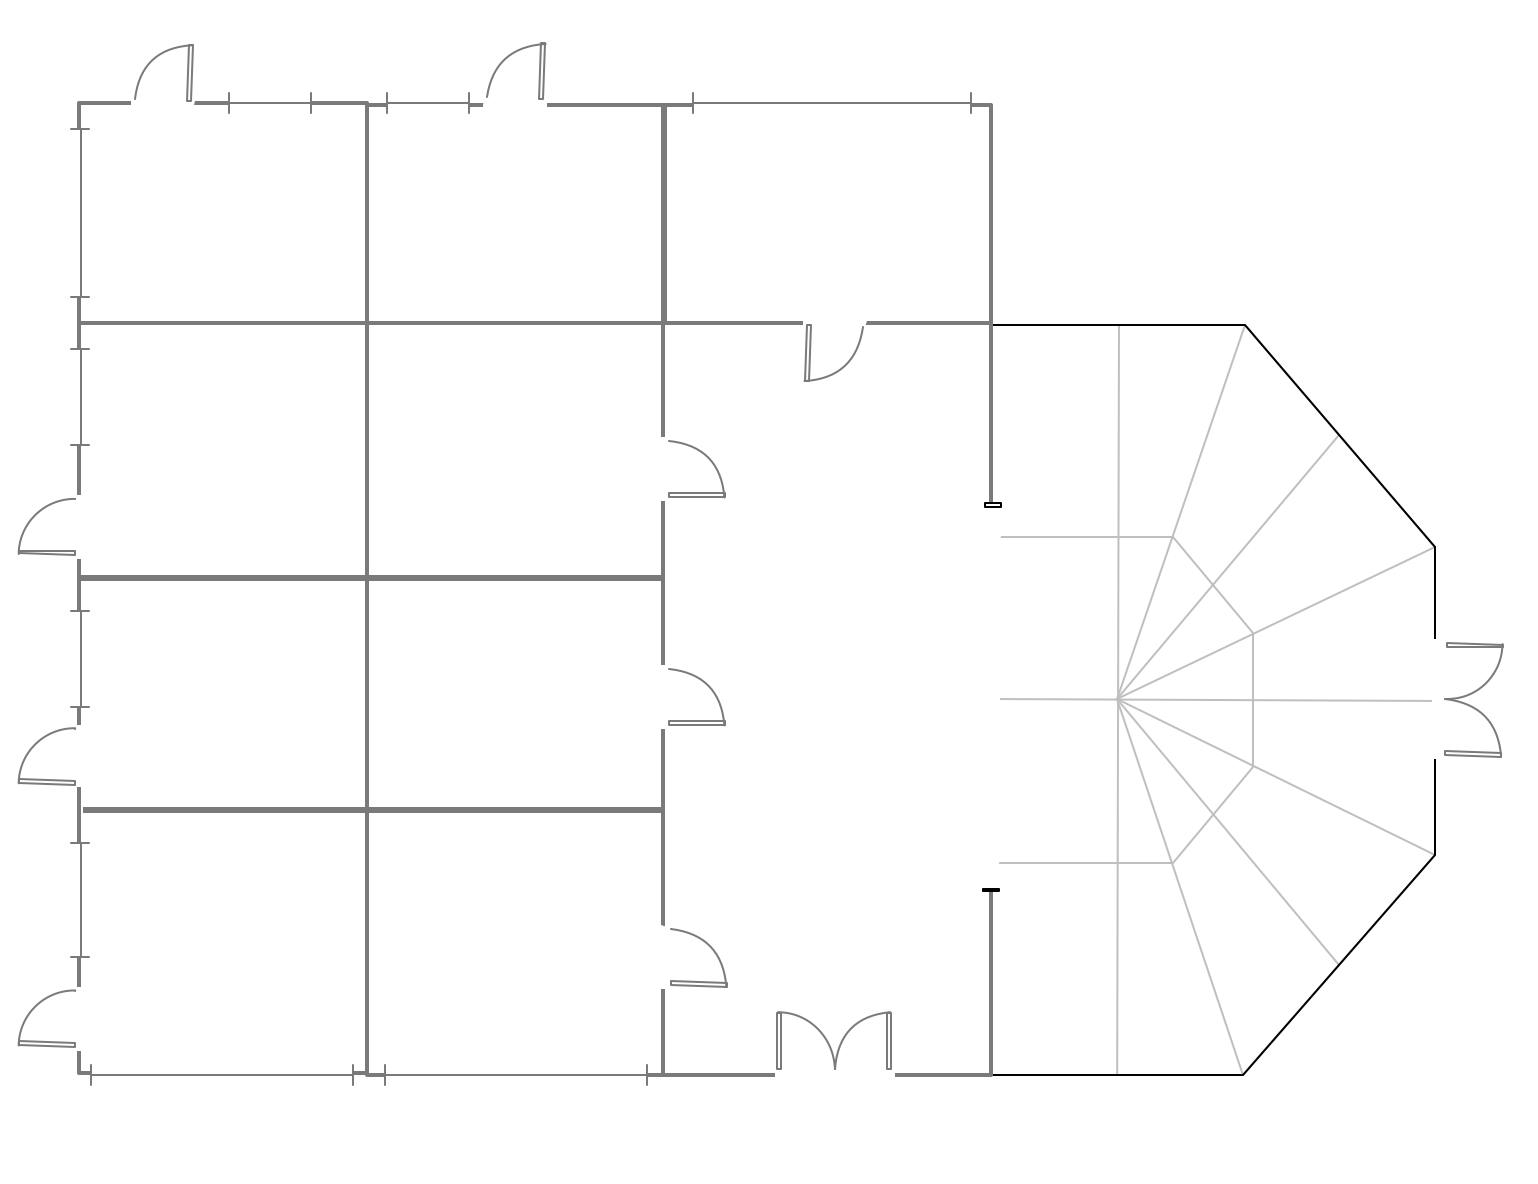
Picture: Mini Hotel Floor Plan. Floor Plan Examples
Related Solution:
In electronics, a logic gate is an idealized or physical device implementing a Boolean function; that is, it performs a logical operation on one or more logical inputs, and produces a single logical output. Depending on the context, the term may refer to an ideal logic gate, one that has for instance zero rise time and unlimited fan-out, or it may refer to a non-ideal physical device
26 libraries of the Electrical Engineering Solution of ConceptDraw DIAGRAM make your electrical diagramming simple, efficient, and effective. You can simply and quickly drop the ready-to-use objects from libraries into your document to create the electrical diagram.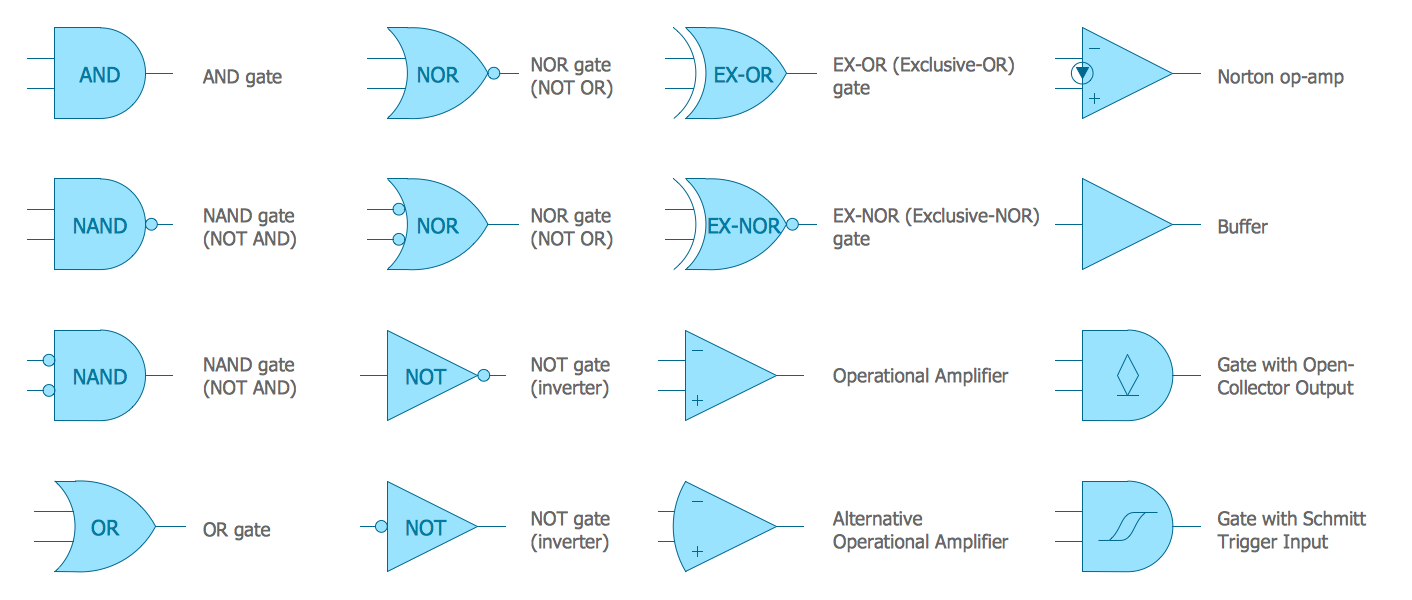
Picture: Electrical Symbols — Logic Gate Diagram
Related Solution:
Use Task Board to visualize the Scrum-ban Task Board as a mind map.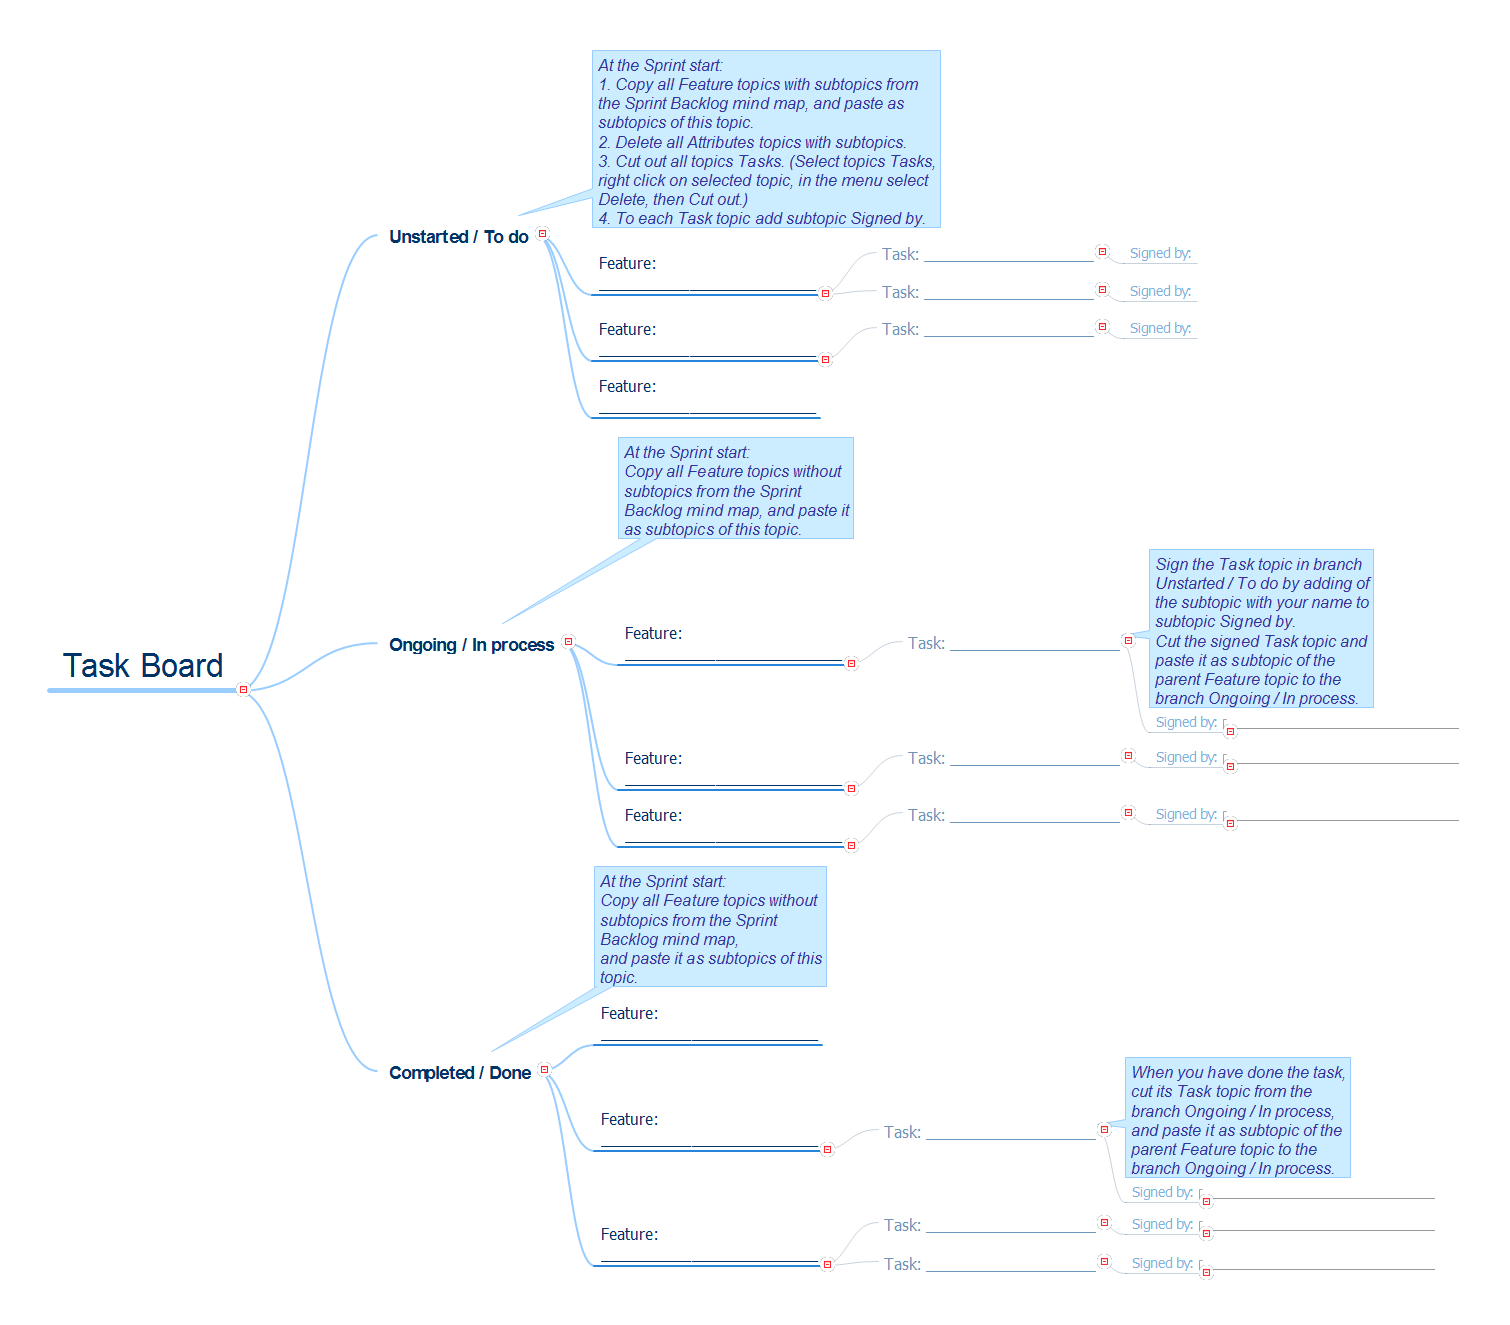
Picture: Task Board
Related Solution:
The AWS Architecture Diagrams solution includes icons, sample and templates for several Amazon Web Services products and resources, to be used when creating architecture diagrams. The icons are designed to be simple so that you can easily incorporate them in your diagrams and put them in your whitepapers, presentations, datasheets, posters or any technical material you like.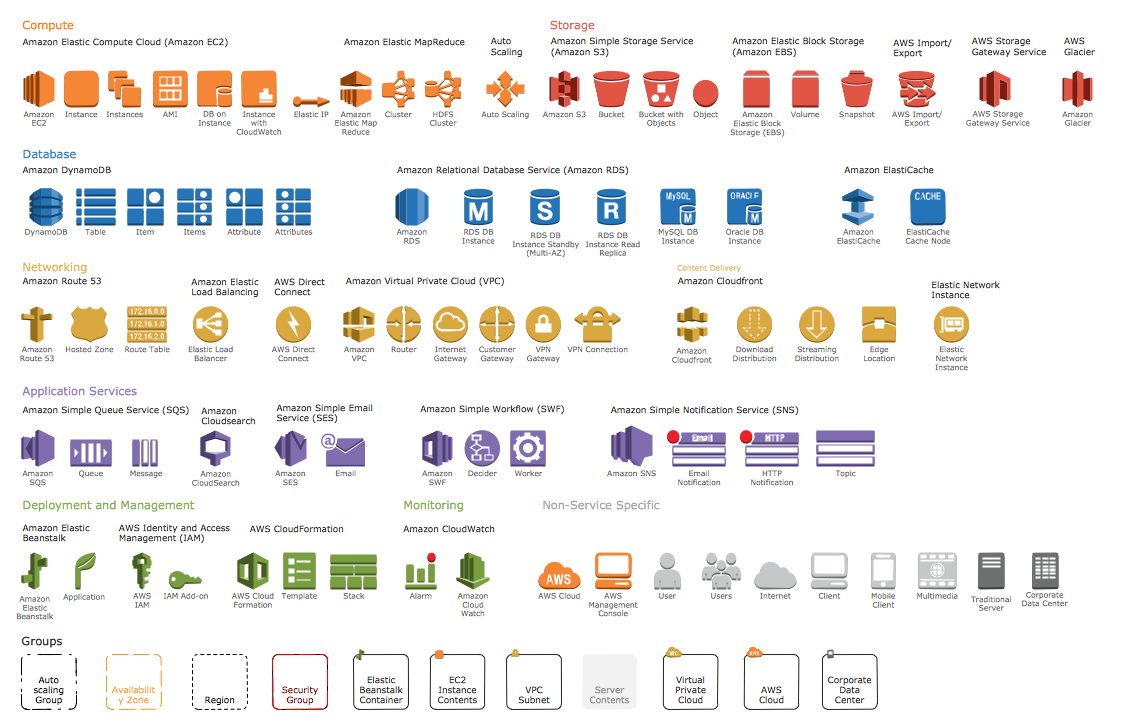
Picture: AWS Simple Icons for Architecture Diagrams
Presentation tools. A convenient tool to present documents via Skype. Share your desktop, collaborate on documents in real-time and run a web conference one-on-one or one-to-many.
A tool for sharing and presenting business documents via Skype. Allows to present Microsoft® Word®, Microsoft PowerPoint®, Microsoft Project® and plenty mindmapping formats.
Picture: Presenting Documents with Skype
Related Solution:
ConceptDraw DIAGRAM is a powerful business and technical diagramming software tool that enables you to design professional-looking graphics, diagrams, flowcharts, floor plans and much more in just minutes. Maintain business processes performance with clear visual documentation. Effectively present and communicate information in a clear and concise manner with ConceptDraw DIAGRAM.
Picture: ConceptDraw DIAGRAM
Visio for Mac and Windows - ConceptDraw as an alternative to MS Visio. ConceptDraw DIAGRAM delivers full-functioned alternative to MS Visio. ConceptDraw DIAGRAM supports import of Visio files. ConceptDraw DIAGRAM supports flowcharting, swimlane, orgchart, project chart, mind map, decision tree, cause and effect, charts and graphs, and many other diagram types.
Picture: Is ConceptDraw DIAGRAM an Alternative to Microsoft Visio?

