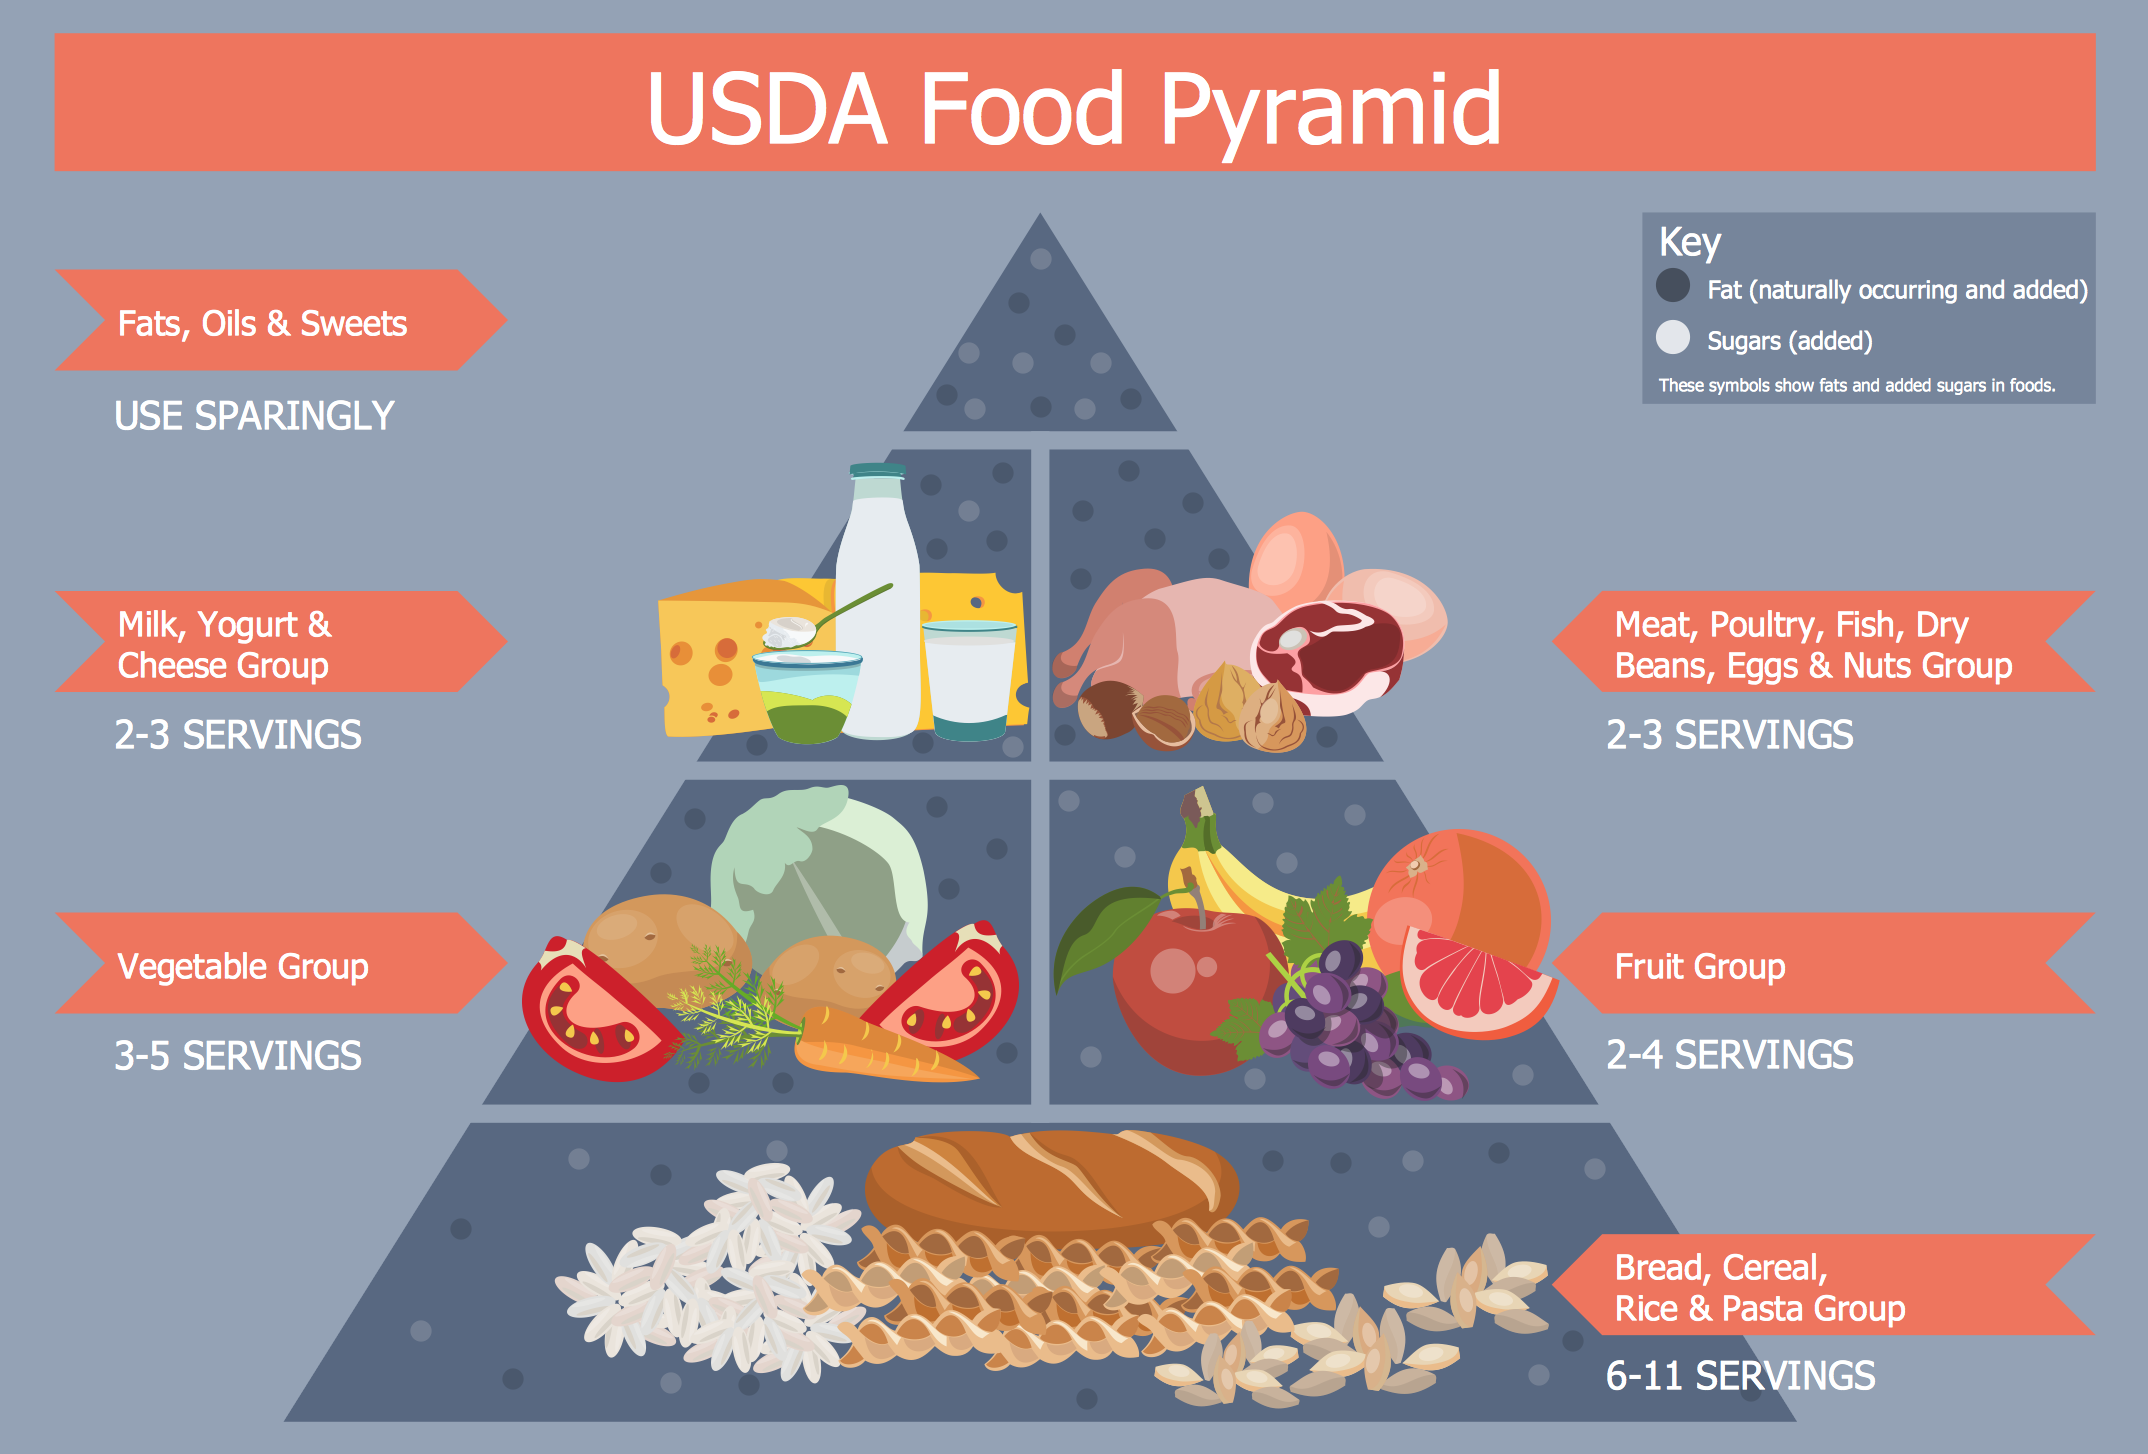
Example 1. Healthy Diet Plan - USDA Food Pyramid
The main task in composing a healthy diet plan is not only make it rational and balanced, but also display and present it appetizing and desirable for implementation. Health Food Solution greatly facilitates drawing process thanks to the 8 libraries with 238 ready-to-use vector objects:
- Confections
- Dairy
- Fish and Seafood
- Fruits and Berries
- Grains, Beans, Legumes, Nuts
- Health Beverages
- Meat and Eggs
- Vegetables and Herbs

Example 2. Fat Food
Health Food Solution offers also inexhaustible source of inspiration - large collection of health meal samples and healthy diet plan examples. All they are represented in ConceptDraw STORE, you can open any of them and change something as needed, and thus get already new food illustration.

Example 3. Healthy Diet Plan - Vitamins
The samples you see on this page were created in ConceptDraw DIAGRAM software using the Health Food Solution. These examples successfully demonstrate solution's capabilities and professional results you can achieve. An experienced user spent 10-15 minutes creating each of these healthy foods samples.
Use the objects from the Health Food Solution libraries to colorfully illustrate your healthy diet plan and create attractive healthy foods images fast and easy.
All source documents are vector graphic documents. They are available for reviewing, modifying, or converting to a variety of formats (PDF file, MS PowerPoint, MS Visio, and many other graphic formats) from the ConceptDraw STORE. The Health Food Solution is available for all ConceptDraw DIAGRAM users.
TEN RELATED HOW TO's:
If you are just a beginner in drawing flowcharts, it may seem that a sheet of paper and a pen are just enough. However, at the time you would want to share your results, diagramming applications would suite you better. it’s very easy to create diagrams that way and to discover new kinds of flowcharts.
The huge collection of sample ConceptDraw diagrams, charts, illustrations and other types of business drawings includes a wide range of business themes. A huge number of graphic images of ConceptDraw documents is divides on business application areas according to business-oriented solutions for which they were made.Here is a short visual list of samples of flowcharts, process diagrams, UML models, management charts, computer network diagrams, maps, infographics, illustrations, etc. In short, each ConceptDraw solution is accompanied with at least ten samples representing some particular examples of the application of the given chart.
Picture: Applications
Architectural drawing allows to show the location of a building or ensemble of buildings on the ground, indicating the cardinal points. For centuries, people had been studying architecture in universities to learn how to draw building plans and now everyone can do it easily just using appropriate software. While developing the building plan, its graphic part, you can display the part of the floor or the entire floor of a building with an indication of the exact location of the drawn premise.
Small-sized apartments does not restrict the advanced interior design opportunities. Here is a detailed and precise floor plan of a pretty small apartment. A furniture objects are added to show possible interior of this home. This plan can be used to help somebody with a floor layout and furniture arrangement. Having this floor plan in a pocket while shopping would be useful to check if there is enough rooms for a new furniture.
Picture: How To Draw Building Plans
Related Solution:
The activity of any organization is more or less branchy network of processes. The description of these processes is a hard technical task which requires definite methodology and standards.
According to the IDEF0 standard any process can be described in the form of a block (Activity Box) which has inputs and outputs. The process consists in transformation of inputs into outputs under the influence of the management and in the presence of necessary resources. Outputs of the given process later on can be either inputs for the next process or resources, or management means.
Picture: IDEF0 standard with ConceptDraw DIAGRAM
Related Solution:
The Flowchart is a very popular type of diagram, it is widely used for analyzing, designing, managing and visualizing the business and technical processes, various software algorithms. But how to create Flowchart quick and easy?
Flowcharts solution from the Diagrams area of ConceptDraw Solution Park helps you to design the professional looking Flowchart Diagrams quick and easy using the ConceptDraw DIAGRAM diagramming and vector drawing software.
Picture: Create Flowchart - Making a Flowchart
Related Solution:
Swimlanes are a visual mechanism of organizing and categorizing activities, in BPMN consist of two types: Pool, Lane. Use ConceptDraw Swimlanes library with 20 objects from BPMN.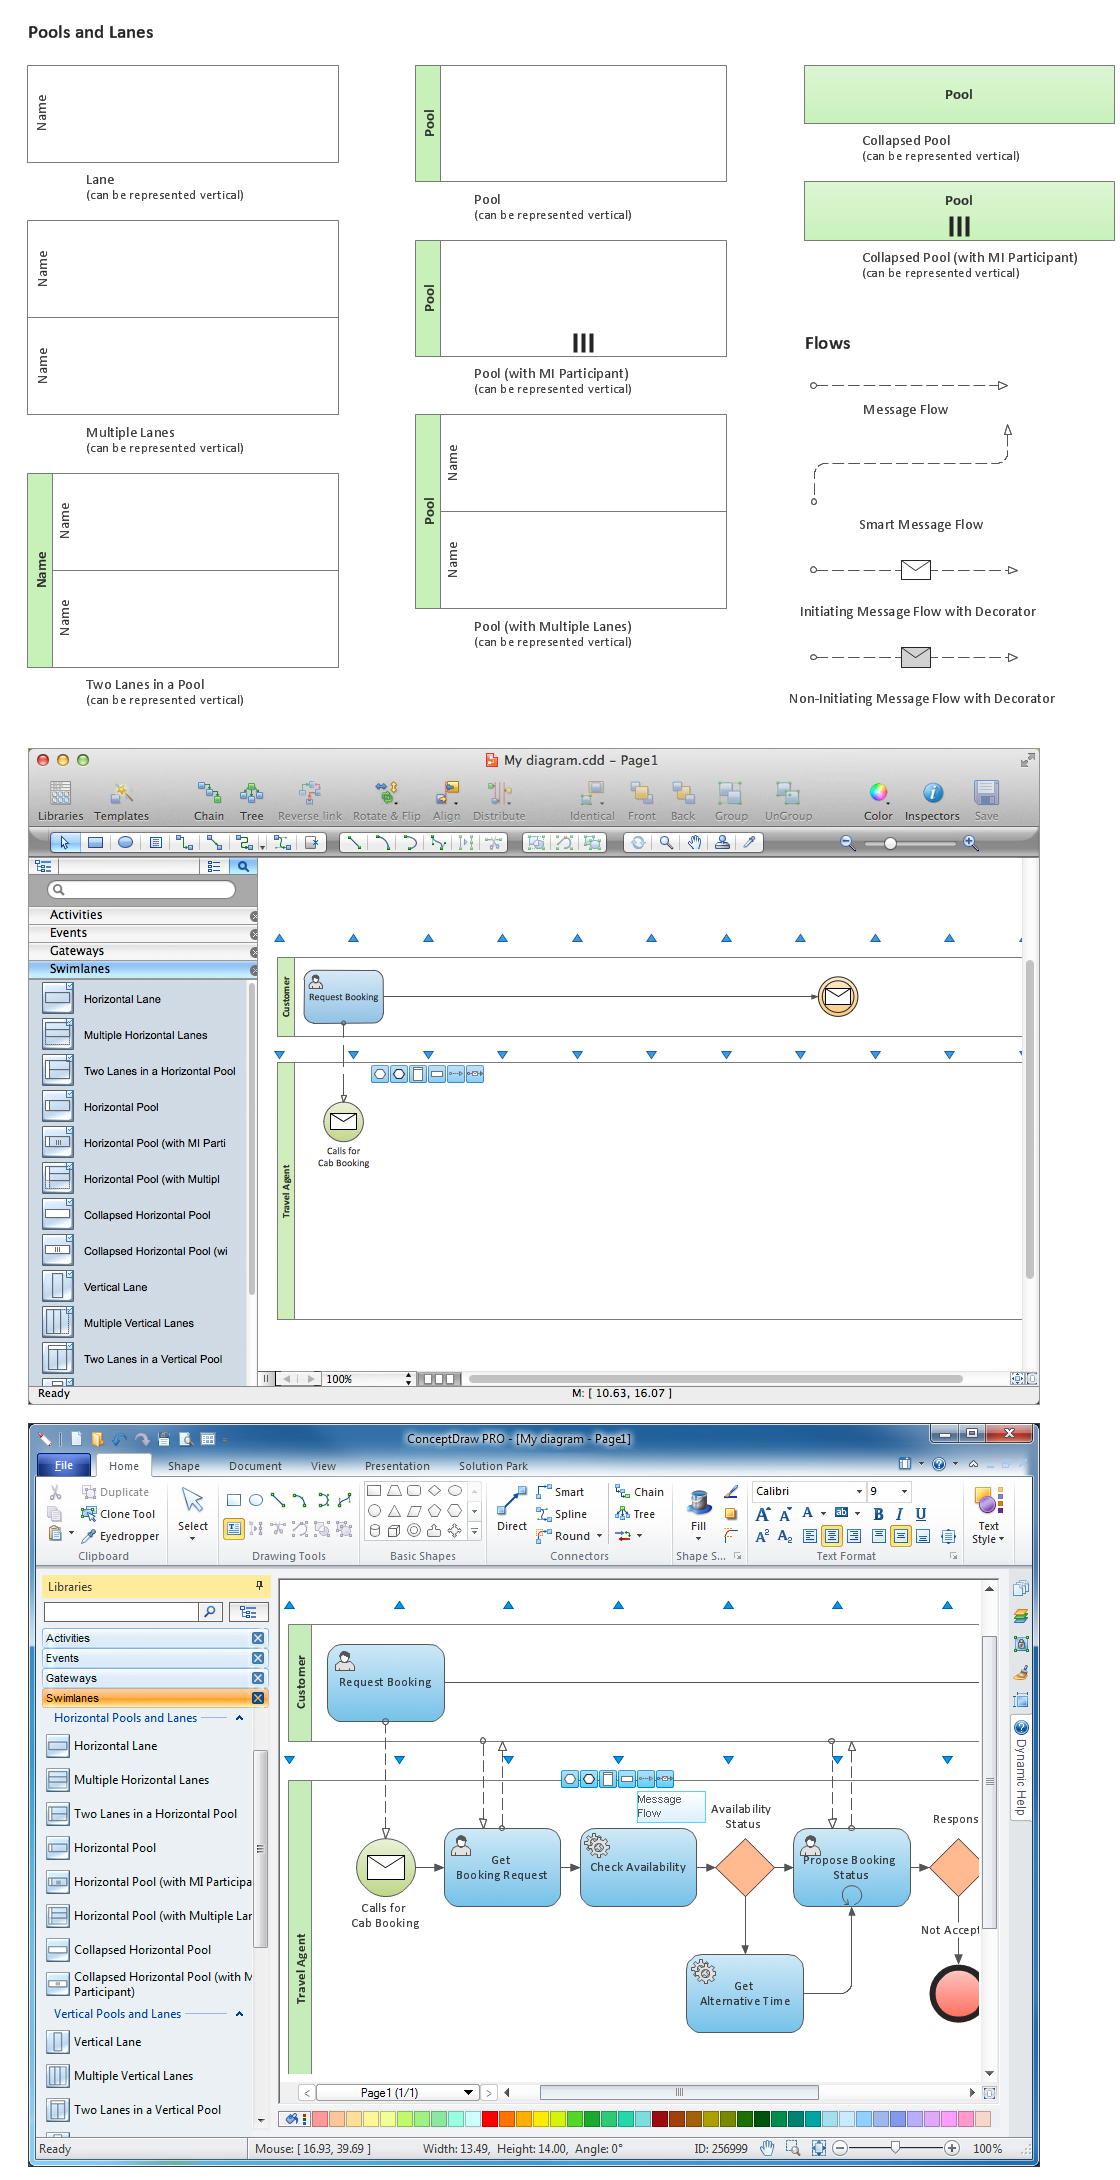
Picture: Diagramming Software for Design Business Process Diagrams
How to draw pictorial chart quick, easy and effective? ConceptDraw DIAGRAM offers the unique Pictorial Infographics Solution that will help you!
Pictorial Infographics solution contains large number of libraries with variety of predesigned vector pictograms that allows you design infographics in minutes. There are available 10 libraries with 197 vector pictograms.
Picture: How to Draw Pictorial Chart. How to Use Infograms
Related Solution:
For depicting the onion model are actively used Stakeholder Onion Diagrams. The ConceptDraw DIAGRAM diagramming and vector drawing software extended with Stakeholder Onion Diagrams Solution from the Management Area of ConceptDraw Solution Park offers the number of useful tools and Stakeholder Onion Diagram template for their easy design.
Picture: Stakeholder Onion Diagram Template
Related Solution:
Chemical and Process Engineering solution contains variety predesigned process flow diagram elements relating to instrumentation, containers, piping and distribution necessary for chemical engineering, and can be used to map out chemical processes or easy creating various Chemical and Process Flow Diagrams in ConceptDraw DIAGRAM.
Picture: Process Flow Diagram Symbols
Related Solution:
This sample shows the Perceptual map. It was created in ConceptDraw DIAGRAM diagramming and vector drawing software using the Matrices Solution from the Marketing area of ConceptDraw Solution Park.
Perception Mapping helps organizations measure and transform all aspects of their business, people and culture. Perception Mapping allows to represent the complex relationships graphically, helps identify potential problems of the organization and make the best decisions.
Picture: Business Tools Perceptual Mapping
Related Solution:
Decision Making - ConceptDraw OFFICE suite provides visual tools that are given support on the stage of the decision making.
The Seven Management and Planning Tools is a set for such diagrams: Affinity Diagram, Relations Diagram, Prioritization Matrix, Root Cause Tree Diagram, Involvement Matrix, PERT Chart, Risk Diagram (PDPC).
Picture: Decision Making

