
Example 1. Food Images - Outdoor Party Food Court Area
Food Court Solution contains large collection of predesigned examples and samples, and
7 libraries:
- Beverages
- Cafe People
- Dessert
- Fast Food
- Fruits
- Meat
- Vegetables
These libraries contain 201 professionally developed vector objects of various vegetables and fruits, meat and fast foods, drinks and desserts, etc.

Example 2. Food Images - Smoothies
Objects and clipart from the libraries of Food Court solution will help you represent any idea, easy design food images which you want and imagine, and of any complexity. Don't afraid to use bright colors and colorful backgrounds, they make your food pictures successful.

Example 3. Food Images - Easy Breakfast
The food images you see on this page were created in ConceptDraw DIAGRAM software using the Food Court Solution. They successfully demonstrate solution's capabilities and professional results you can achieve. An experienced user spent 10-15 minutes creating each of these samples.
Use the tools of Food Court Solution for ConceptDraw Solution Park to design your own attractive F&B images fast, easy and effective.
All source documents are vector graphic documents. They are available for reviewing, modifying, or converting to a variety of formats (PDF file, MS PowerPoint, MS Visio, and many other graphic formats) from the ConceptDraw STORE. The Food Court Solution is available for all ConceptDraw DIAGRAM users.
TEN RELATED HOW TO's:
One of the key roles at the attracting visitors in catering establishments of different formats plays their visual solution, design of advertising elements of fast foods and restaurants.
ConceptDraw DIAGRAM software enhanced with unique Food Court solution from the Food and Beverage area of ConceptDraw Solution Park allows to design inviting and attractive signboards, pictorial menus with appetizing food pictures.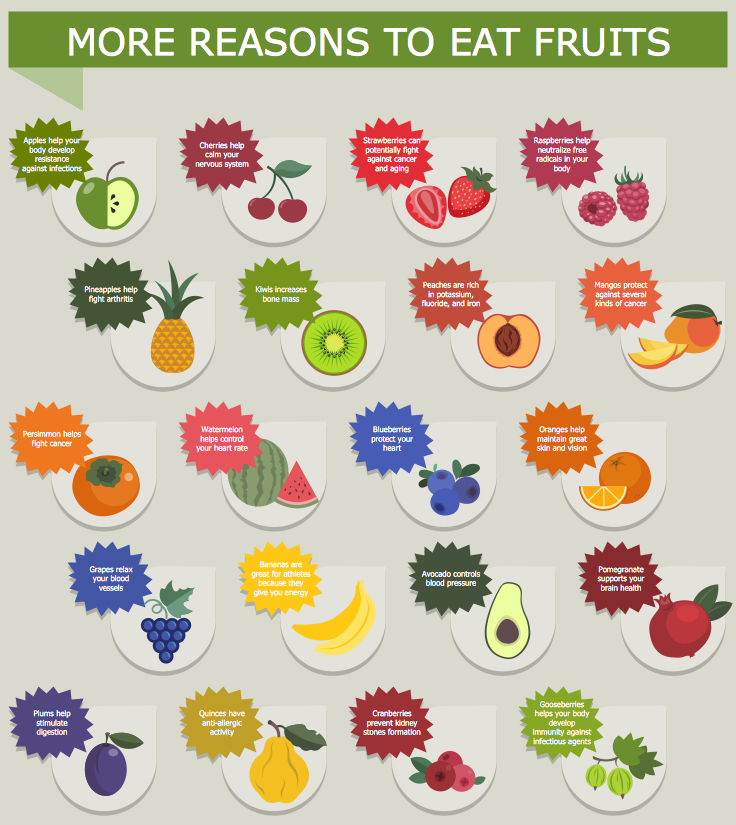
Picture: Food Pictures
Related Solution:
The Education Infographics are popular and effectively applied in the educational process. Now you don't need to be an artist to design colorful pictorial education infographics thanks to the unique drawing tools of Education Infographics Solution for ConceptDraw DIAGRAM diagramming and vector drawing software.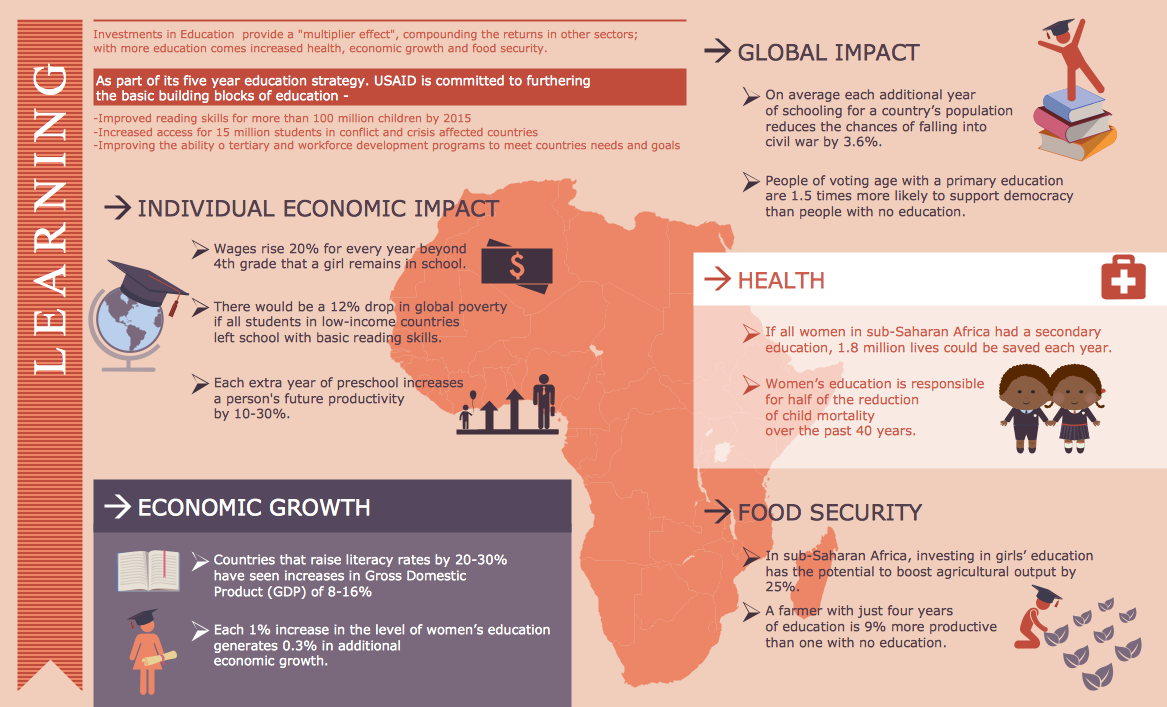
Picture: Education Infographics
Related Solution:
Use of various charts, diagrams and infographics is the most effective way of visual presenting information about healthy foods, healthy eating and healthy diet. ConceptDraw DIAGRAM diagramming and vector drawing software offers the Health Food solution from the Food and Beverage area of ConceptDraw Solution Park which is overfull of powerful drawing tools, libraries with ready-to-use vector objects and clipart, predesigned samples and examples which will help you easy design healthy foods illustrations.
Picture: Healthy Foods
Related Solution:
The power, economy, and versatility of ConceptDraw MINDMAP takes personnel and team productivity to another level. Discover today what this means to you.
Picture: Mind Map Making Software
Related Solution:
There are a lot of tutorials that get you familiar with emergency situations. If you want to know how to create emergency plans and fire evacuation schemes then you must be concerned about safety. There is a list of rules that you should follow to set the fire safety equipment properly.
Discover this precise and accurate fire emergency evacuation plan. This sample drawing demonstrate facilities of ConceptDraw DIAGRAM together with its Fire and Emergency Plans solution. The evacuation plan is designed to provide employees and visitors with a map depicting the ways they may use to escape the building in emergency situations. The telephone sets, first aid boxes and extinguisher are also marked on this plan. The evacuation plan should contain a legend for readers. The similar plans are commonly hang on the wall on the building's floors.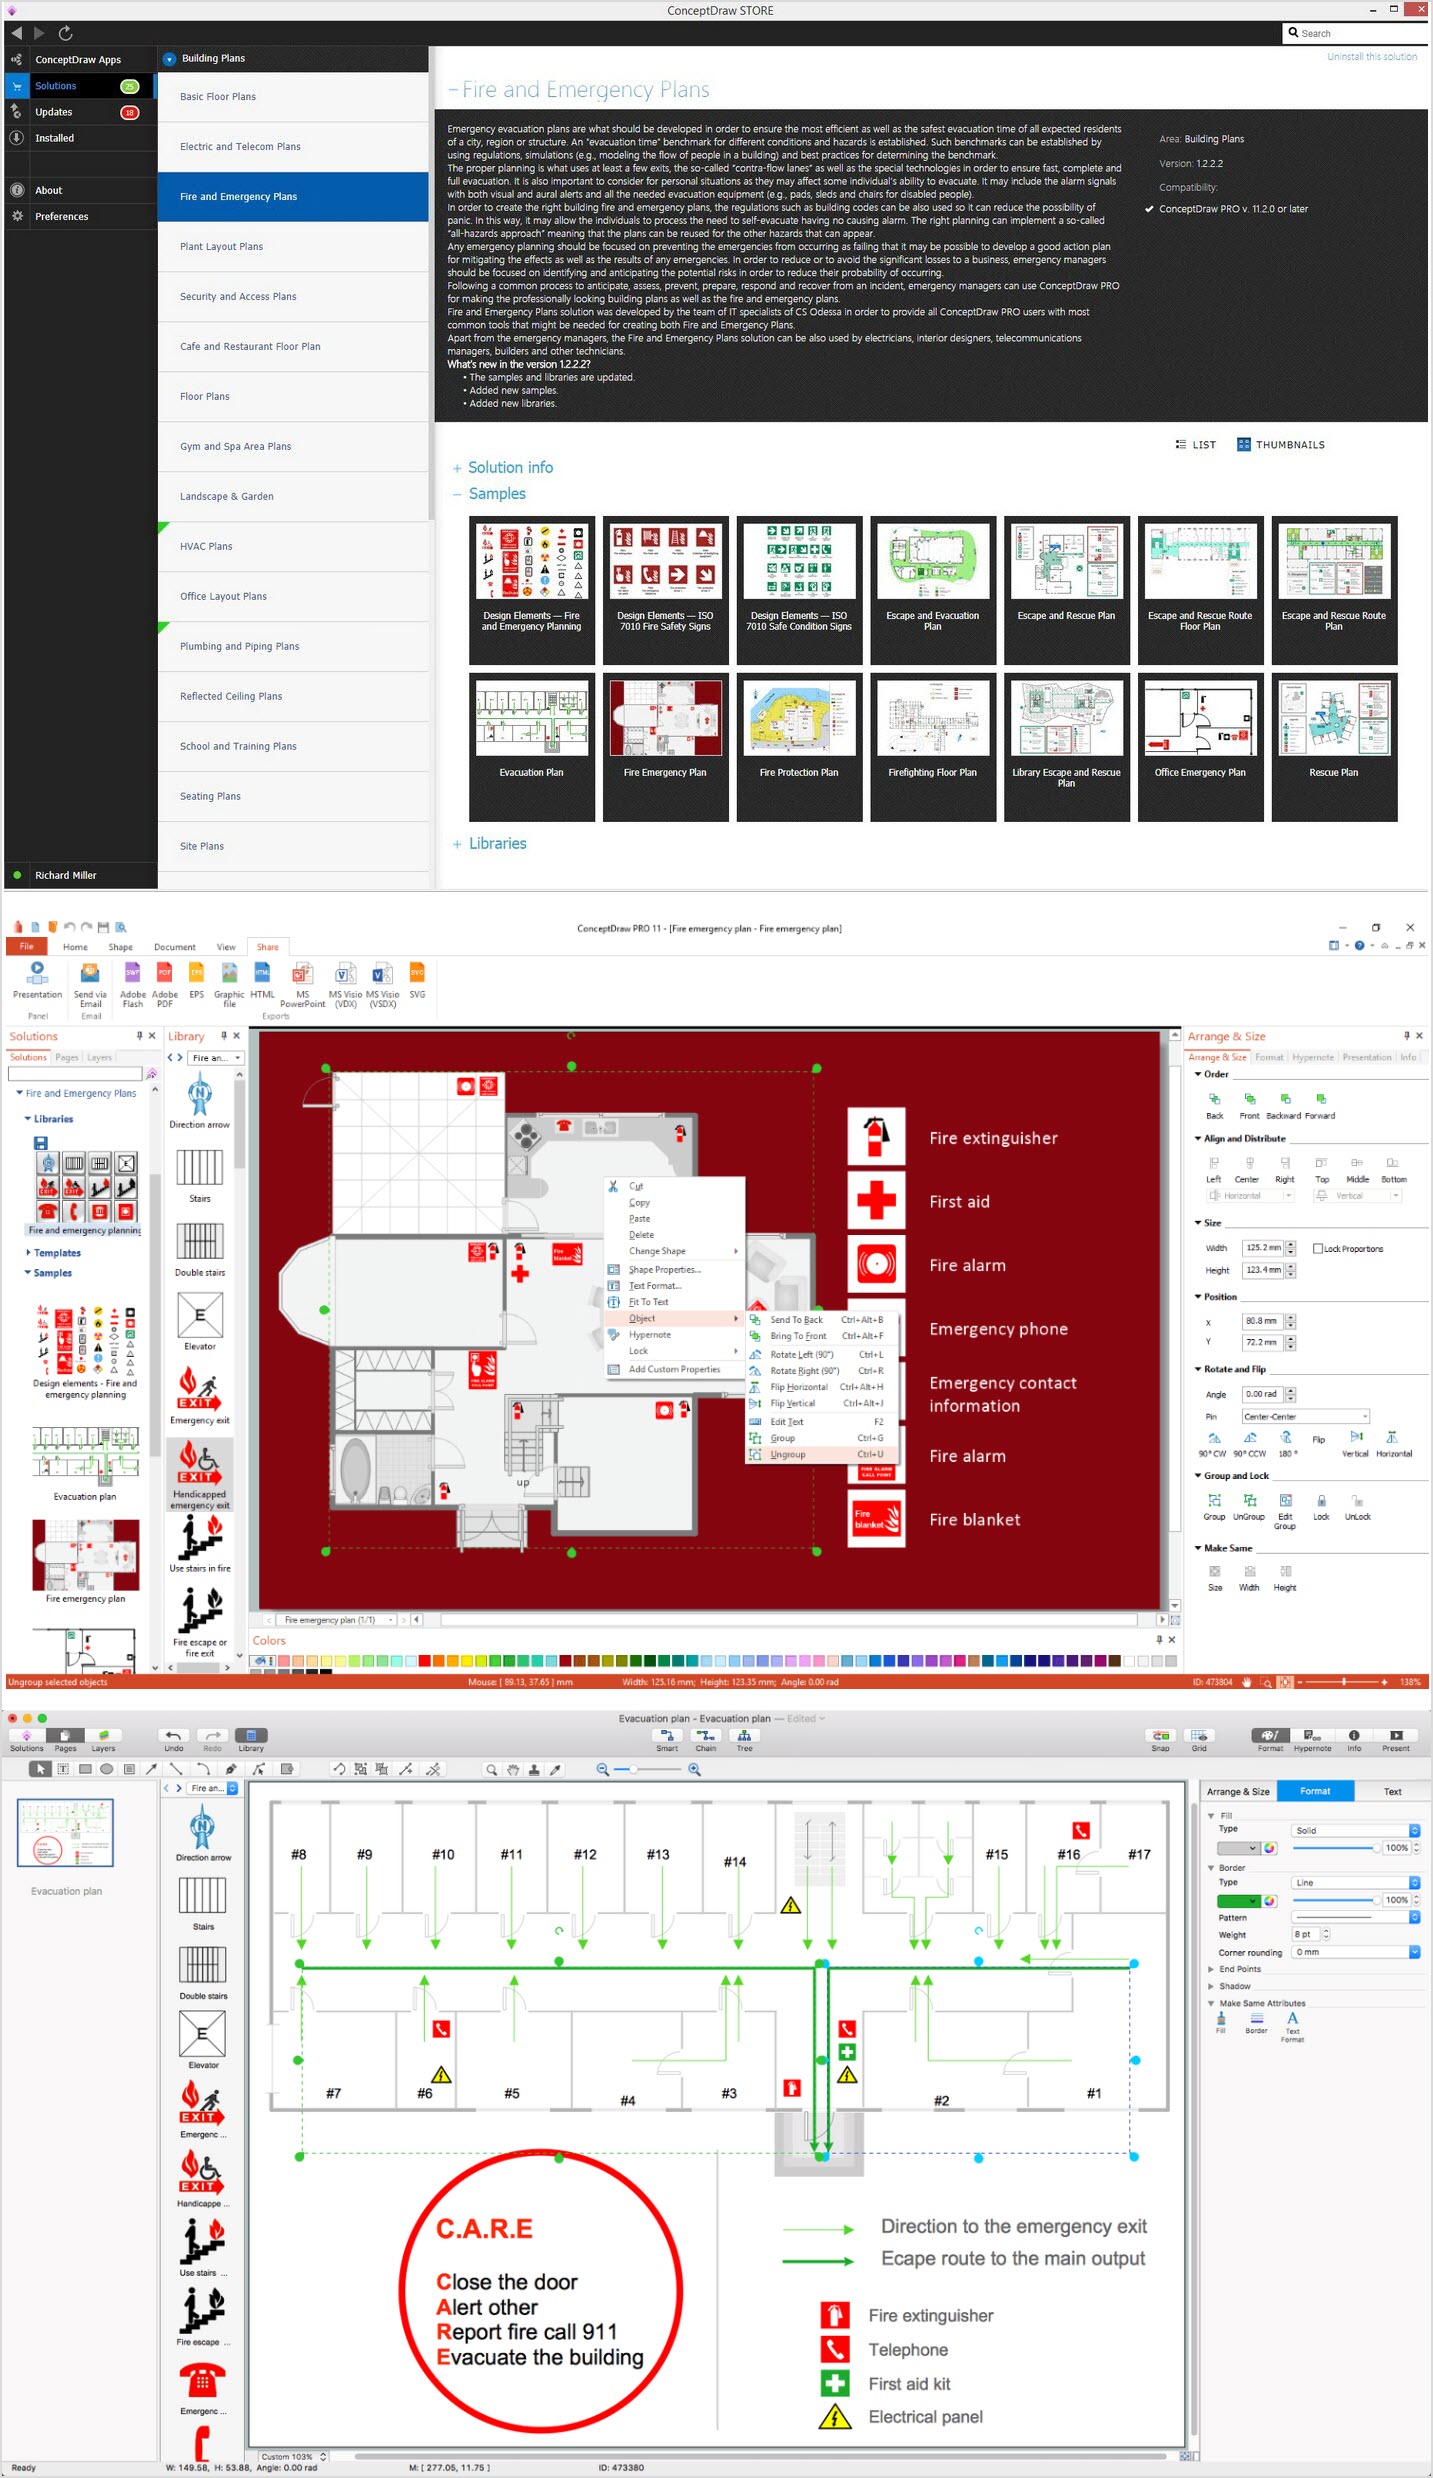
Picture: How To Create Emergency Plans and Fire Evacuation
Related Solution:
The food has great importance in human life, but it is very important that the food was tasty and salubrious. Preparing the food with help of different recipes from the fashion magazines, popular cookbooks, Internet cooking sites, we firstly pay attention to the recipe's design, how delicious and aesthetically the dish is presented on the picture.
Use the ConceptDraw DIAGRAM diagramming and vector drawing software extended with Cooking Recipes solution from the Food and Beverage area of ConceptDraw Solution Park for easy design colorful and eye-catching food recipes illustrations.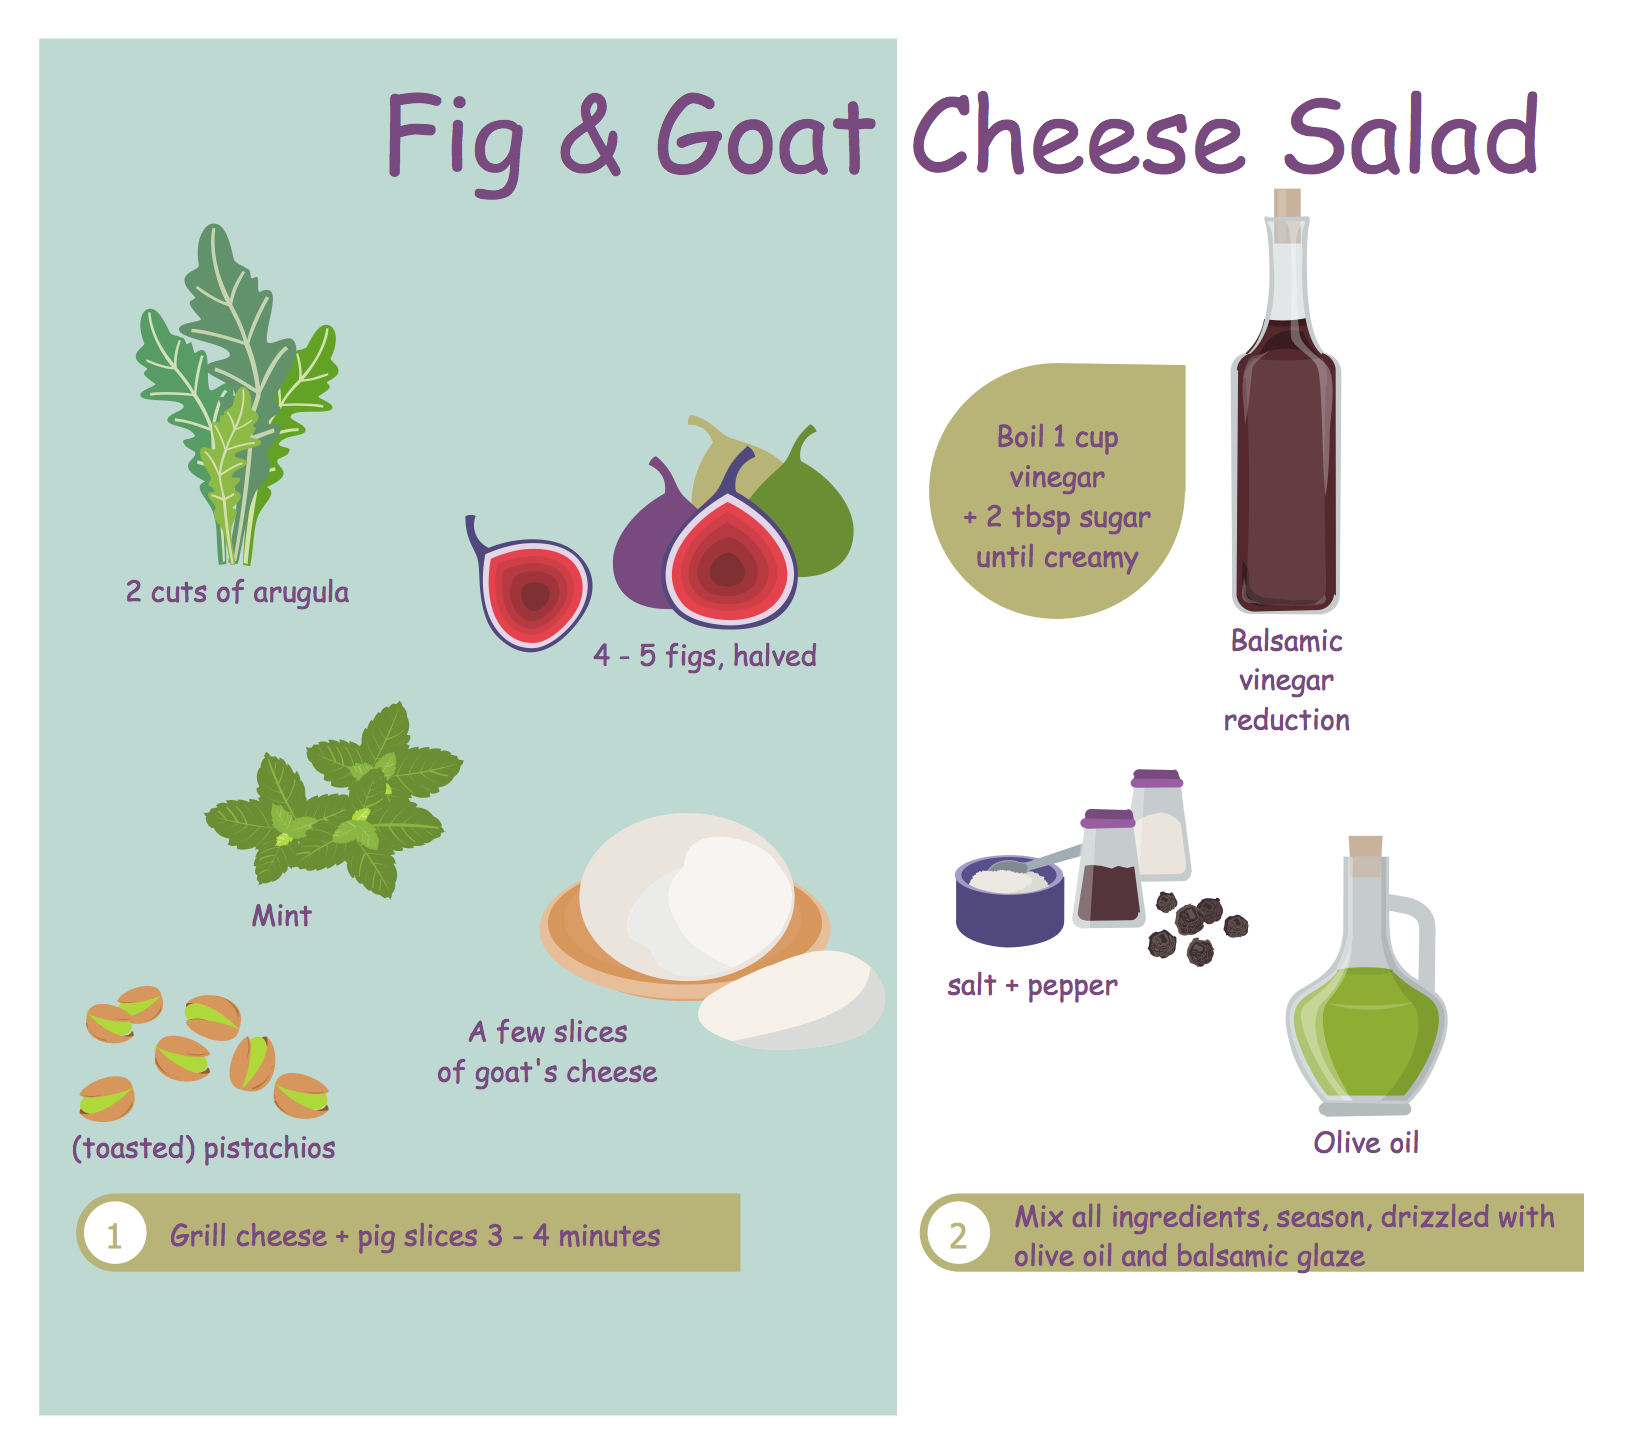
Picture: Food Recipes
Related Solution:
Fruits are unique products, they are beautiful and delicious, and look amazing in the compositions. Fruits are perfect for decorating various dishes, desserts and beverage. Each composition of fruits is a real fruit art!
ConceptDraw DIAGRAM diagramming and vector drawing software extended with Food Court solution from the Food and Beverage area of ConceptDraw Solution Park perfectly suits for fruit art design and easy drawing attractive food and beverage illustrations.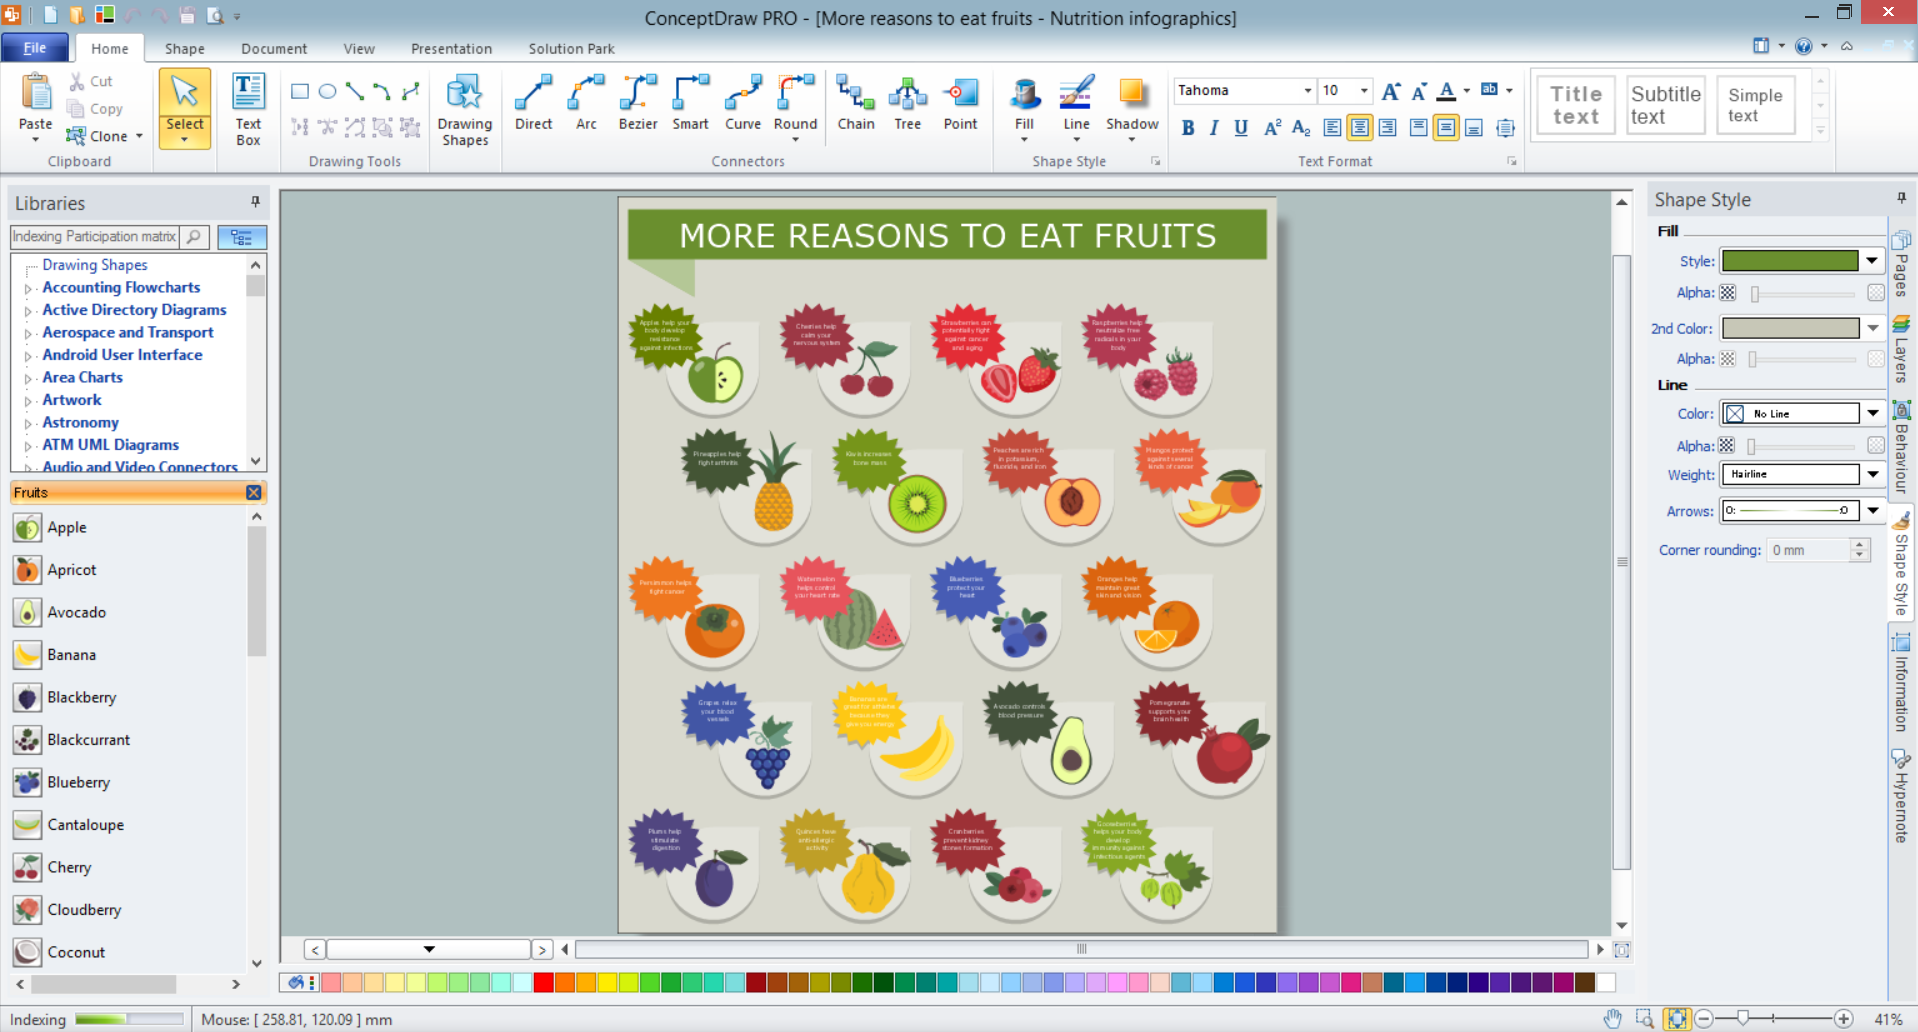
Picture: Fruit Art
Related Solution:
This sample shows the Business Report Pie Chart. The Pie Chart visualizes the data as the proportional parts of a whole, illustrates the numerical proportion. Pie Charts are very useful in the business, statistics, analytics, mass media.
Picture: Business Report Pie. Pie Chart Examples
Related Solution:
ConceptDraw DIAGRAM diagramming and vector drawing software enhanced with unique Cooking Recipes solution from the Food and Beverage area of ConceptDraw Solution Park ideally suits for easy drawing attractive illustrations with dinner recipes.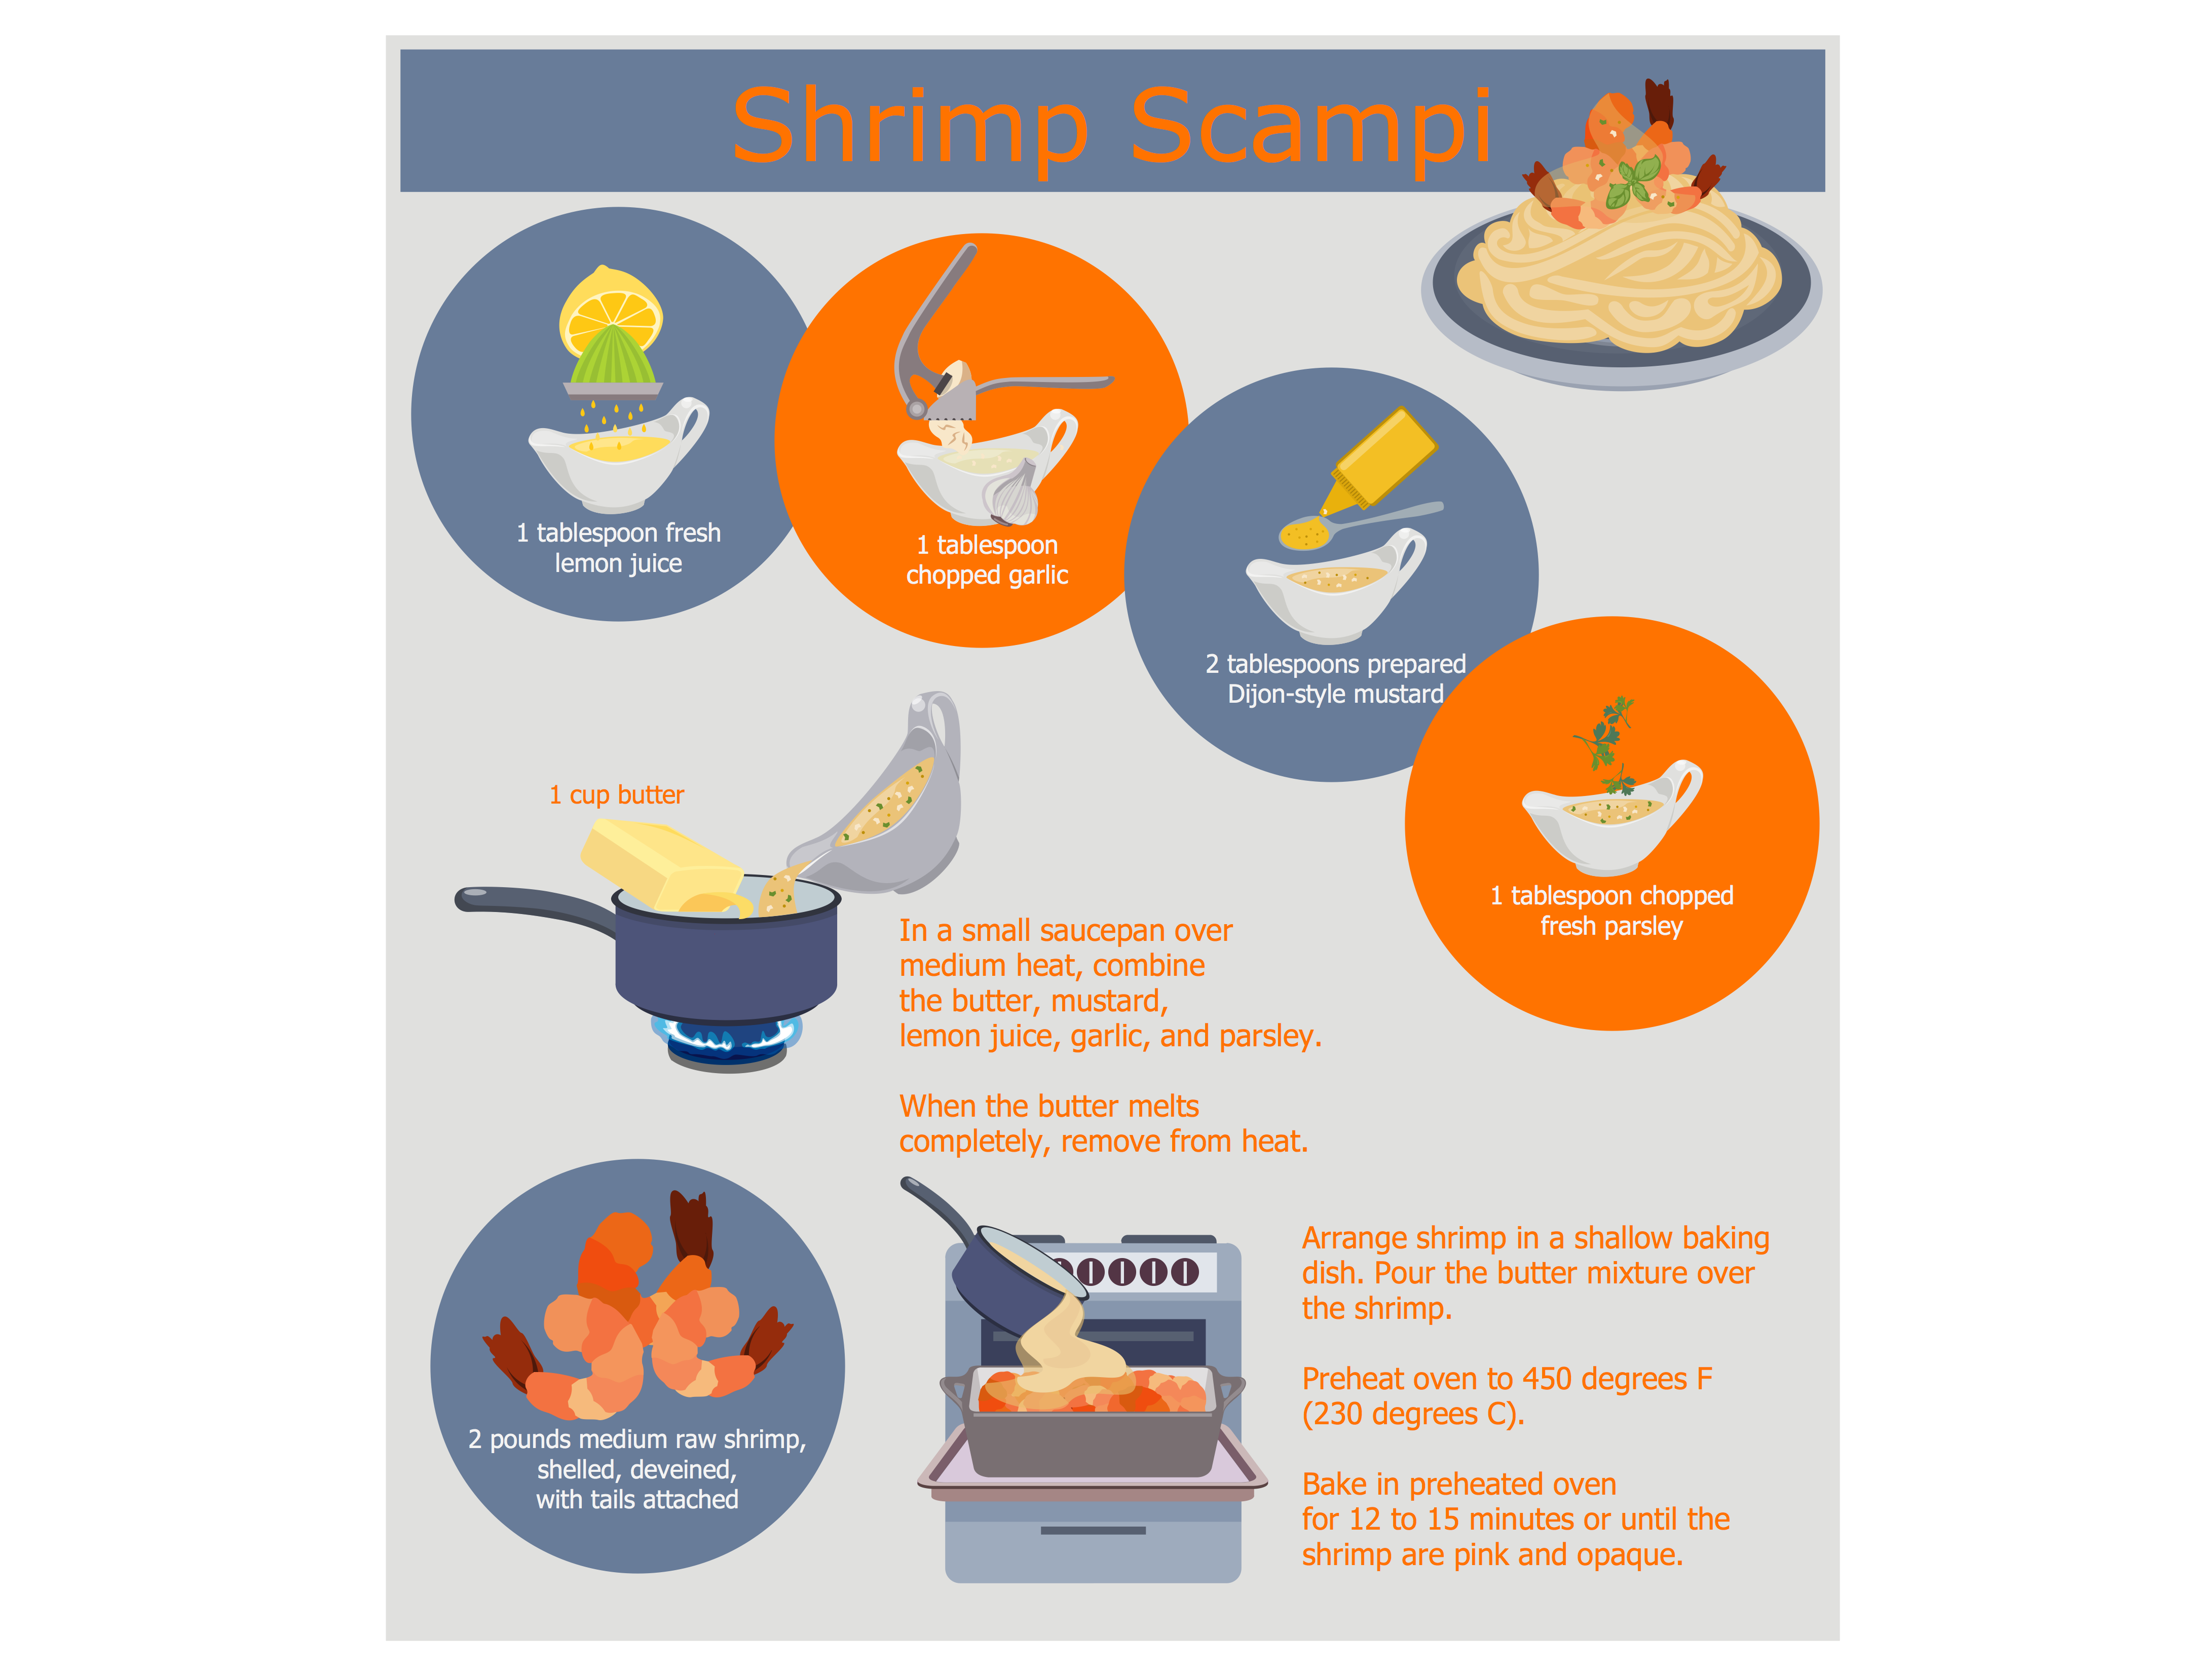
Picture: Dinner Recipes
Related Solution:
If you want to find a way to understand complex things in minutes, you should try to visualize data. One of the most useful tool for this is creating a flowchart, which is a diagram representing stages of some process in sequential order. There are so many possible uses of flowcharts and you can find tons of flow charts examples and predesigned templates on the Internet. Warehouse flowchart is often used for describing workflow and business process mapping. Using your imagination, you can simplify your job or daily routine with flowcharts.
Warehouse flowcharts are used to document product and information flow between sources of supply and consumers. The flowchart provides the staged guidance on how to manage each aspect of warehousing and describes such aspects as receiving of supplies; control of quality; shipment and storage and corresponding document flow. Warehouse flowchart, being actual is a good source of information. It indicates the stepwise way to complete the warehouse and inventory management process flow. Also it can be very useful for an inventory and audit procedures.
Picture: Flow Chart Example: Warehouse Flowchart
Related Solution:

