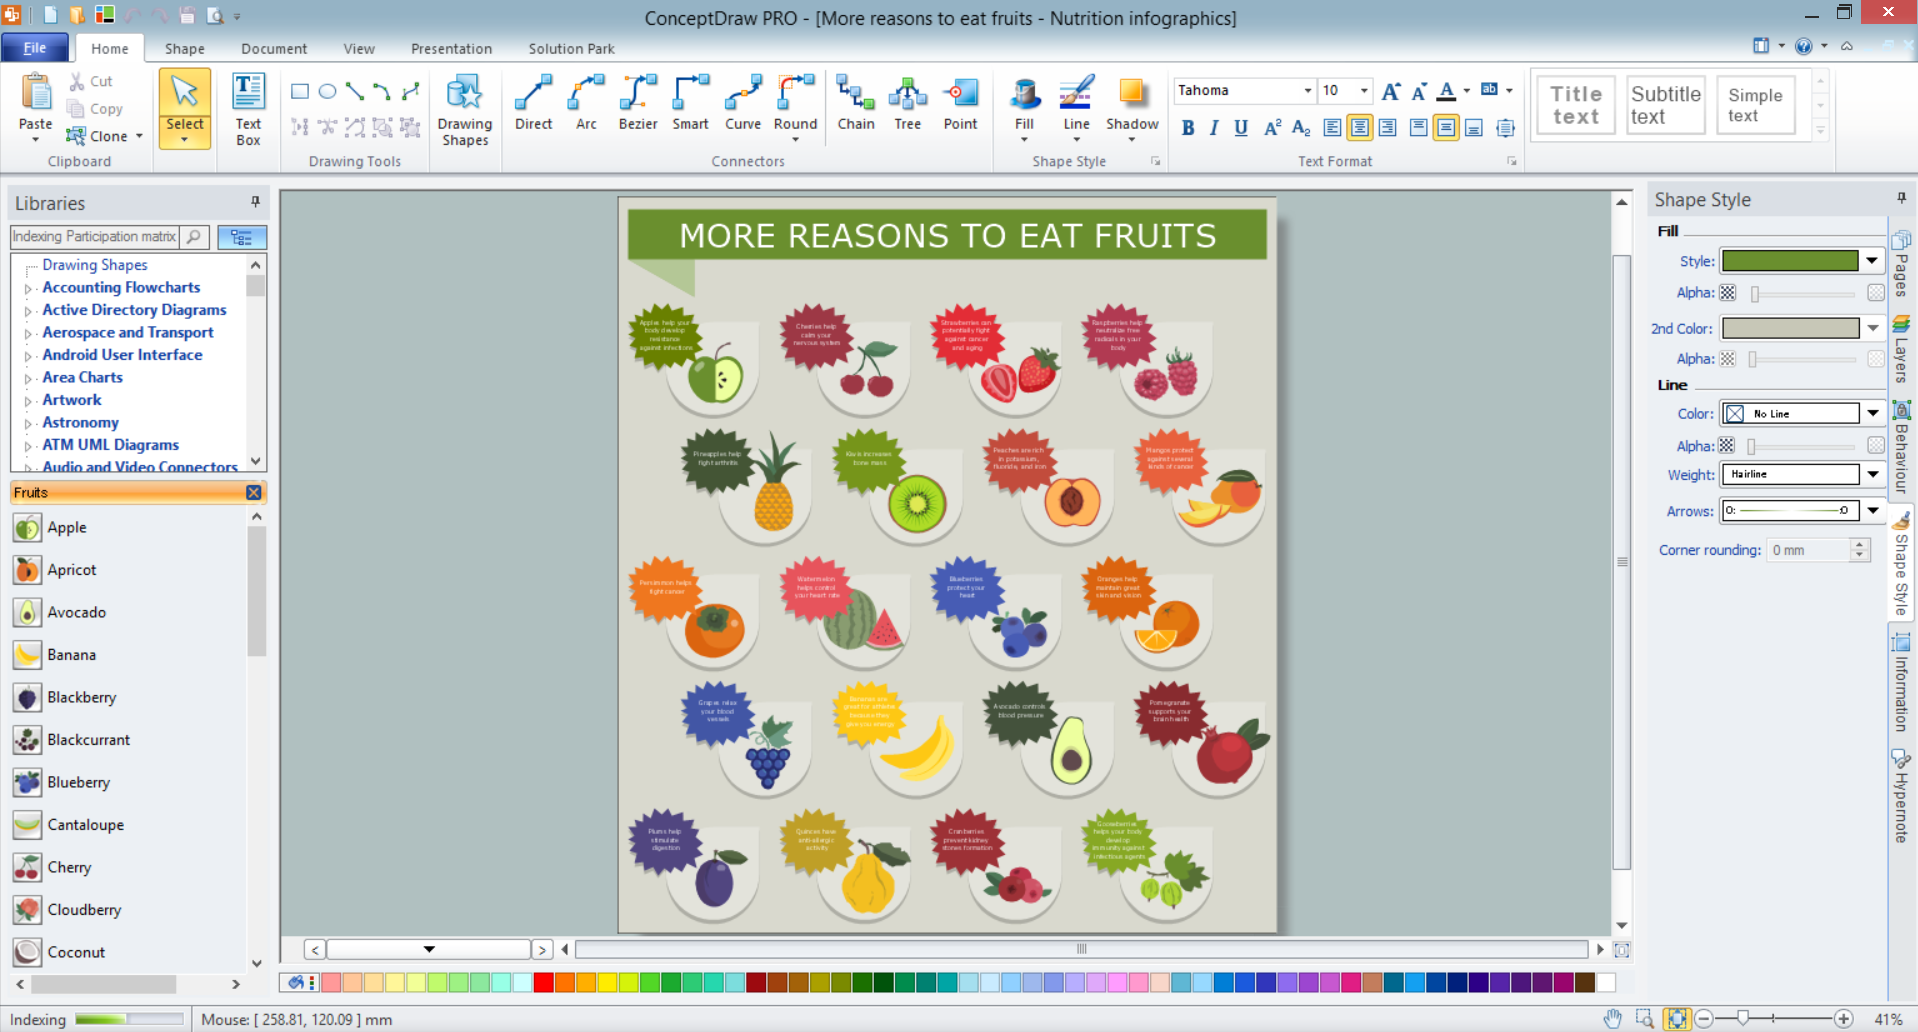
Example 1. Fruit Art in ConceptDraw DIAGRAM /p>
Food Court Solution contains numerous collection of predesigned vector objects, fruit art examples and samples. All ready-to-use predesigned fruit objects are grouped in Fruits library which contains 36 clipart. Fruits library is one of 7 libraries included in Food Court solution, the others include vegetables, meat, desserts, drinks clipart, and more other vector objects for drawing pictorial food images.

Example 2. Fruits Library Design Elements
Bright, interesting, colorful and attractive food images and infographics created with ConceptDraw DIAGRAM tools will help you to achieve a great success. Just look at the professionally designed examples and samples in ConceptDraw STORE to make sure this.

Example 3. Smoothies
The fruit art samples you see on this page were created in ConceptDraw DIAGRAM software using the Food Court Solution. An experienced user spent 10-15 minutes creating each of these food samples.
Use the predesigned objects from the libraries of Food Court Solution for ConceptDraw DIAGRAM to design your own attractive fruit art images and food pictures quick, easy and effective.
All source documents are vector graphic documents. They are available for reviewing, modifying, or converting to a variety of formats (PDF file, MS PowerPoint, MS Visio, and many other graphic formats) from the ConceptDraw STORE. The Food Court Solution is available for all ConceptDraw DIAGRAM users.
TEN RELATED HOW TO's:
There are numerous articles about the advantages of flowcharting, creating business graphics and developing different charts. Nevertheless, these articles are almost useless without the main component - the examples of flowcharts, org charts and without a fine example, it is difficult to get all the conveniences of creating diagrams. You can find tons of templates and vivid examples on Solution Park.
This illustration shows a variety of business diagrams that can be created using ConceptDraw DIAGRAM. It comprises a different fields of business activities: management, marketing, networking, software and database development along with design of infographics and business illustrations. ConceptDraw DIAGRAM provides a huge set of sample drawings including business process modeling diagrams,, network diagrams, UML diagrams, orgcharts, DFD, flowcharts, ERD, geographical maps and more.
Picture: Examples of Flowcharts, Org Charts and More
Related Solution:
A cozy atmosphere is crucial for the success of any cafe or restaurant. To provide it, you should use restaurant floor plan software at the stage of design. If your establishment is located conveniently and has a harmonic atmosphere inside it, this is bound to be a success.
This sample Restaurant floor plan illustrates the possibilities of ConceptDraw solution for Cafe and Restaurant plans. It represents the location of the restaurant's main hall with its furnishing as well as a plan of kitchen and toilets. Generally, Cafe and Restaurant Plans solution has a big set vector images of tables, seats, lightening, etc. Using them you will be able to plan the restaurant of your desire with an incredible design and spirit.
Picture: Restaurant Floor Plan Software
Related Solution:
ConceptDraw DIAGRAM is a professional software for building of great-looking Flowcharts ✔️ of various types and any degree of complexity, ✔️ in a few simple steps, ✔️ even if you have no experience, ✔️ using RapidDraw technology, ✔️ to perform different tasks in different fields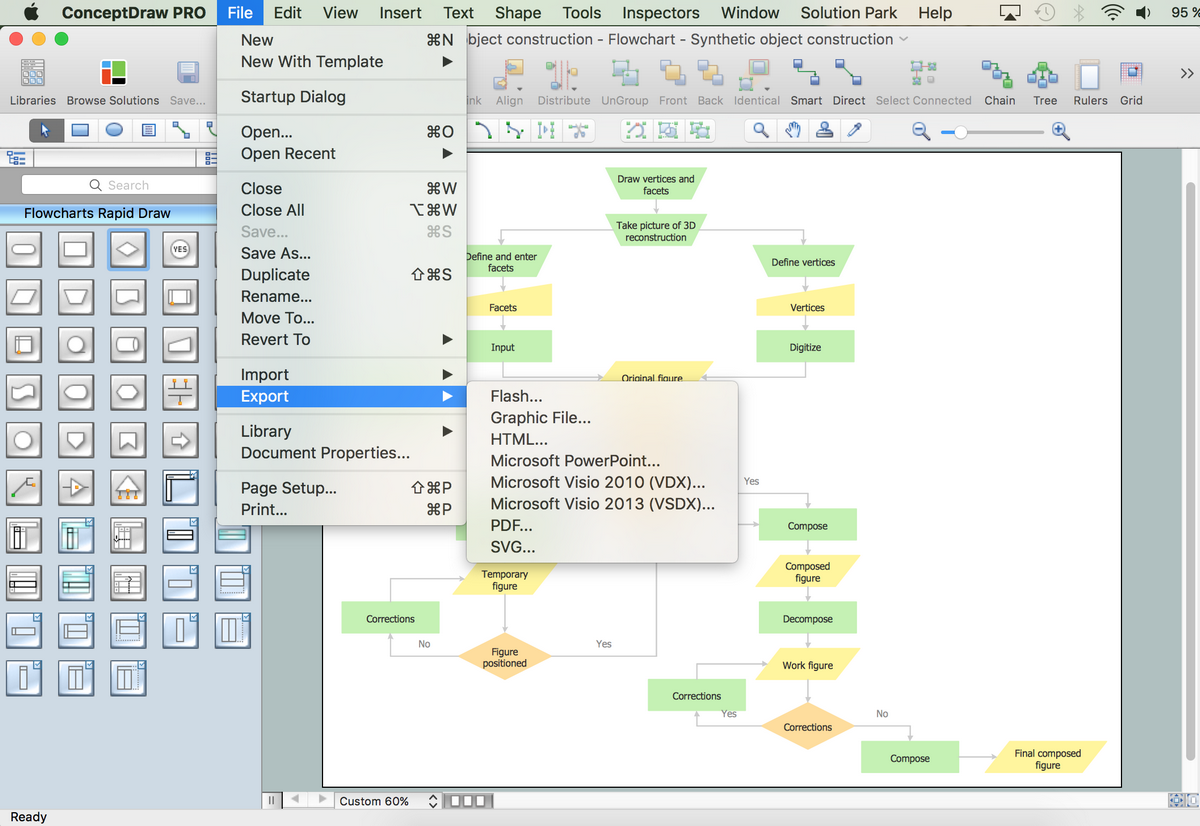
Picture: How to Build a Flowchart
Related Solution:
ConceptDraw DIAGRAM diagramming and vector drawing software offers the Area Charts solution for quick and easy drawing the Area Chart of any complexity.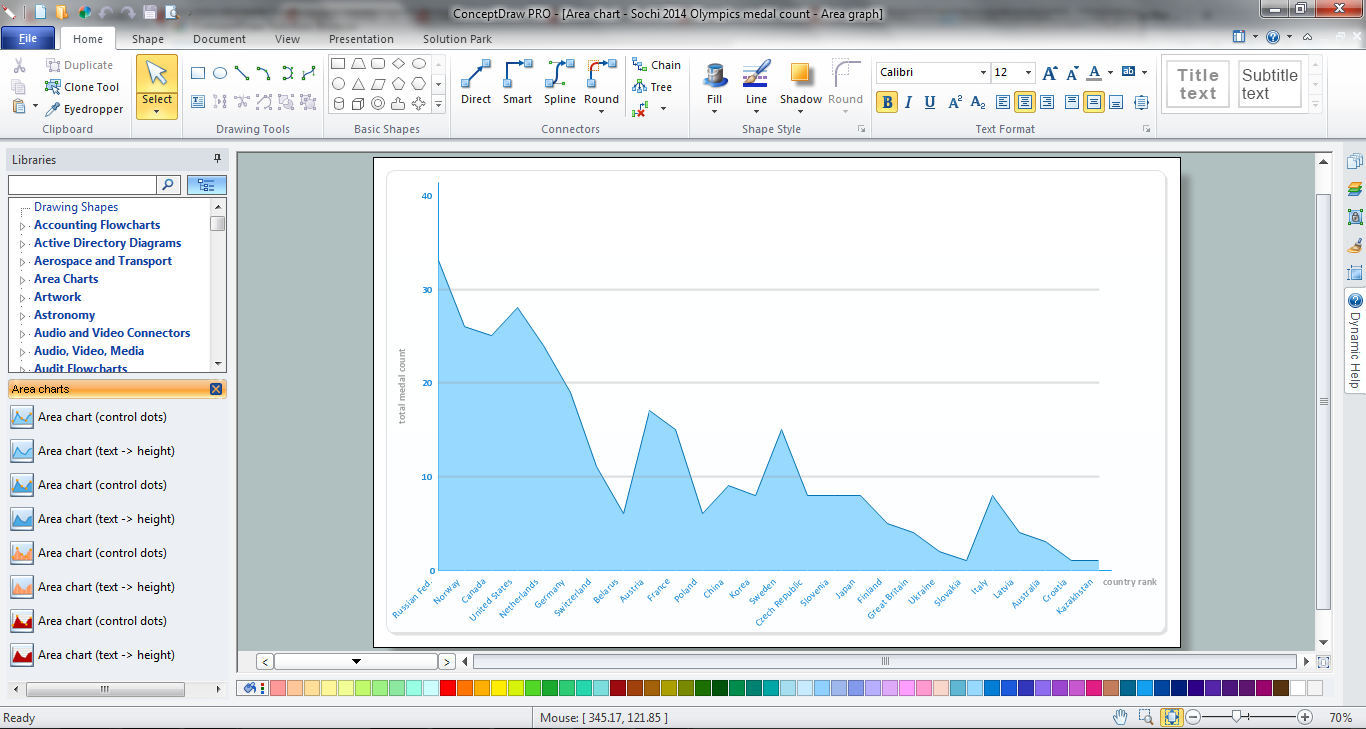
Picture: Area Chart
Related Solution:
This sample was created in ConceptDraw DIAGRAM software using the Flowcharts solution.
Picture:
Copying Service Process Flowchart.
Flowchart Examples
Related Solution:
Tool to draw Metro Map styled inforgraphics. Los Angeles Metro Rail and Liner sample.
This is a one-click tool to add stations to the map. It lets you control the direction in which you create new stations, change lengths, and add text labels and icons. It contains Lines, Stations, and Landmarks objects.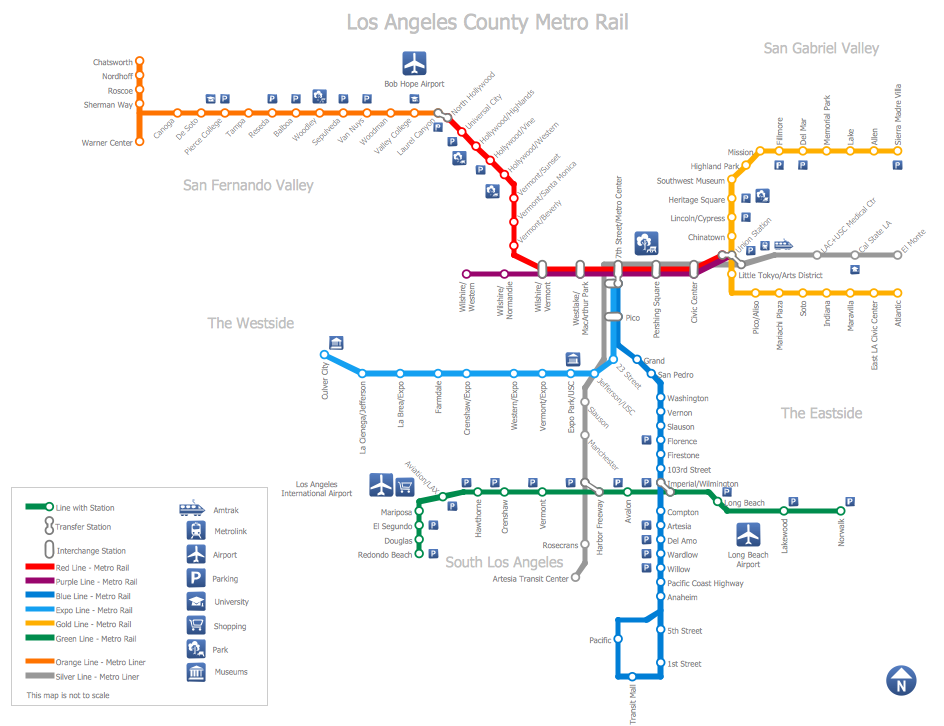
Picture: How to draw Metro Map style infographics? (Los Angeles)
Related Solution:
Designing of food images, fruit art illustrations, pictures of vegetables, and many other food and cafe related images and infographics has never been easier than it is now with ConceptDraw DIAGRAM software.
ConceptDraw DIAGRAM diagramming and vector drawing software extended with Food Court solution from the Food and Beverage area of ConceptDraw Solution Park is perfect food pictures design software.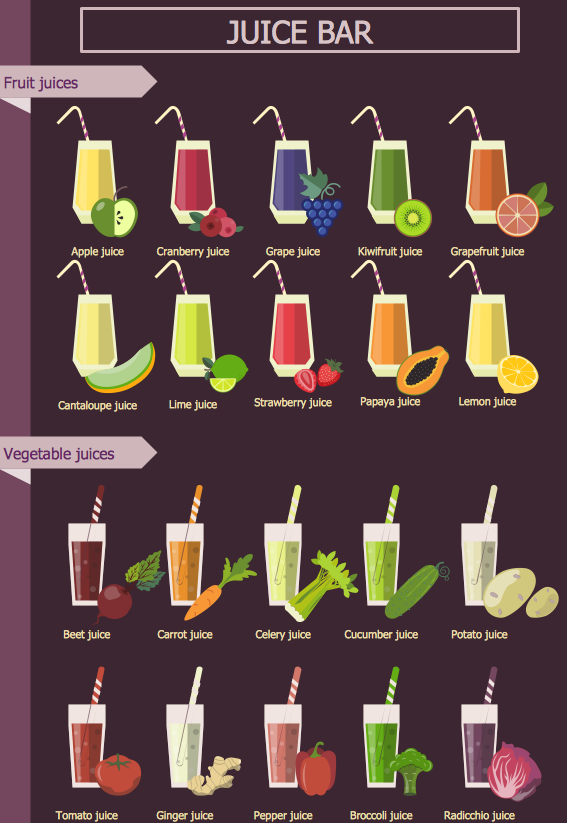
Picture: Pictures of Vegetables
Related Solution:
Diagramming is an astonishing way to visualize business processes. The list of the most common business process flowchart symbols is quite long starting from basic flowcharts, continuing with SIPOC diagrams. Business process modeling was never easier than now, with special ConceptDraw Business Process Mapping solution.
To carry out all professional standard requirements for business processes mapping, it is necessarily to follow the special graphical notations. ConceptDraw Business Process Mapping solution offers an exhaustive suite of tools to aid business process mapping. There are three vector libraries SIPOC Diagrams, Business Process Flowcharts, and Swim Lanes that contains totally more than 50 symbols of standard BPM notations. This is all that professionals need to effectively evaluate and manage quality in business processes.
Picture: Business Process Flowchart Symbols
Related Solution:
DataBase icons - Amazon AWS pro diagrams - AWS diagrams are part of architecturing tools provided with ConceptDraw Solution Park.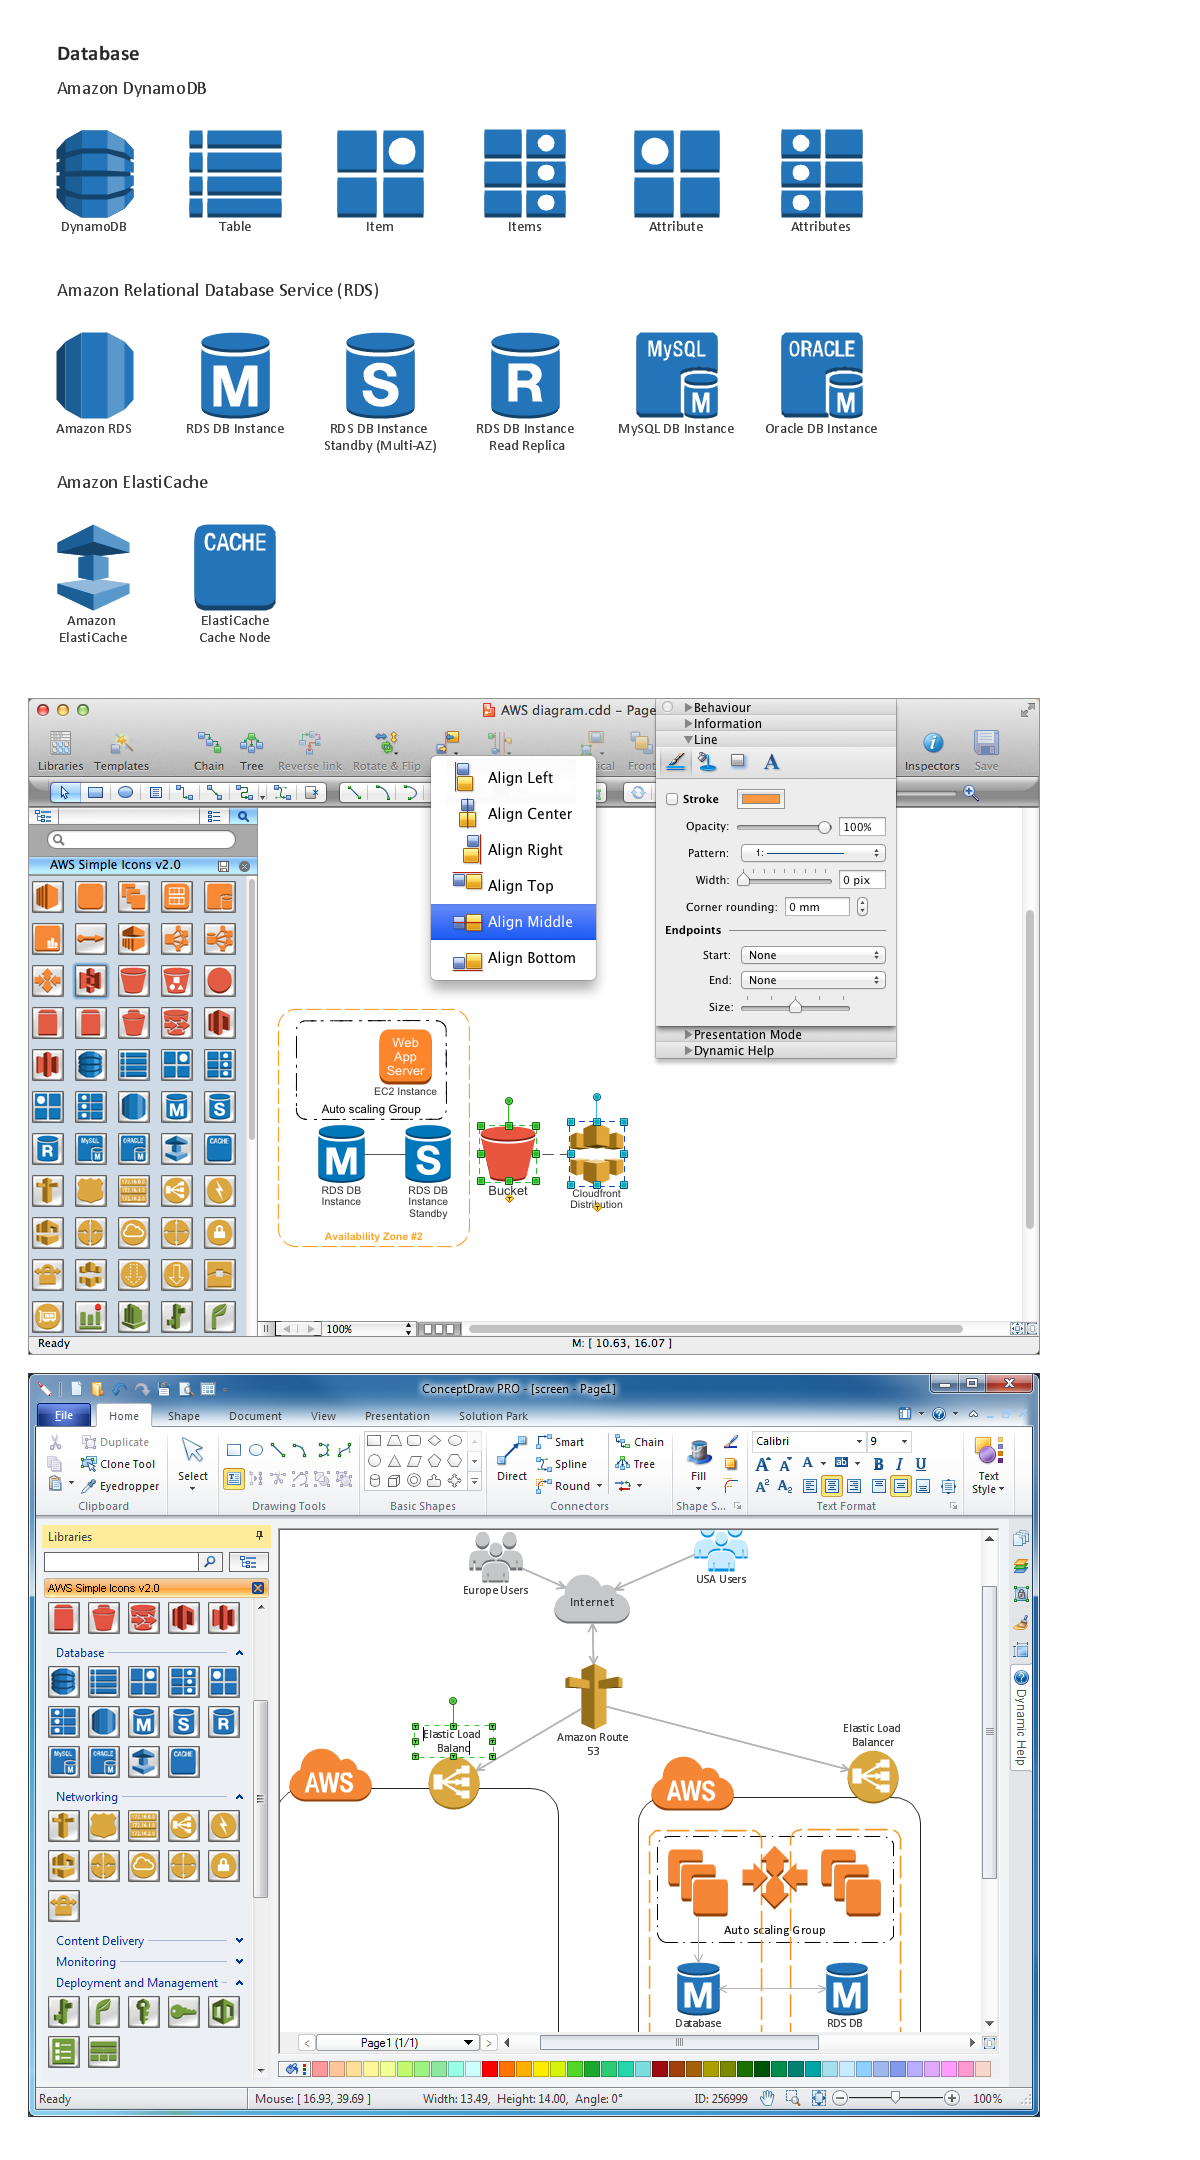
Picture: Diagramming software for Amazon Web Service icon set: Data Base
Planning a computer network can be a challenge for a junior specialist. However, knowing how to draw a computer network diagrams isn’t a rocket science anymore. There are a lot of special software for creating such diagrams with predesigned templates and examples.
The core for Network Fault Tolerance System presented here, is the equipment of Cisco. You can see here the certified Cisco equipment icons. Generally, ConceptDraw DIAGRAM libraries contain more than half of a thousand objects representing the standardized images of Cisco equipment. ConceptDraw solution for network diagramming is a great network diagramming tool for any level skills - from students to network guru.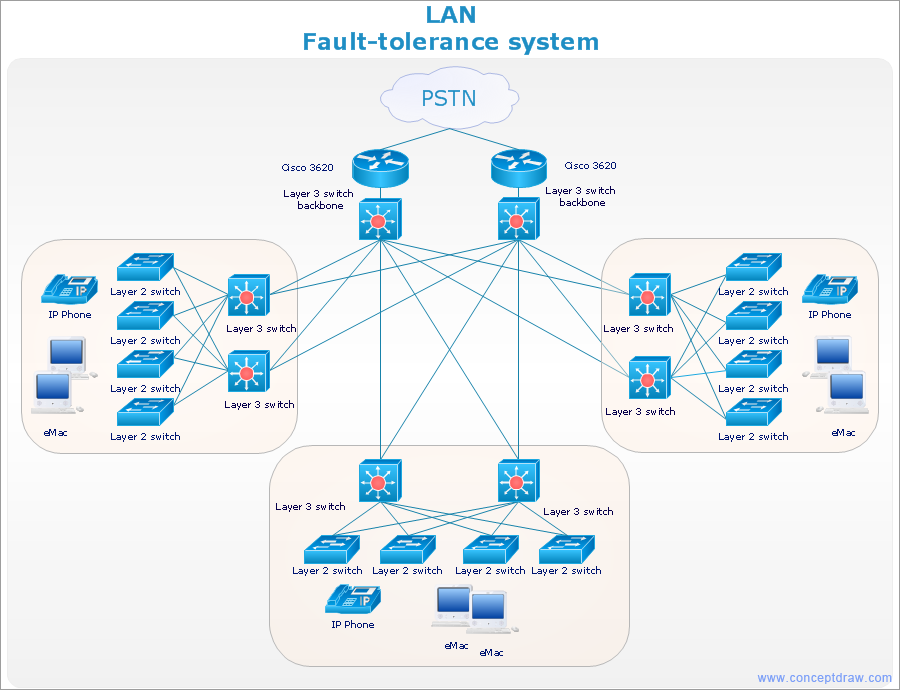
Picture: How to Draw a Computer Network Diagrams
Related Solution:

