Made with
ConceptDraw
DIAGRAM 18

Export from ConceptDraw DIAGRAM Document to a Graphic File

ConceptDraw Pro has the ability to export to a number of useful file formats, giving its users powerful flexibility when working with others.

Let’s say you want to export your ConceptDraw document into a graphical format.

Open the File menu and select Export. Here you can see all the export options.

Click Graphic File to save the document as an image.

Select the desired format from the drop-down list.

For example, let’s use the png format.

A Save as window will pop up. Choose the desired folder and click Save.

Now we have our document saved in png format.

Export from ConceptDraw DIAGRAM Document to a Graphic File

Pic. 1. Export from ConceptDraw DIAGRAM document to a graphic file.

With the Graphic File export option, you can export your whole drawing, or even just selected objects, into a number of graphic file formats.

Export from ConceptDraw DIAGRAM Document to a Graphic File *

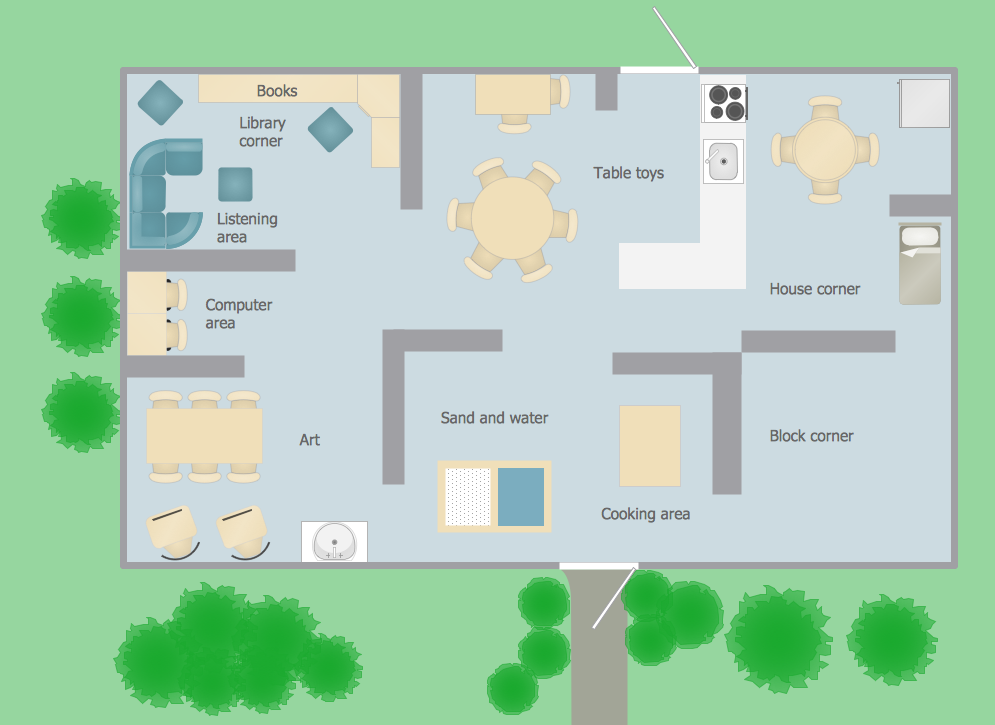
Pic. 2. The selected objects will be exported into a graphic file.

Now it’s easy to share your visual documents with other people in a form most convenient for them.


See also Samples:


TEN RELATED HOW TO's:
SWOT analysis is an effective method of business planning, the question is how to do it. The most obvious way is to make a SWOT analysis in a Word document, which is not very convenient. Luckily, you can use software like ConceptDraw DIAGRAM that has features and templates made especially for SWOT analyzing. A SWOT Analysis is a manager's means of the strategic planning. It is used to define and classify considerable internal moments (strengths and weaknesses) and external forces (opportunities and threats) a business faces. You can use ConceptDraw MINDMAP to determine and organize factors utilized for SWOT analysis, and represent them in the SWOT matrix using ConceptDraw DIAGRAM. Using mind maps empowers you to explore and rank a lot of data engaged for SWOT analysis as well as recognize the relations between various pieces of information.How to Make SWOT Analysis in a Word Document *
Picture: How to Make SWOT Analysis in a Word Document
Related Solution:
The Time-Money-Quality Triangle illustrates an advertising truism, that you can't have all three.Pyramid Diagram *
Picture: Pyramid Diagram
Related Solutions:
Minnesota is a U.S. state in the Midwestern United States. The vector stencils library Minnesota contains contours for ConceptDraw DIAGRAM diagramming and vector drawing software. This library is contained in the Continent Maps solution from Maps area of ConceptDraw Solution Park.Geo Map - USA - Minnesota
Picture: Geo Map — USA — Minnesota
Related Solution:
You need design Cylinder Venn Diagram? Nothing could be easier with ConceptDraw DIAGRAM software.Cylinder Venn Diagram
Picture: Cylinder Venn Diagram
Related Solution:
Visualizing data in infographics format is a modern way to represent any statistics related to global sporting events, such as Winter Olympic Games. ConceptDraw DIAGRAM software extended with the Winter Sports solution delivers a rich set of samples and templates helps you produce all kind of sporting information, such as tournament schedule or medal table.Winter Sports. <br>Olympic Games Infographics. Medal Table *
Picture: Winter Sports. Olympic Games Infographics. Medal Table
Related Solution:
Learn what a workflow diagram is, how it works, when to use it, and how to create one. See examples, handoffs, approval flows, and workflow diagram best practices.Flowchart vs workflow diagram comparison showing decision logic branching versus roles handoffs and execution flow
Picture: Workflow Diagram: Definition, Examples, and How to Create
Related Solution:
While creating flowcharts and process flow diagrams, you should use special objects to define different statements, so anyone aware of flowcharts can get your scheme right. There is a short and an extended list of basic flowchart symbols and their meaning. Basic flowchart symbols include terminator objects, rectangles for describing steps of a process, diamonds representing appearing conditions and questions and parallelograms to show incoming data. This diagram gives a general review of the standard symbols that are used when creating flowcharts and process flow diagrams. The practice of using a set of standard flowchart symbols was admitted in order to make flowcharts and other process flow diagrams created by any person properly understandable by other people. The flowchart symbols depict different kinds of actions and phases in a process. The sequence of the actions, and the relationships between them are shown by special lines and arrows. There are a large number of flowchart symbols. Which of them can be used in the particular diagram depends on its type. For instance, some symbols used in data flow diagrams usually are not used in the process flowcharts. Business process system use exactly these flowchart symbols.Flowchart example showing a customer request approval process with start, input output, process steps, decision branches, and end
Picture: Flowchart Symbols: Meaning and Examples
Related Solution:
How should diagramming software work? Is it possible to develop a diagram as quickly as the ideas come to you? The innovative ConceptDraw Smart Connectors Technology - This is more than enough versatility to draw any type of diagram with any degree of complexity. Connection points are necessary for diagramming network, flowchart and organizational charts. In ConceptDraw you connect shapes by attaching, or snapping and gluing, connectors to shape connection points.ConceptDraw Arrows10 Technology *
Picture: ConceptDraw Arrows10 Technology
Easy charting software comes with beautiful chart templates and examples. This makes it easy to create professional charts without prior experience.Chart Templates *
Picture: Chart Templates
Visualizing sports statistics becomes as easy as never before with ConceptDraw DIAGRAM software extended with the Winter Sports solution. This solution delivers a complete set of winter sports illustrations, samples and templates you may use to visualize any kind of sports statistics in minutes.Winter Sports. Illustrations and Visualize Statistics *
Picture: Winter Sports. Illustrations and Visualize Statistics
Related Solution:
ConceptDraw
DIAGRAM 18