Understanding the Audit Process: A Comprehensive Guide.
Audit Process Flowchart
The audit process is a systematic set of activities directed at gathering and checking an organization's financial operations, systems, records, statements, and other accounting documentation, and evaluating its financial health. The auditing process provides a clear picture of whether a business is operating efficiently and serves as a valuable tool for the enterprise, as well as for investors, shareholders, and creditors, who heavily rely on audit reports in making crucial business decisions.
The audit process helps to ensure transparency within an organization, accuracy of financial reporting, compliance with financial regulations, and correspondence to strategic objectives, as well as improve internal controls and operational efficiency. It includes observing internal processes, checking compliance with regulations, established standards and guidelines, testing the accuracy of financial statements, and collecting evidence. It helps to detect inefficiencies and potential issues, assess risks and their impact. As a result of the audit, a report is prepared; it includes the results and recommendations for improvement, addressing deficiencies, and mitigating risks in order to increase business productivity and quality. After the implementation of corrective actions, a follow-up audit can be conducted.
Key Components of the Audit Process
The main components of an audit process work together to offer a comprehensive overview of the company's financial state and ensure that an audit is objective and up-to-date, helps organizations to improve their financial reporting and internal control, and adds value. These components help auditors assess risk, gather evidence, and provide actionable recommendations. Key components include:
- audit planning;
- defining the scope and objectives for the audit;
- collecting data and evidence by examining financial documents, inspecting transactions, accounts, and internal procedures;
- observing processes and interviewing employees;
- inspecting compliance with policies and regulations;
- development of an audit strategy;
- review of process documentation;
- evaluation of process execution, outputs, and results;
- internal control evaluation;
- risk assessment;
- data analysis;
- identification of issues, discrepancies, weaknesses, errors, or other anomalies in financial records and operations, and assessment of their significance and materiality for the organization’s financial state;
- audit reporting;
- evaluation of results;
- making conclusions and findings;
- prioritization of critical issues;
- offering recommendations and corrective actions for process improvement and optimization;
- implementation monitoring;
- follow-up audits and post-audit reviews to check that the corrective actions have effectively resolved the identified issues.

Example 1. Audit Flowchart Template for Audit Process Diagram Design
Main Types of Audits
The main types of audits include:
| Type | Description |
|---|---|
| Financial audit | Evaluates an organization's financial statements to ensure accuracy, compliance with accounting standards, absence of errors, and material misstatements. |
| Internal audit | It is performed by the company's staff and internal auditors, and is focused on continuous process improvement, assessing and improving the effectiveness of risk management, control processes, and governance structures, evaluating strengths and weaknesses, and ensuring adherence to company policies and regulatory requirements. |
| External audit | It is conducted by independent audit firms or independent individual professionals, who provide an objective opinion on the accuracy of financial statements presented by management, compliance with industry standards and regulations, cybersecurity measures, and assess efficiency of risk management strategies. |
| Compliance audit | Evaluates whether a company follows regulations, laws, and internal policies. |
| Operational audit | Checks the efficiency of an enterprise's operations to detect areas of waste or inefficiency for further elimination and improvement performance. |
| Tax audit | It is conducted by tax authorities to verify compliance with tax laws and the accuracy of filing tax returns. |
| IT audit | Inspects the organization's IT system, security, data integrity, reliability, and correspondence to business needs. |
| Environmental audit | Assesses an organization's environmental policies and practices, compliance with environmental regulations, and ensuring sustainability. |
| Forensic audit | Focuses on the identification and investigation of financial frauds, misconducts, or legal violations within an organization, and often involves gathering evidence for legal proceedings. |
Audit Process Stages
The comprehensive and effective audit process involves several audit stages. The key audit steps include the following:
| Step | Task |
|---|---|
| Defining the scope of the audit | Specifying areas, departments, or processes that will be inspected. |
| Establishing objectives | Setting clear objectives for the audit, which should align with the overall goals of the organization. |
| Planning | Developing a comprehensive audit plan, audit strategy and methodology, setting a timeline and resources. |
| Gathering information | Collecting information, documentation, and data related to the audited areas. |
| Interviewing staff | Communication with employees involved in the audited areas to gain insights and gather information. |
| Documentation review | Involves reviewing collected documents to evaluate their compliance with regulations, internal policies, and industry standards, evaluation and analysis of evidence to identify any errors, gaps, discrepancies, weaknesses in processes, or areas for investigation. |
| Testing | Performing tests to verify the accuracy of financial data and transactions and correspondence to documentation. |
| Assessing the effectiveness | Checking existing controls and procedures to identify weaknesses or vulnerabilities and offering ways to enhance control. |
| Identification of risks | Detection of potential internal and external risks, which can affect the organization's operation and reputation. | Developing recommendations | Offering recommendations and corrective actions to eliminate risks and deficiencies, and improve the organization's operation. | Reporting | Drafting a comprehensive report summarizing findings and conclusions, identifying areas for operational enhancement, cost-saving opportunities, and offering them for reviewing by management. | Follow-up procedures | Tracking the implementation of recommended corrective actions to fix issues and improve processes. |
Characteristics of Auditing
The auditing process is characterized by the following properties:
- is a systematic, methodical, and structured process implemented according to established standards, procedures, and regulations;
- is organized logically and consistently;
- covers all significant areas of the company's financial operations;
- is based on gathering sufficient evidence of various types to make analysis, findings, conclusions, and recommendations;
- is reliable through the auditors’ duty to maintain independence, objectivity, professional judgment, and a skeptical mindset throughout the auditing process to assess the information critically and guarantee well-founded conclusions.

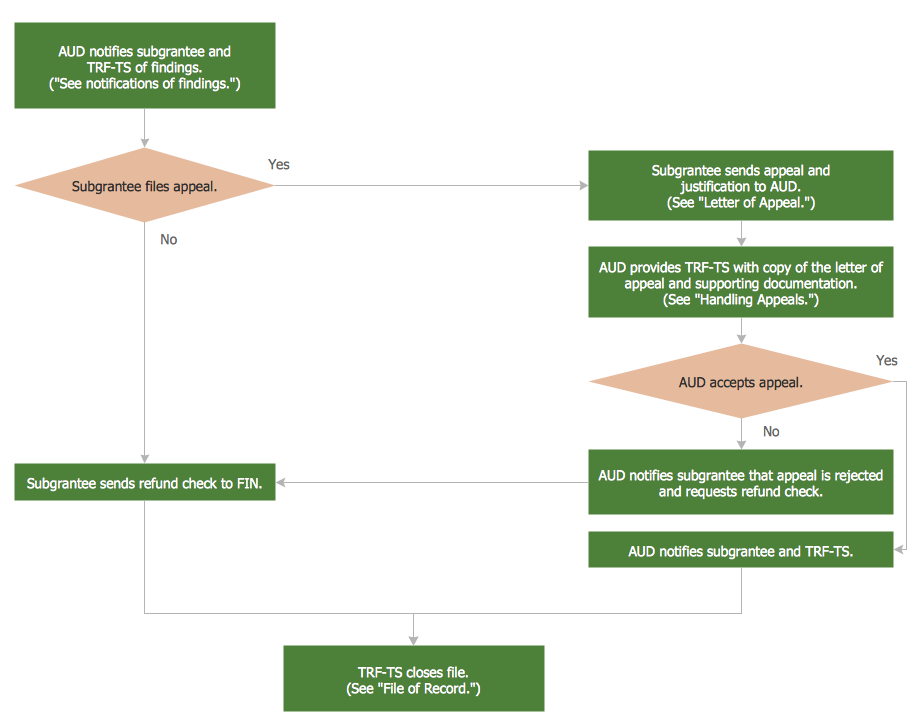
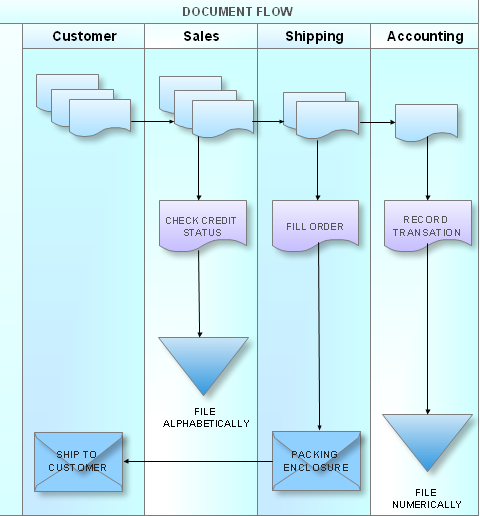
Example 2. Finance Audit Flowchart — Claim Data Processing
Benefits of Auditing for Business
The audit process has many advantages and provides numerous benefits for businesses. It assists you in the following activities:
| # | Benefits |
|---|---|
| 1. | consolidates all financial data of the company into an accurate standardized format; |
| 2. | provides a comprehensive, transparent and up-to-date financial picture of the company; |
| 3. | facilitates understanding of the enterprise’s financial position for leadership and other stakeholders; |
| 4. | helps in obtaining information about profit or loss; |
| 5. | provides assurance to the owners, investors, shareholders, and other stakeholders about the accuracy of their financial statements; |
| 6. | assists in making informed strategic decisions; |
| 7. | helps identify and eliminate errors and prevent fraud in the accounting documentation; |
| 8. | facilitates tax planning and tax assessment; |
| 9. | provides greater credibility for financial statements; |
| 10. | improves the responsibility and reliability of employees; |
| 11. | helps in preparing a future development plan; |
| 12. | increases credibility and confidence among banks and creditors, and facilitates obtaining loans; |
| 13. | helps determine the price of the business and facilitates sale; |
| 14. | collects evidence to make correct conclusions and develop efficient corrective actions. |
Auditing Principles
The basic principles used in auditing define its effectiveness and make it a reliable and efficient process to improve and develop any business. By adhering to these principles, the auditors contribute significantly to the success of the enterprise they audit. The main audit and audit process principles include:
- confidentiality;
- accuracy;
- independence;
- integrity;
- objectivity;
- impartiality;
- skills and competence;
- professionalism;
- insightfulness;
- continuous improvement;
- communication;
- planning;
- future focus;
- testing the internal control;
- collecting internal and external evidence;
- correspondence to strategies, objectives, and risks of the organization;
- relevant documenting and reporting.
Audit Workflow Visualization
Data visualization with graphs, diagrams, process flowcharts, performance dashboards, and other visual aids is incredibly important and widely used in auditing. It ensures a standardized approach to audits and adds value to this process by providing a clear, organized, and visual view of the tasks, steps, decision points, responsibilities, and other information valuable in the audit. Data visualization helps auditors, management, investors, lenders, and other practitioners stay informed, easily understand the workflow and complex financial information and explain the results of auditing, analyze data and spot trends, errors and anomalies, potential threats, fraud, and improvement opportunities.
Data visualization enhances team coordination and communication, reduces delays, and is a powerful tool to validate the accuracy and integrity of financial records, track relationships and risks, and improve the efficiency of auditing and the overall company's operation. It helps to make expectations and forecasts based on previous factors and patterns, compare forecasts with budgets, uncover success or deviations, identify unusual changes or unexpected trends, propose and take corrective measures.
Audit Planning: Benefits of Using Audit Process Flowchart
Audit planning is the initial and crucial phase of an audit process. The scope, main objectives, procedures of the audit, and timeline are defined and the audit strategy is designed at this stage. The efficiency of the audit process greatly depends on properly organized, competent, and focused audit planning.
The Audit Process Flowchart is a visual representation that covers all critical areas and helps to plan and organize the audit process efficiently. It outlines the steps that auditors follow to perform the audit. This ensures a systematic and thorough audit process, helps maintain consistency and quality, reduce risks, improve communication, and enhance overall quality.
Audit Process Flowcharts have a lot of benefits and ensure the optimization and efficiency of the audit process at each stage, from its planning to reporting and post-audit. Key benefits of using the Audit Process Flowchart include:
- clear structure;
- transparency;
- compliance with standards;
- improved documentation;
- enhanced communication on complex processes;
- minimization of delays or miscommunication;
- identification and elimination of repetitive or redundant steps;
- efficient risk management;
- early identification of risks;
- consistency in actions;
- preventing errors or oversights;
- efficient time management;
- accountability;
- flexibility;
- better resource allocation;
- simple tracking the progress;
- cost reduction;
- audit and post-audit improvement;
- enhanced decision-making;
- improved work efficiency;
- improved client trust.