Baseball Field Sample
Playing baseball means having a good time as long as you win the game, but to manage to succeed in it, it is always better to plan things in advance, better – with the help of the pre-made template of the baseball field so it becomes obvious where the players should be and what they should do. Such templates may be also very useful for teaching people how to play this fun game and they can be created in ConceptDraw DIAGRAM drawing software.
The very basic layout of the baseball field, also known as the “diamond” almost has not been changed since the original one made in the 1840s. That distance which should be kept between the bases was originally established as 27,5 metres and it is the same today. The mentioned 27,5 metres have been settled on as the optimal distance and so it is as the larger one would give too much advantage to the defense, and the smaller one would give too much advantage to the offense.
Originally, Knickerbocker Rules did not specify the pitching distance clear enough. In the 1870s the pitcher was compelled to pitch from within a so-called "box", which front edge was 13,7 metres from the "point" of the home plate. By the 1880s, all the pitchers had mastered the underhand delivery and so there were two perfect games within a week of each other. In 1881 the front edge of the pitcher's box was moved back 1,5 metres, to 15 metres from the “home plate”. Earlier, all the pitchers were allowed to throw the overhand starting in 1884. But already in 1887, the box was set at 1,2 metres wide and 1,7 metres deep, with the front edge still 15 metres from the “plate”. Although, the pitcher was compelled to deliver the ball with his back foot at the 16,9 metres line of the box.
In 1893, the mentioned “box” was replaced by the so-called “pitcher's plate”, but it is still used nowadays as a slang term for the pitcher's location on the field. Exactly 1,5 metres were added to the point the pitcher had to toe in order to increase the batting and so to increase the attendance. It resulted in the seemingly peculiar pitching distance to become the one of 18,4 metres.
Lots of different sources suggest that the pitching distance was 45 evolving to 60,5 feet. Although, the first two were the so-called "release point" and the third was known to be the so-called "pushoff point". Thus, the 1893 increase was not as dramatic as it is often implied. It is known to be that the pitcher threw from the so-called “flat ground”, but over the time the raised mound was developed, returning the advantage to the pitchers. Once the so-called “rounded pitcher's mound” was developed, the path after became much more ornamental, rather than practical, becoming thinned before being largely forgotten by the 1950s. In the recent years, there have been some ballparks used, such as the “Chase Field” and “Comerica Park” in the major leagues, revived the feature for only the nostalgic reasons.
The outfield within the baseball field is known to be made from the thick grass or, sometimes, from the artificial turf. The mentioned outfield is simply where the outfielders play takes place. The positions for playing in the outfield are centre, right and left. Different outfields vary in their shape and size depending on the overall shape as well as the size of the playing baseball field. The so-called “outfield stretches” are known to be going from the infield all the way to the outfield wall on the baseball field, containing the so-called “warning track”. Such outfields can also vary from the Little League to the Major League fields
The term of “warning track” in baseball can be described as the strip of dirt at the edges of the field, being coloured and so looking different from the grass field. A fielder can always remain focused on a fly ball being near the fence and so measure his proximity to the fence during his try of catching that ball safely.
A width of the warning track is never specified in the rules, but it is known to be from about 6 feet for Little League fields to about 3 up to 4,5 metres for, for example, the play of professionals. The mentioned track can be composed of the finely ground rock particles (e.g., the cinders), that is why the "warning track" can be also called as the "cinder path" sometimes.
There is also such term as a warning-track power, which is a derogatory term for a batter who has just enough power for hitting the ball to the warning track for an out, but never enough for hitting a home run. The term usually refers to someone being almost good, but not very good enough for something.
The term of “outfield wall”, same as “outfield fence”, can be understood to be the wall, marking the very outer boundary of the outfield. Any ball which passes over the wall is known to be “dead”. In case the ball in a game of baseball passes over the wall in the so-called “fair territory” while being in flight, then it is a “home run”. The official rules do not, though, specify the height, the shape or the composition of the wall. The Major League Baseball allows a minimum distance of 76 metres and recommends a minimum one of 98 metres at the foul poles, as well as 120 metres at centre field.
As a result, the baseball fields can vary in their layouts along the mentioned lines. It is well known that the wall has the numbers painted or affixed on it, denoting the distance in feet from that point on the wall to the “home plate”. In most of the modern major league ballparks, the mentioned “wall” is known to be made of some hard material, such as concrete with padding on the field side in order to protect the baseball players who may collide with the wall. The so-called “chain link fencing” can also be incorporated into the “wall” in those areas where the wall needs to be transparent. Many ballparks also feature a yellow line, used for denoting the top of the wall to aid the umpires in judging if the ball passed over the wall or if it is foul and fair.
You can always go into more details getting to know about the game of baseball from the other baseball related articles on this site and to make your own professionally looking baseball field template you can always get the Baseball solution from ConceptDraw STORE.

Sample 1. Baseball Solution
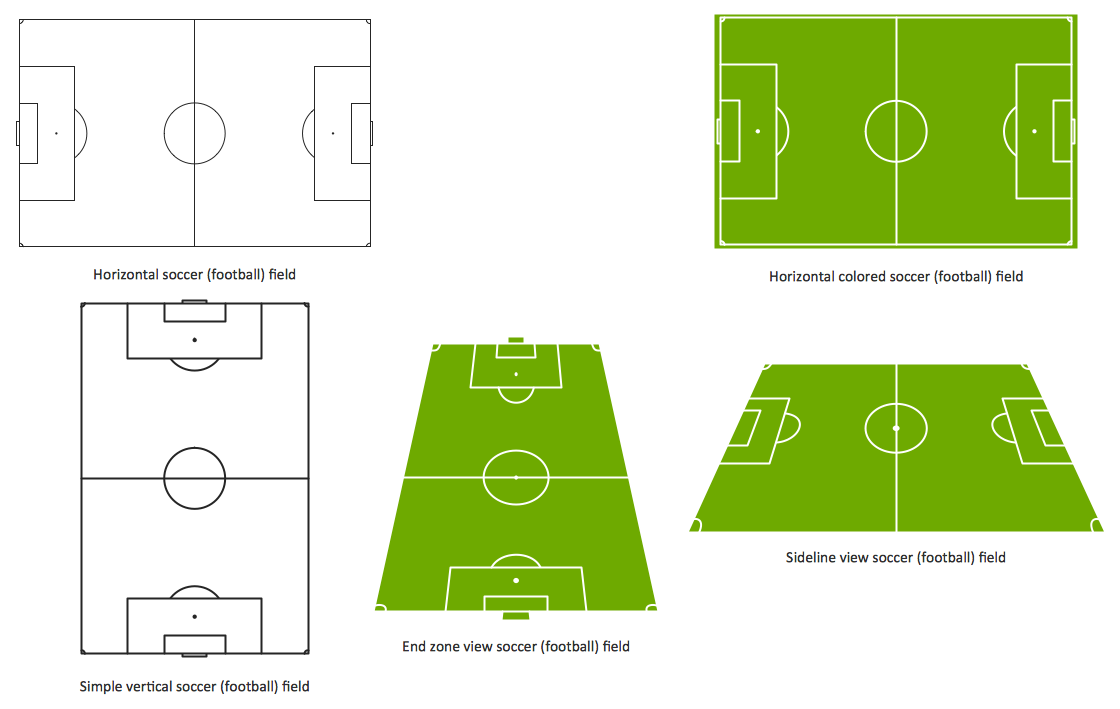
A combination of the "Baseball Fields" and "Baseball Positions" libraries gives you an ability to create a baseball-related drawing in seconds. Follow next steps to create you own baseball schema:
- From the "Baseball Fields" library drop a field object to your document
- From the "Baseball Positions" library drop all positions object you need to your document
- Place positions on the field according to your drawing idea
- Add arrows or text labels if needed.
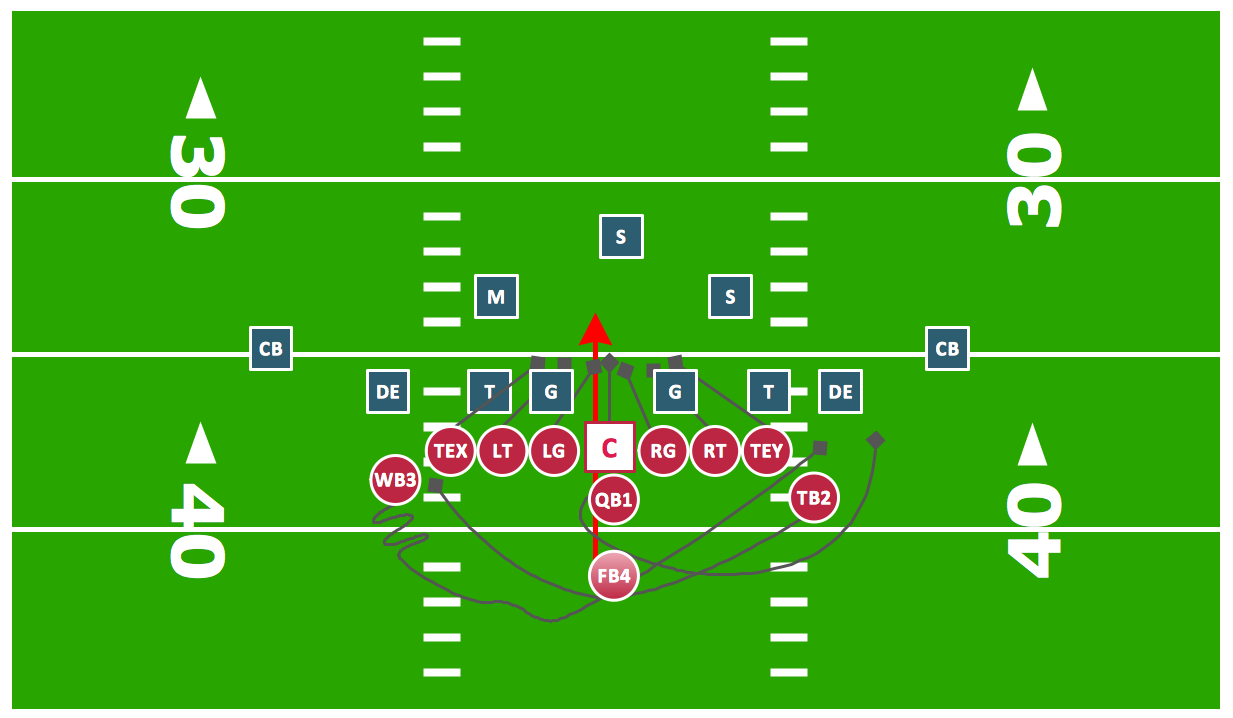
Using Layers feature you are able to add more depth to your drawing. Place the main drawing (library object) onto the one layer, and then add text callouts, labels, frames, and dimensions. Hide additional layers on start, and then make them visible one-by-one to make your explanation easier to perceive.

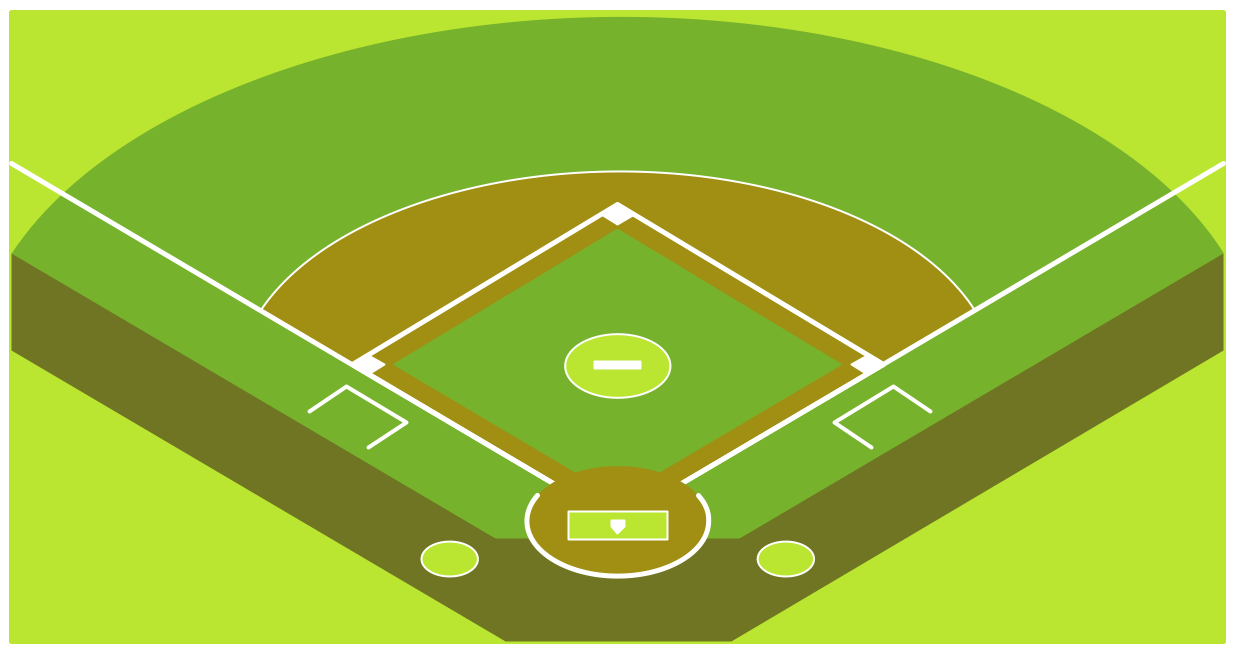
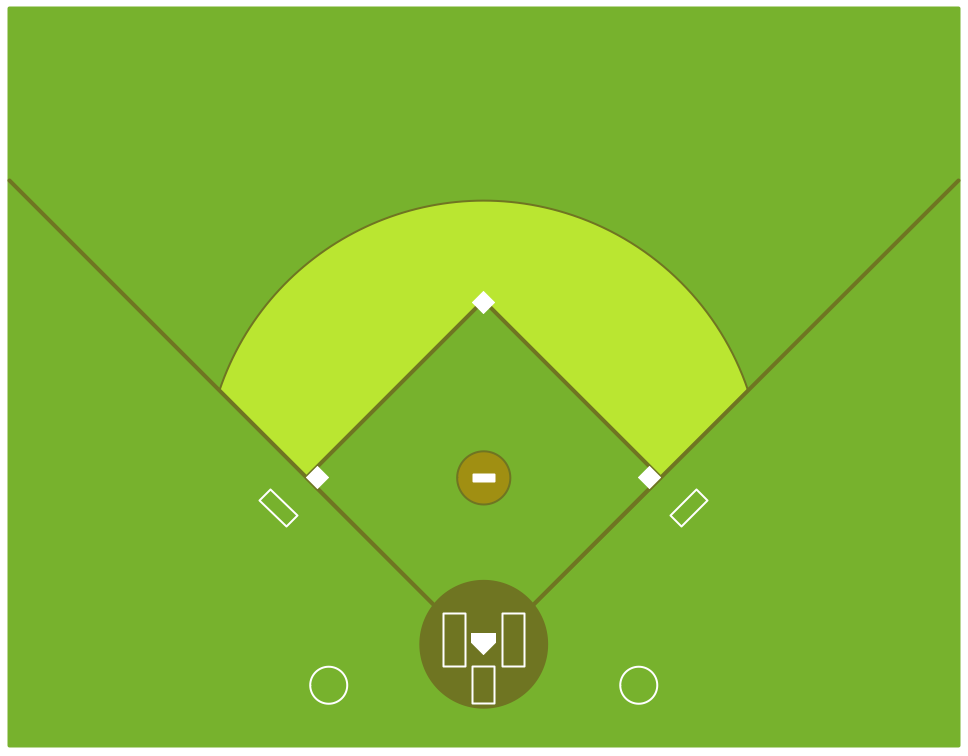
Sample 2. Baseball Field Sample
This diagram was created in ConceptDraw DIAGRAM using the "Baseball Fields" library from the Baseball solution. An experienced user spent 20 minutes creating this sample.
The sample you see on this page was created in ConceptDraw DIAGRAM using the Baseball solution; it demonstrates a portion of the solution's capabilities and the professional results you can achieve.
All source documents are vector graphic documents. They are available for reviewing, modifying, or converting to a variety of formats (PDF file, MS PowerPoint, MS Visio, and many other graphic formats) from the ConceptDraw STORE. The Baseball Solution is available for all ConceptDraw DIAGRAM or later users.