Infographic Software
Making infographics with the help of ConceptDraw DIAGRAM diagramming and drawing software as well as Pictorial Infographics Solution downloaded from ConceptDraw STORE can be a fun and entertaining process resulting in having only professional result looking simply smart.
Example 1. Infographic Software
Information graphics is sometimes called as “infographics”. It is a graphic visual representation of information, some knowledge or some data which is intended to present an information in a quick and clear way. Such drawings can improve the cognition in a way of utilizing graphics in order to enhance the human visual system’s ability to see the trends as well as patterns. Similar pursuits can be the following: information visualization, statistical graphics, data visualization, information architecture or information design.
Information graphics have evolved becoming the one used for mass communication. It is usually designed with a fewer assumptions about the readers' knowledge base to compare to the other types of visualizations. The isotypes were used before infographics became popular conveying any taken information in a quicker as well as simpler way to the masses. Infographics have an increase of a number of free tools which are easy to use, making its creation available to lots of the current representatives of the population. Popular social media sites have also allowed spreading the individual infographics among lots of people all around the world. Such infographics are known to be widely and commonly used in the age of so-called “short attention span”.
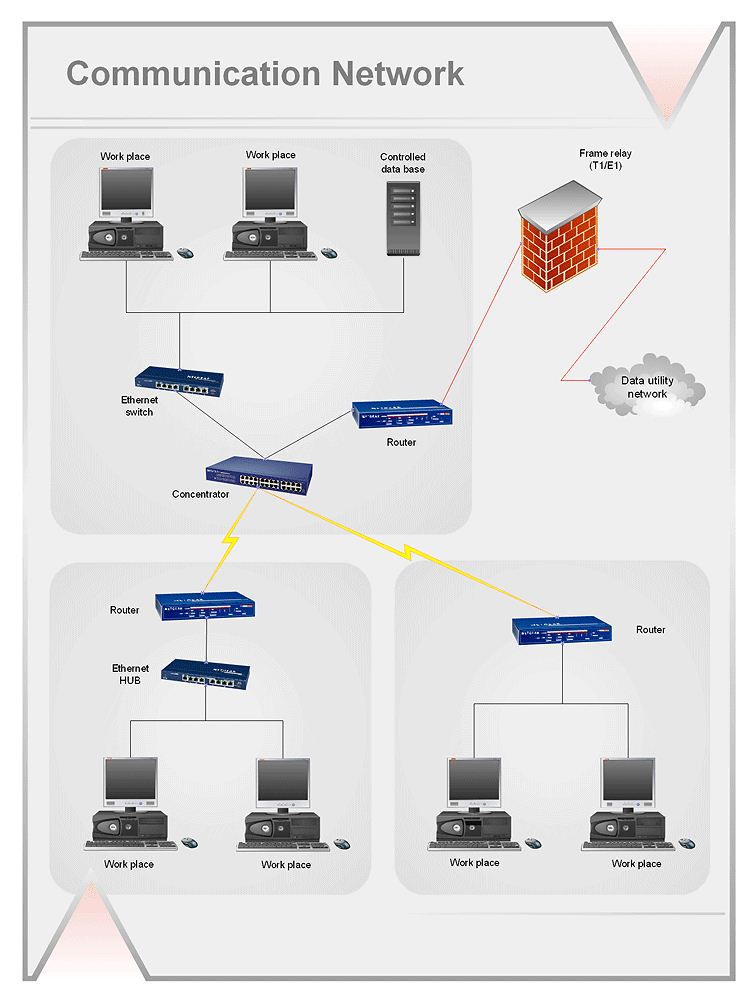
Infographics are commonly used for showing the weather, maps, site plans, charts, graphs for summarizing data, commonly used for newspapers. Modern maps, such as route maps in particular, use many different infographic techniques for integrating a variety of information, such as the conceptual layout of the transit network, local landmarks and transfer points.
Public transportation maps, used for metro, for example, such as the London Underground and the Washington Metro, are the well-known infographics which are widely used by the metro users. Different public places (e.g., transit terminals) are known to be having some sort of the integrated "signage system" with stylized maps and standardized icons.
Graphical displays are well-known for showing data, inducing their viewer to think about the substance, but not about the methodology, the technology of graphic production, graphic design, etc., avoiding the distorting what exactly each of the parts of the data is to say. The infographics are used for presenting lots of numbers within only a small space, making large data sets coherent as well as encouraging the eye to compare different pieces of information.
Revealing the data at the several levels of detail (from an overview up to the fine structure), infographics are known to be serving a reasonably clear purpose: description, tabulation, exploration, decoration, etc. Being closely integrated with both verbal and statistical descriptions of a data set, infographics becomes more and more popular, revealing data in a graphical way. Sometimes graphics can be more revealing and precise than some of the statistical conventional computations.
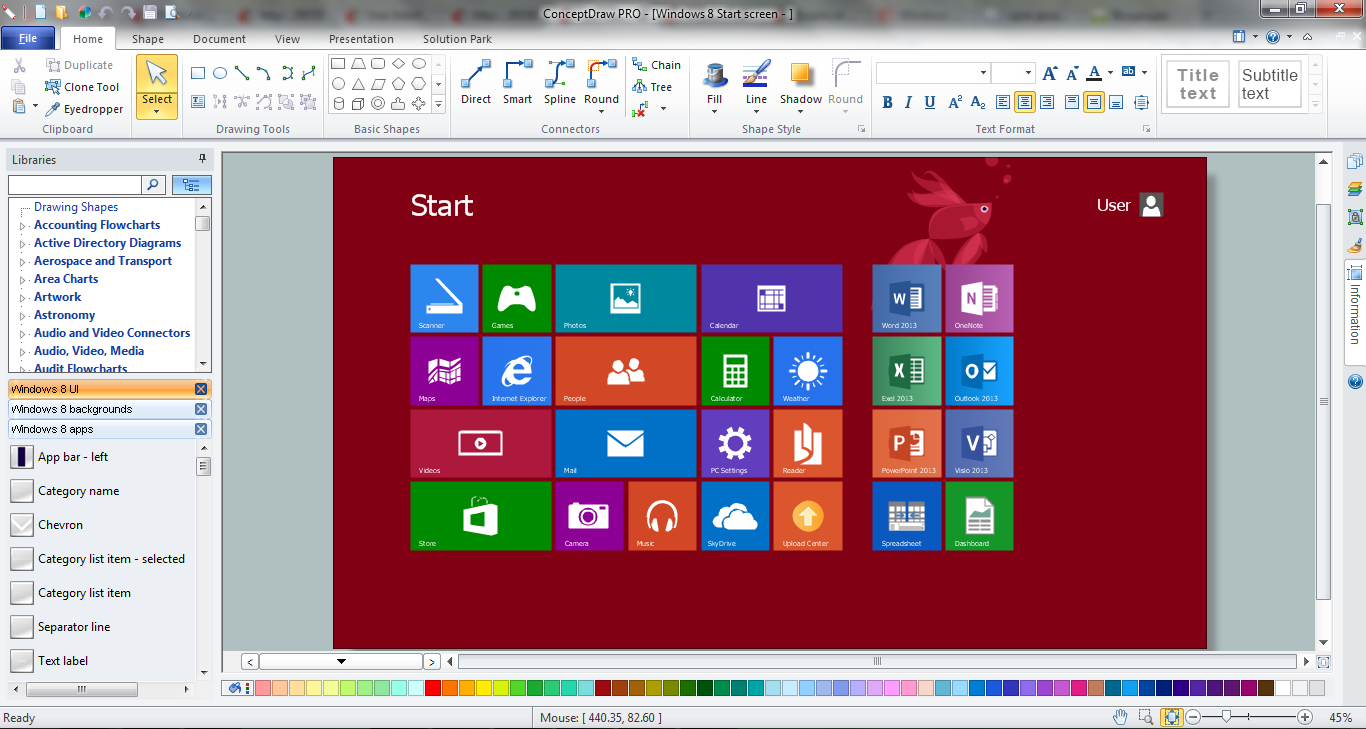
Infographics are used for condensing some large amounts of information into some definite form so it becomes simpler to absorb it by the reader. It can always be created by hand using simple everyday tools such as pencils, markers, graph paper, rulers, etc, but nowadays it is much better and easier to have one of the best drawing applications such as ConceptDraw DIAGRAM one.
Nowadays, information graphics are more often created with a usage of a computer software, such as ConceptDraw DIAGRAM one, and having one of the solutions available to be downloaded from ConceptDraw STORE, it can be much simpler to make a needed infographics, which will look simply smart and professional done within only a few minutes. Thus, downloading Pictorial Infographics Solution from ConceptDraw DIAGRAM is both easier and faster, so by getting it you are ensuring yourself in having a professionally looking result within only a few minutes.

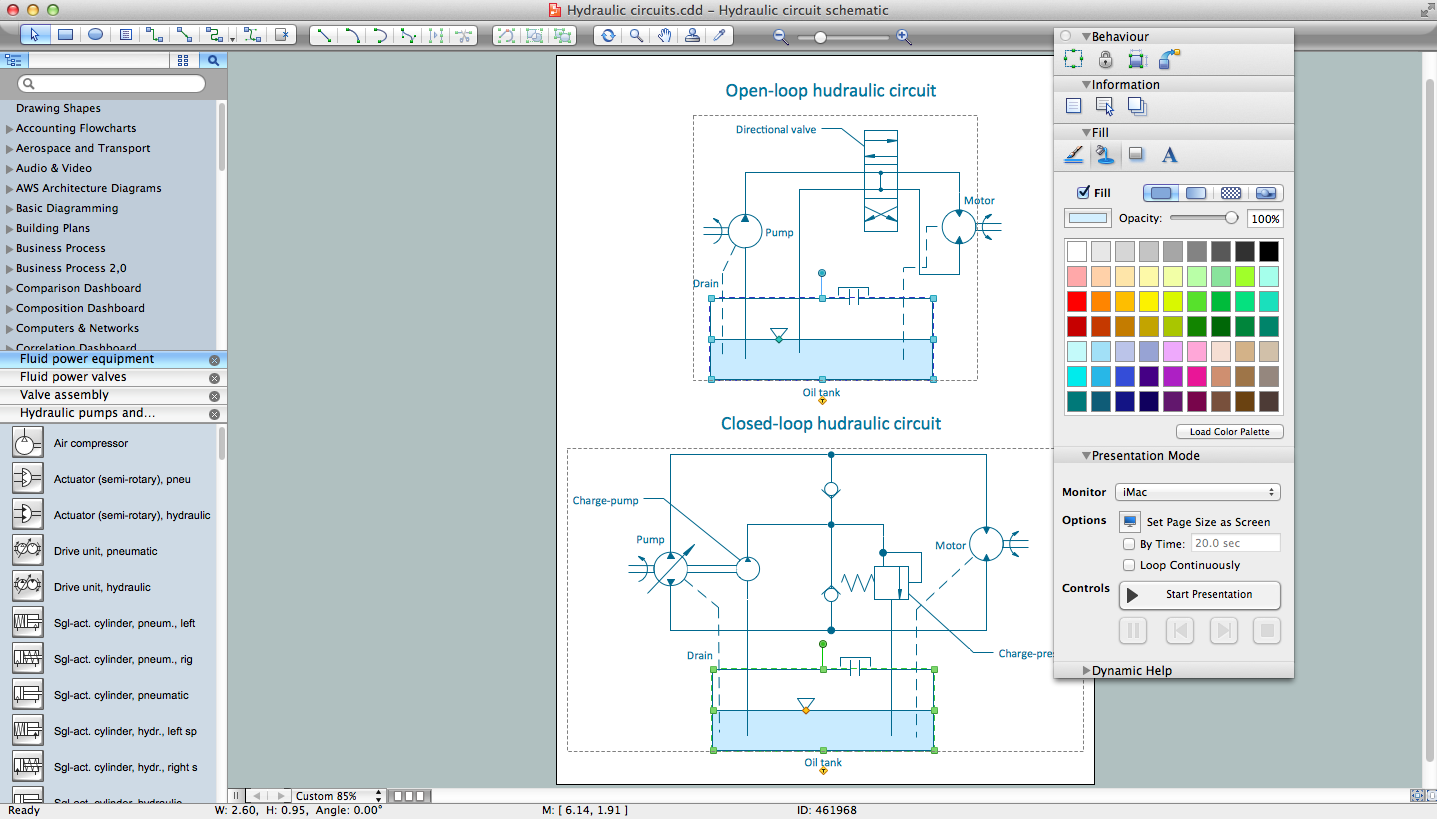
Example 2. Pictorial Infographics Solution in ConceptDraw STORE
Pictorial Infographics Solution includes 10 stencil libraries full of design elements (over 197), such as representations on Man, Woman, Child, Man pushing the shopping trolley, Joyful man, Old man, Sitting man reading, Man in wheelchair, Man photographing, Man sitting on the floor, Man kneeling, Winner, Man lying under parasol, Man cooking, Man throwing garbage into a trash can, Man carrying a box, Man exit, Man climbing stairs, Man on a bicycle/cyclist, Running man, Tractor, Forklift truck, Locomotive, Train, Subway, Tow truck, Balloon, Helicopter, Aircraft, Plane, Rocket, Aerial tramway, Car, Taxi, Bus, Electric car, Tram, Truck, Trailer, Liner, Sailboat, Motorcycle, Bicycle, etc.

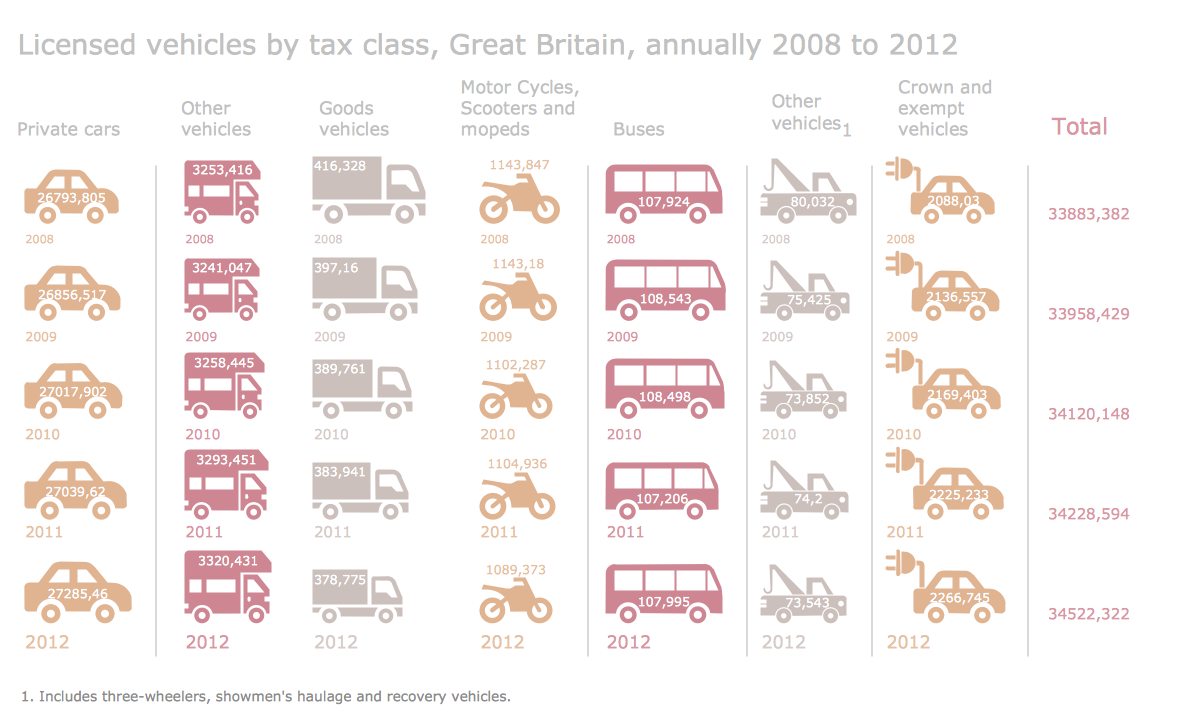
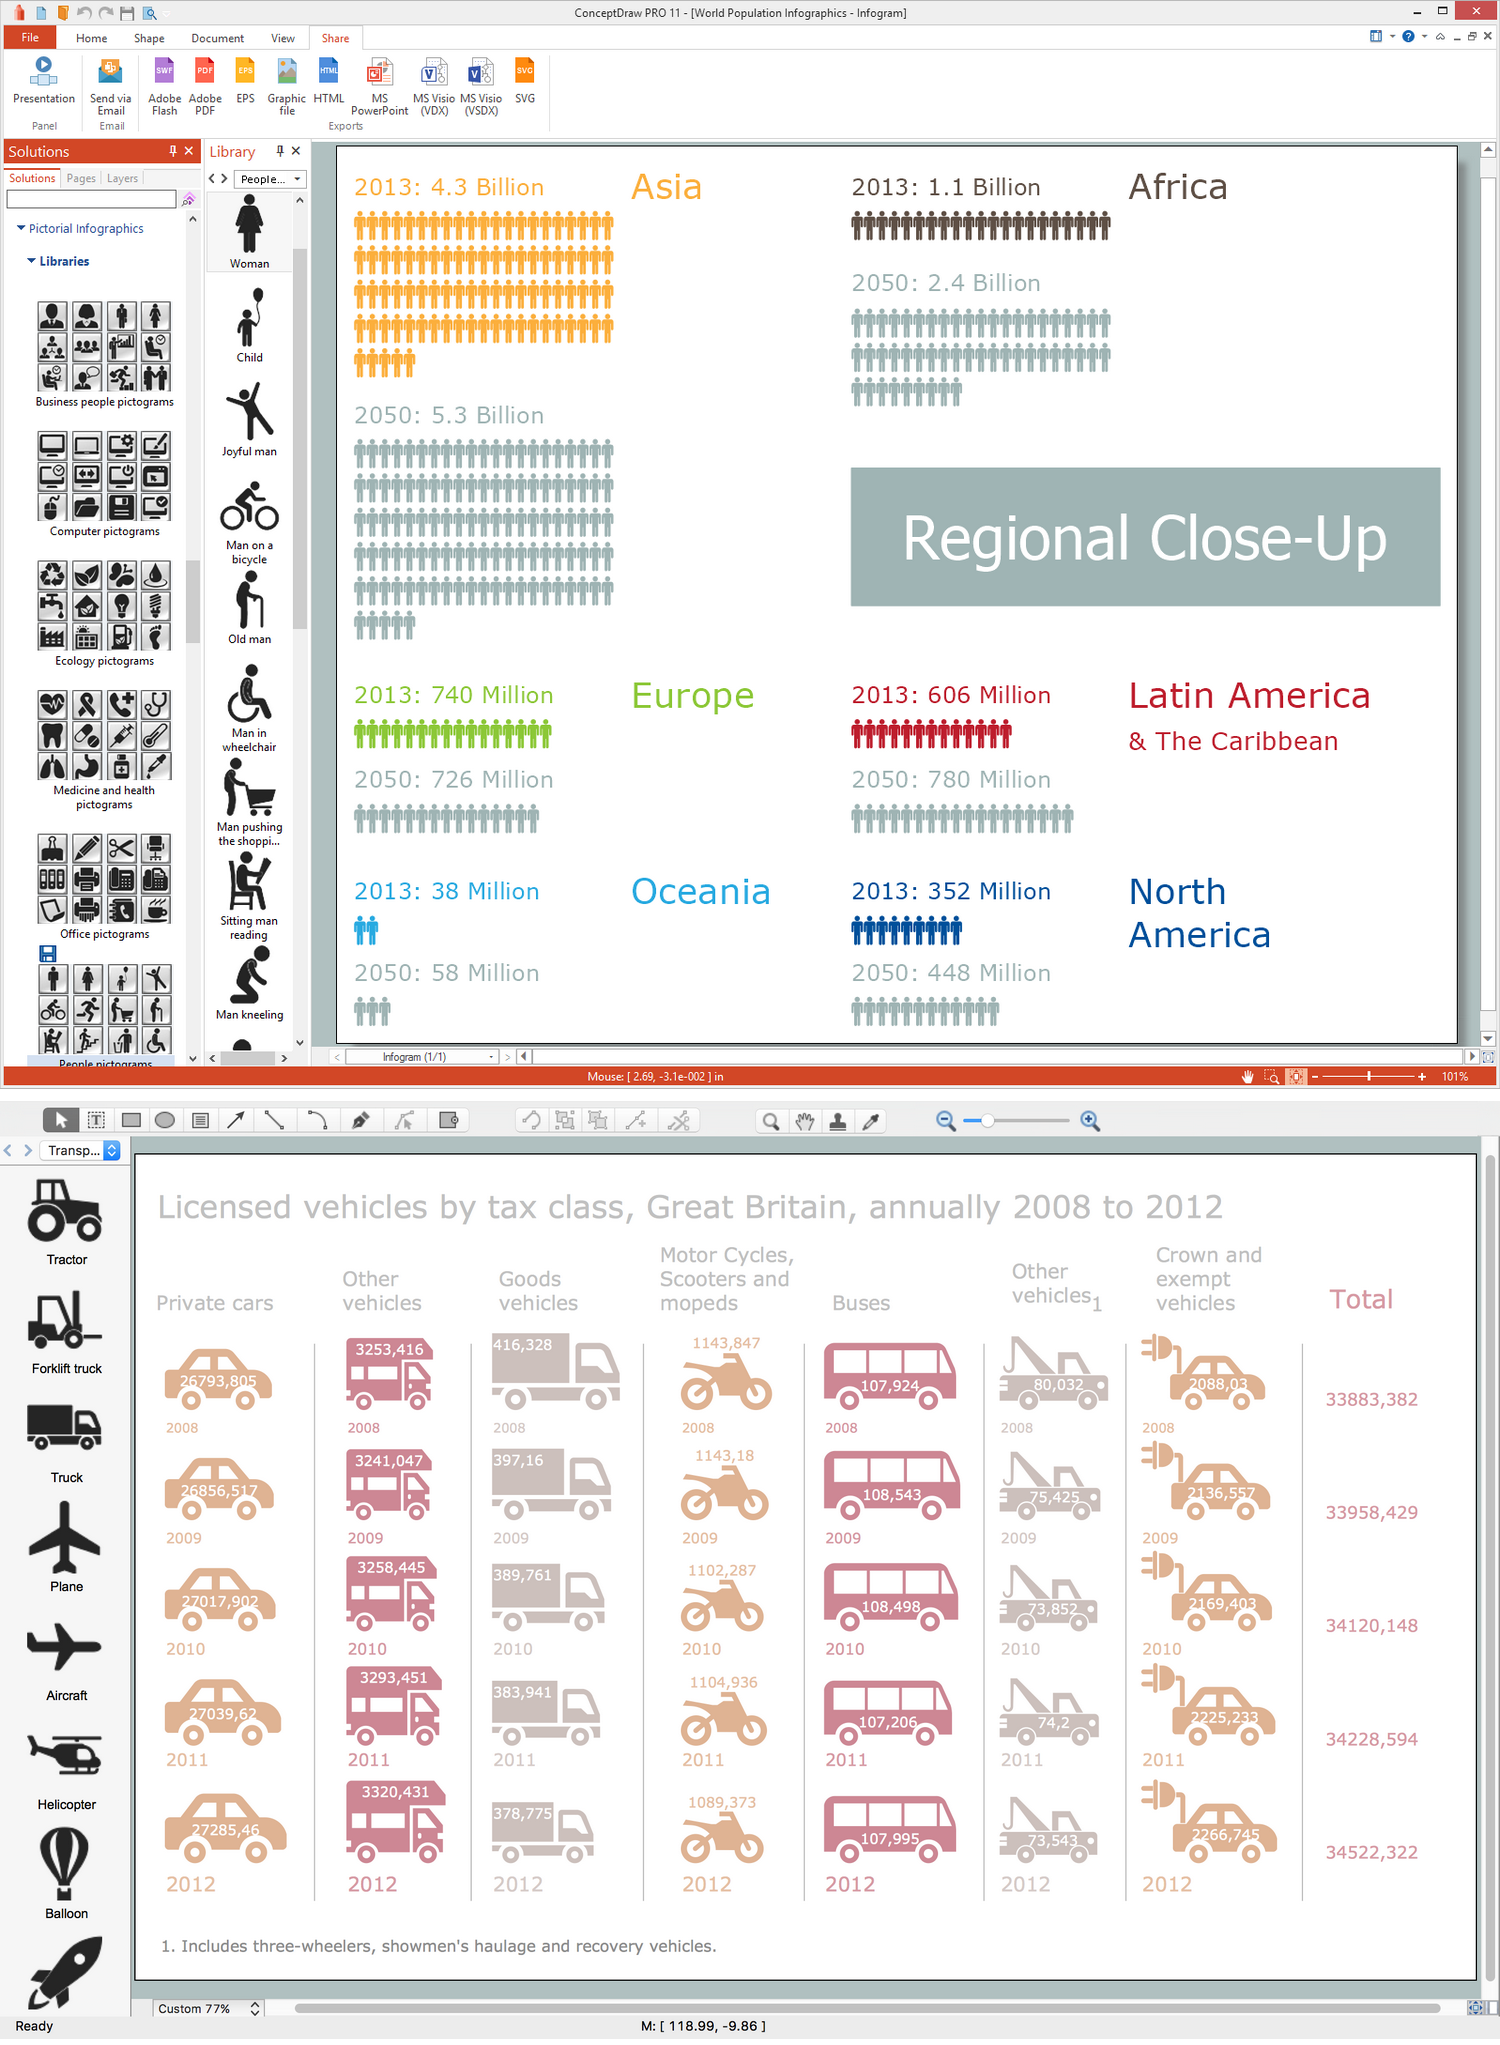
Example 3. Pictorial Infographics — Small Business Statistics UK 2013
There are many templates in the mentioned solution which can be always used to get users started on their diagrams so all the ConceptDraw DIAGRAM users get an opportunity to make their own drawings based on the existing samples. The templates are available for all the ConceptDraw DIAGRAM users giving a chance to make a Pictorial chart about Computer and Internet use in the United States, the one illustrating the world population, another one having the licensed vehicles by tax class in Great Britain annually (2008-2012) represented. Other examples are: Pictorial chart — small business statistics (UK 2013), illustrating the growth in percentage, and another pictorial chart called “Tourism in the world” with the key figures mentioned, such as percentages of GDP (direct, indirect and induced impact), the world export in percentages, export in the USD as well as services export in percentages.
Additionally, the ConceptDraw DIAGRAM diagramming and drawing software allows its users to export the created diagrams to other applications.