Sample 1. Design elements - Continent and country maps.
Solution Spatial Infographics from ConceptDraw Solution Park extends ConceptDraw DIAGRAM ector diagramming and business graphics software with easy-to-use spatial infographics drawing tools.
This solution contains spatial infographics samples, map templates to be filled in, and libraries of vector stencils for main design elements of spatial infographics.
Use this solution to draw your own geospatial infographics documents with thematic maps, road maps, directional maps and transport maps.
SEVEN RELATED HOW TO's:
ConceptDraw DIAGRAM is a powerful tool that helps you create professional looking cross-functional flowcharts with the well-designed objects. ConceptDraw DIAGRAM - Drawing Software for Vertical Cross Functional Flowchart. ConceptDraw allows you to focus on work, not the drawing process. ConceptDraw Arrows10 Technology allows to draw connectors with smart behavior that gives flexibility to you during work process.
Picture: Vertical Cross Functional Flowchart
ConceptDraw DIAGRAM is a software for making infographics illustrations. You can work with various components to build really impressive and easy-to-understand infographics design.
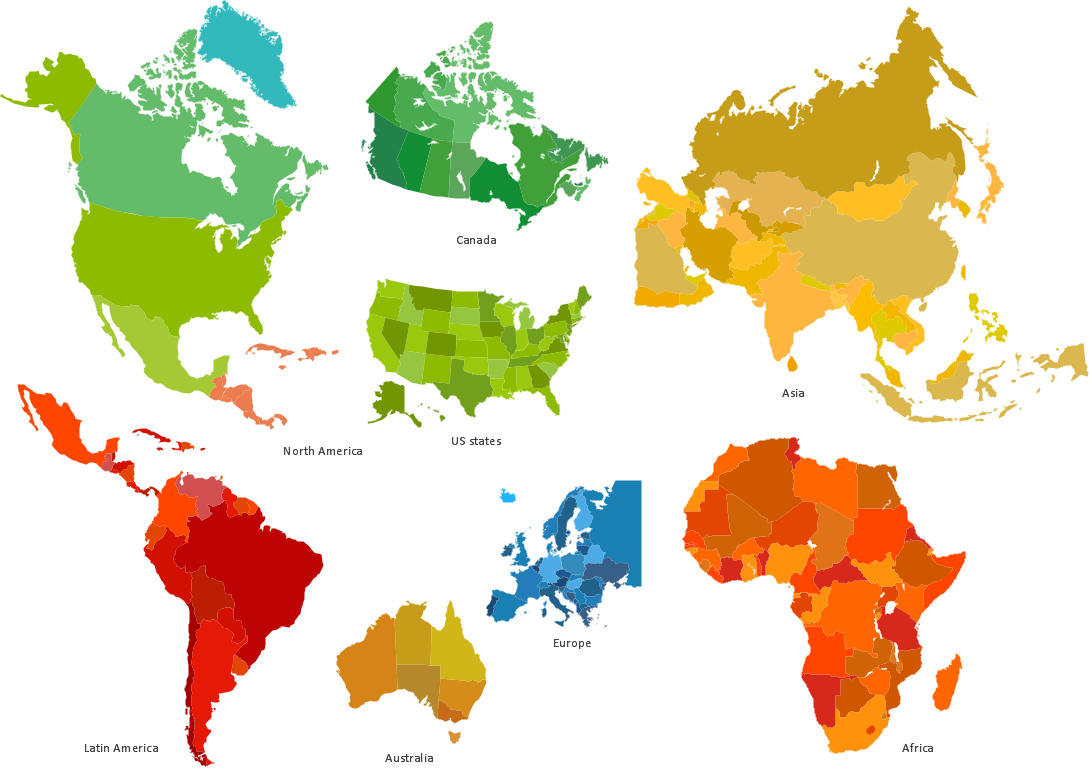
Picture: Spatial infographics Design Elements: Continental Map
Illustrate the Asia continent and explore its parts, geographical features, resources, and economic development through designing various kinds of colorful Asia maps and using them in presentations, reports, educational materials, websites, business documents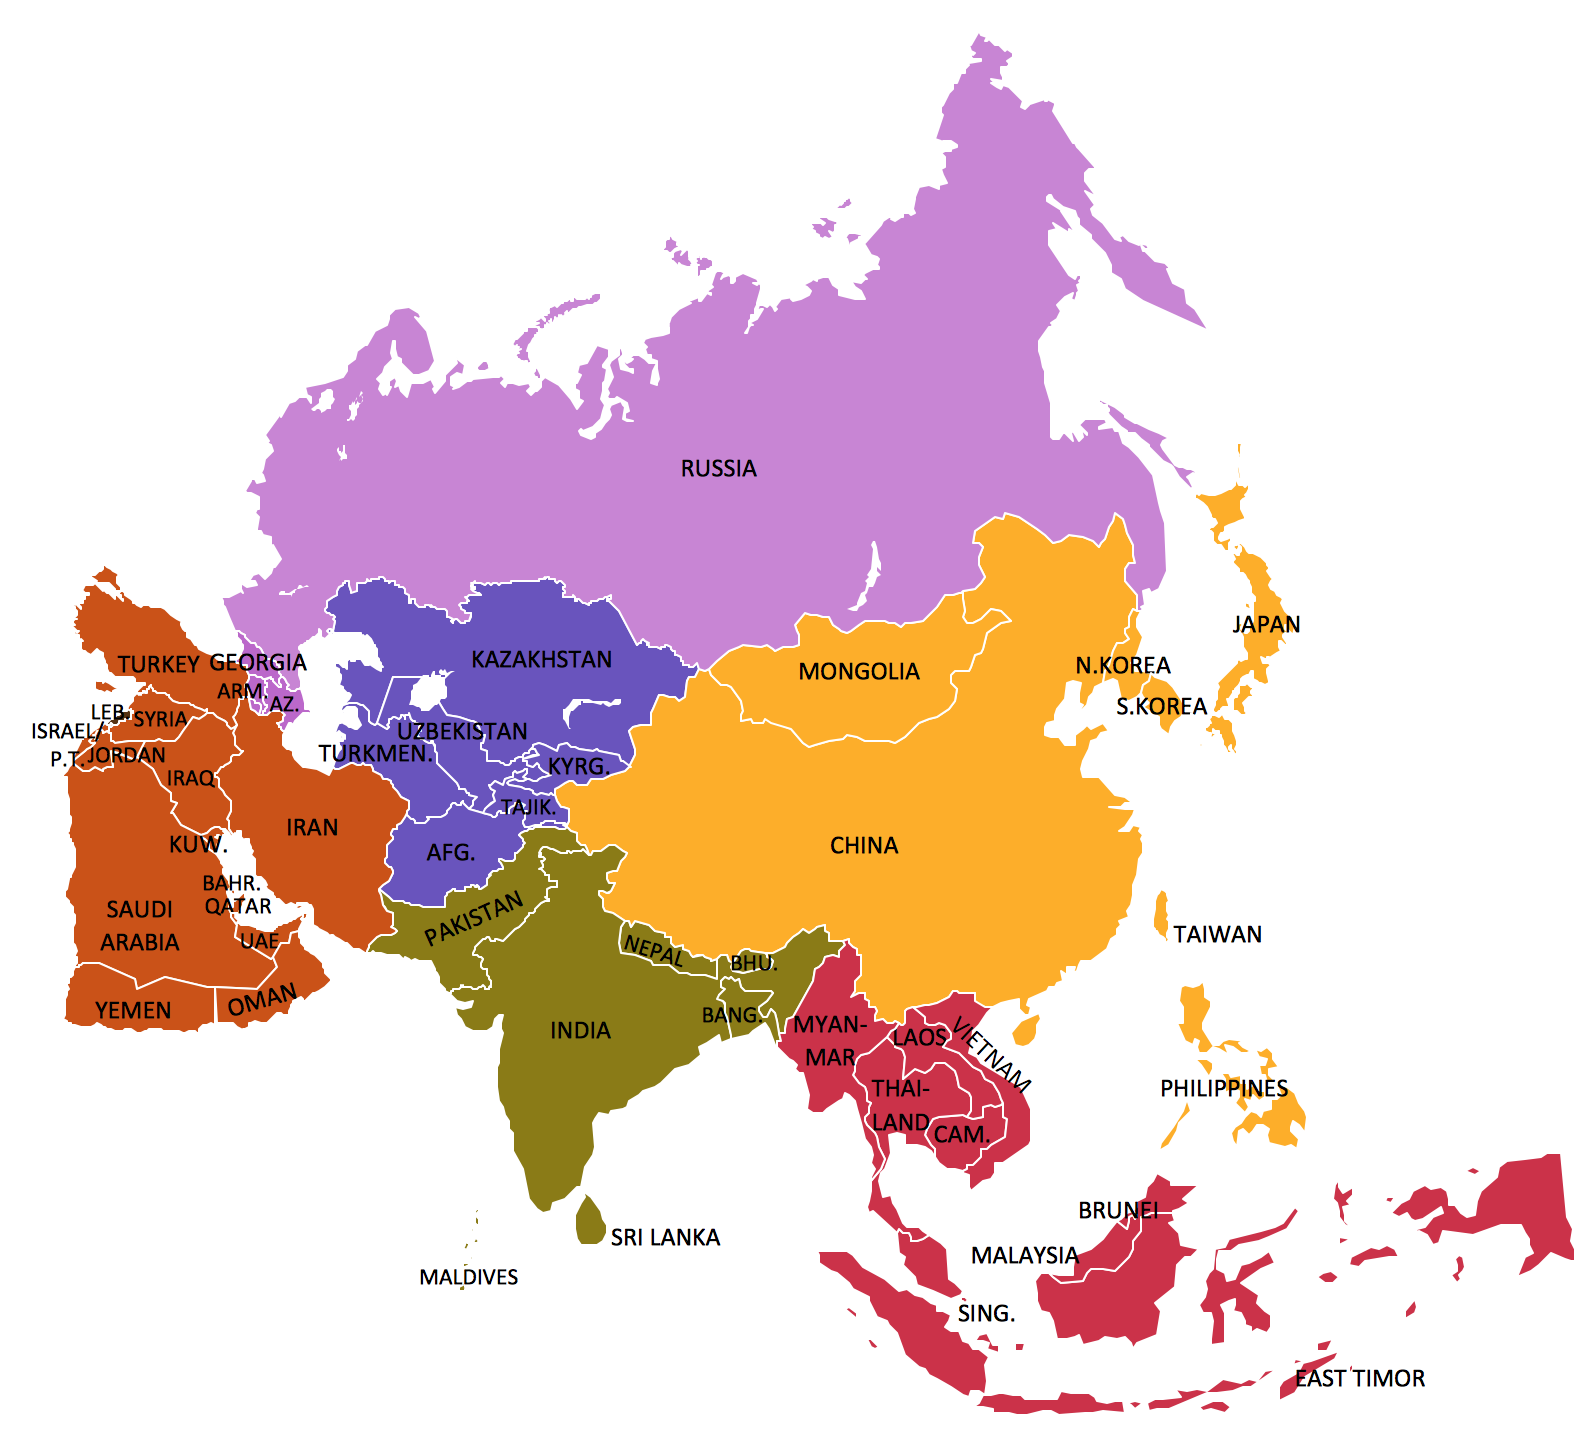
Picture: Geo Map — Asia
Related Solution:
Designing of Continents Map is a quite complex and labour-intensive process. But now we have a way to make it easier - ConceptDraw DIAGRAM diagramming and vector drawing software extended with useful drawing tools of Continent Maps Solution from the Maps Area.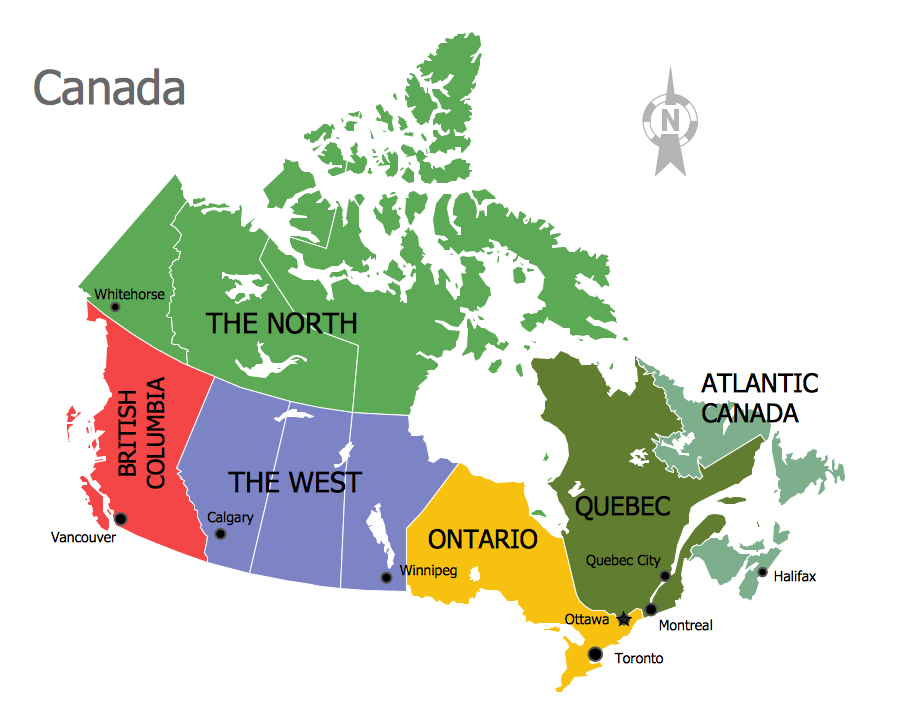
Picture: Continents Map
Related Solution:
Creating Travel infographics is super-easy with ConceptDraw.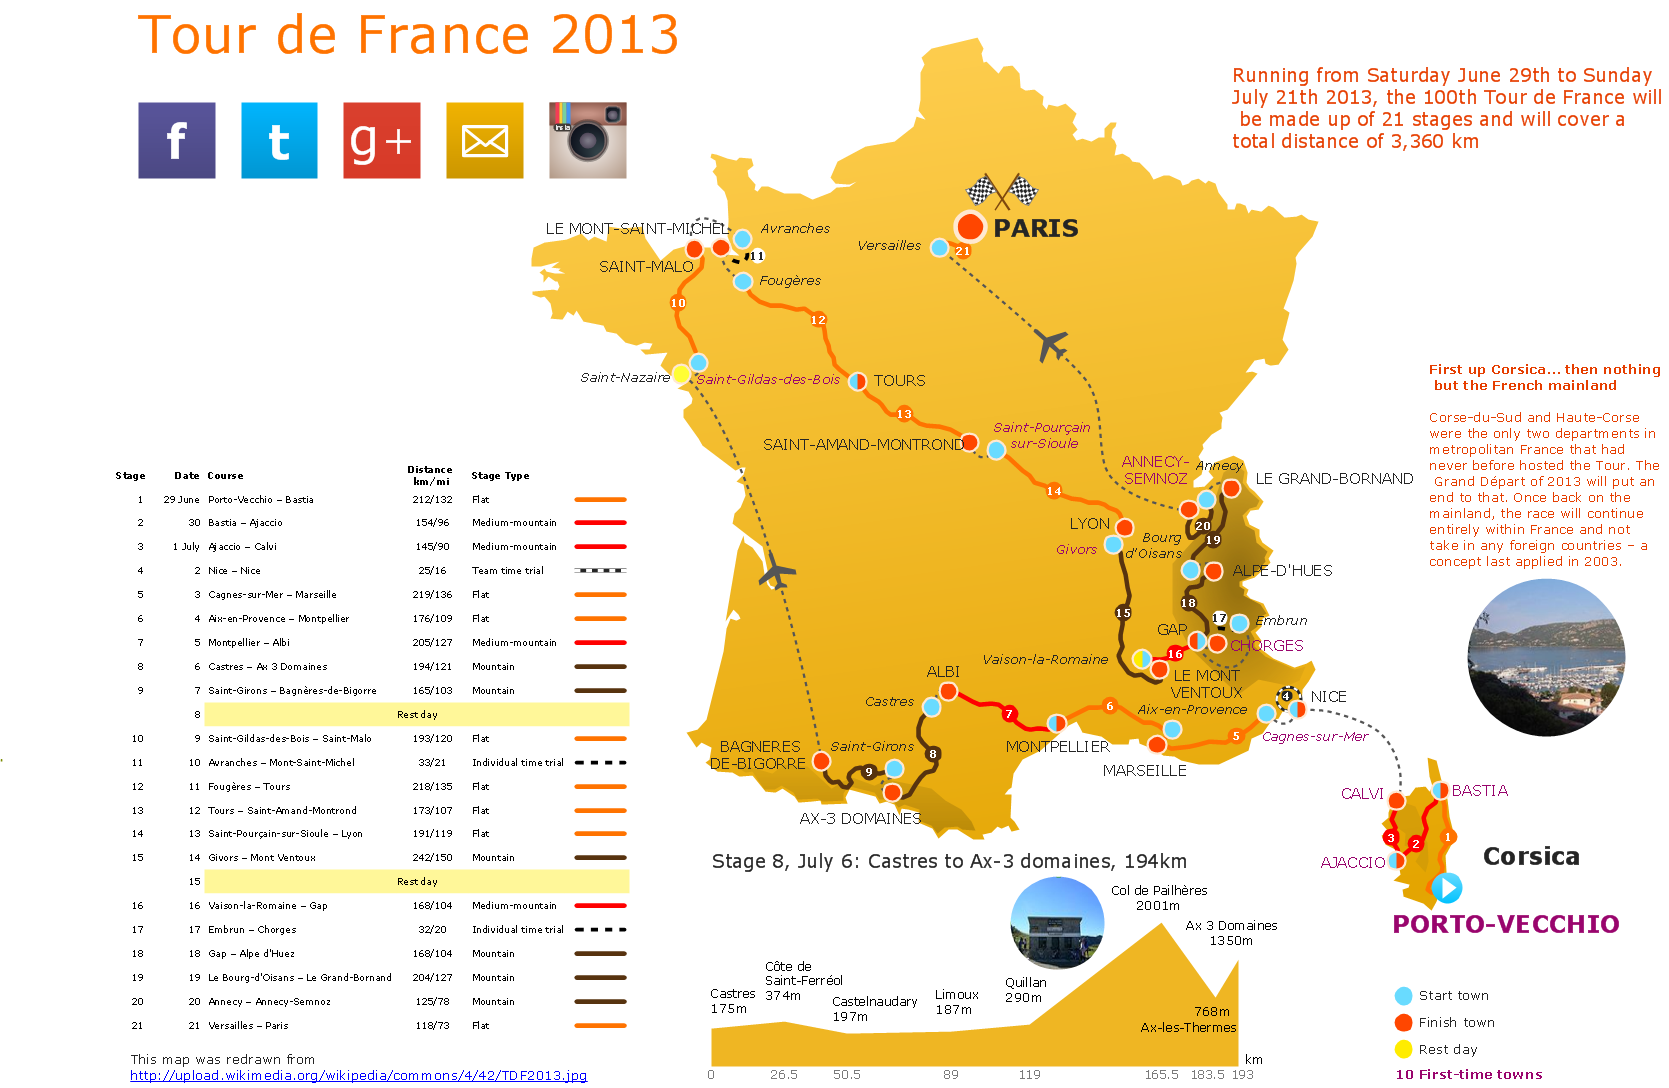
Picture: Travel Infographics
Virginia, officially the Commonwealth of Virginia, is a U.S. state located in the South Atlantic region of the United States.
The vector stencils library Virginia contains contours for ConceptDraw DIAGRAM diagramming and vector drawing software. This library is contained in the Continent Maps solution from Maps area of ConceptDraw Solution Park.
Picture: Geo Map — USA — Virginia
Related Solution:
These vector illustrations and cliparts are created for drawing the Project management Illustrations and contain plenty of project management design elements. The clipart library Project management includes 35 icons.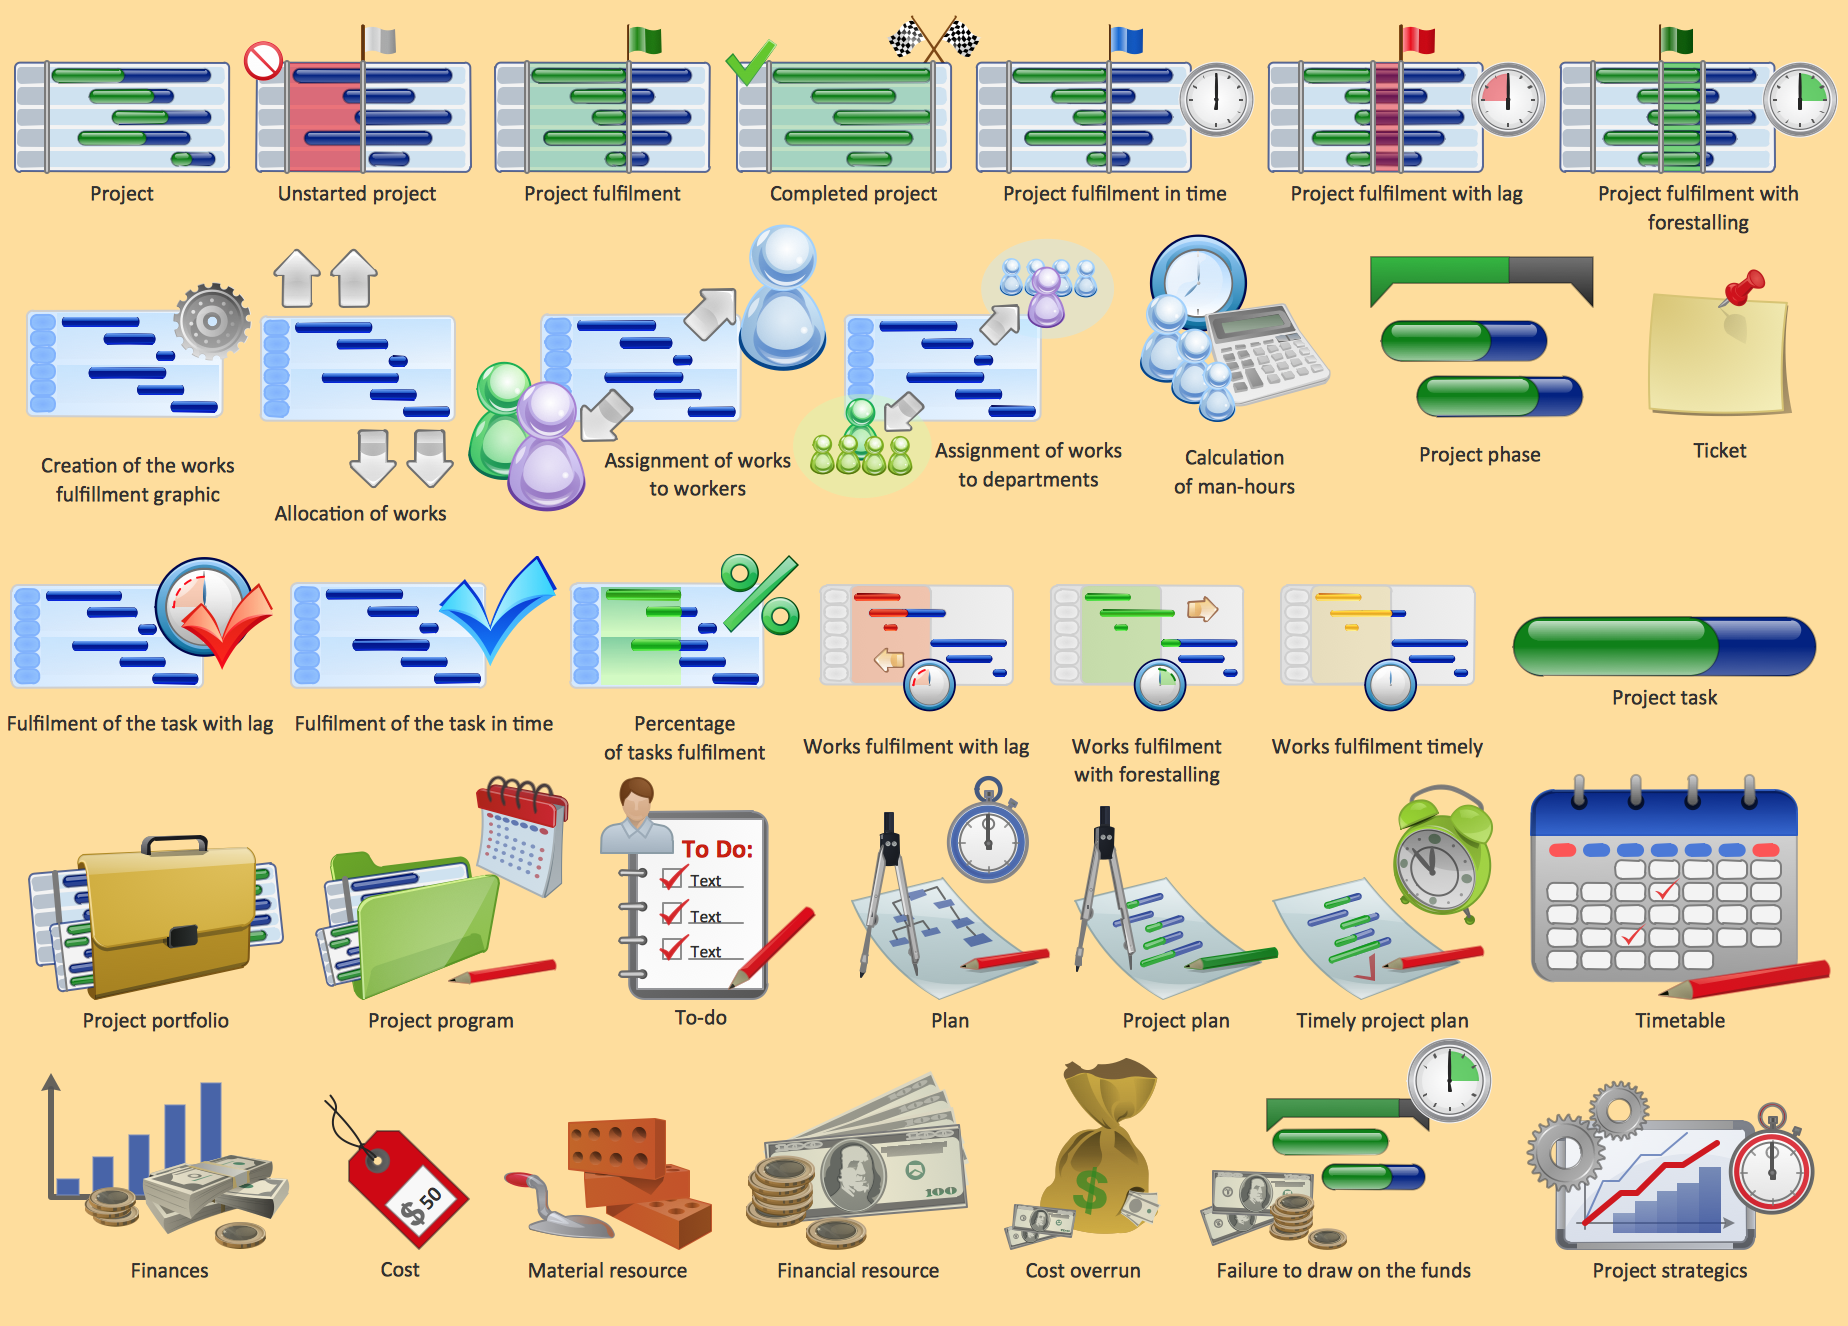
Picture: Project management - Design Elements
Related Solution: