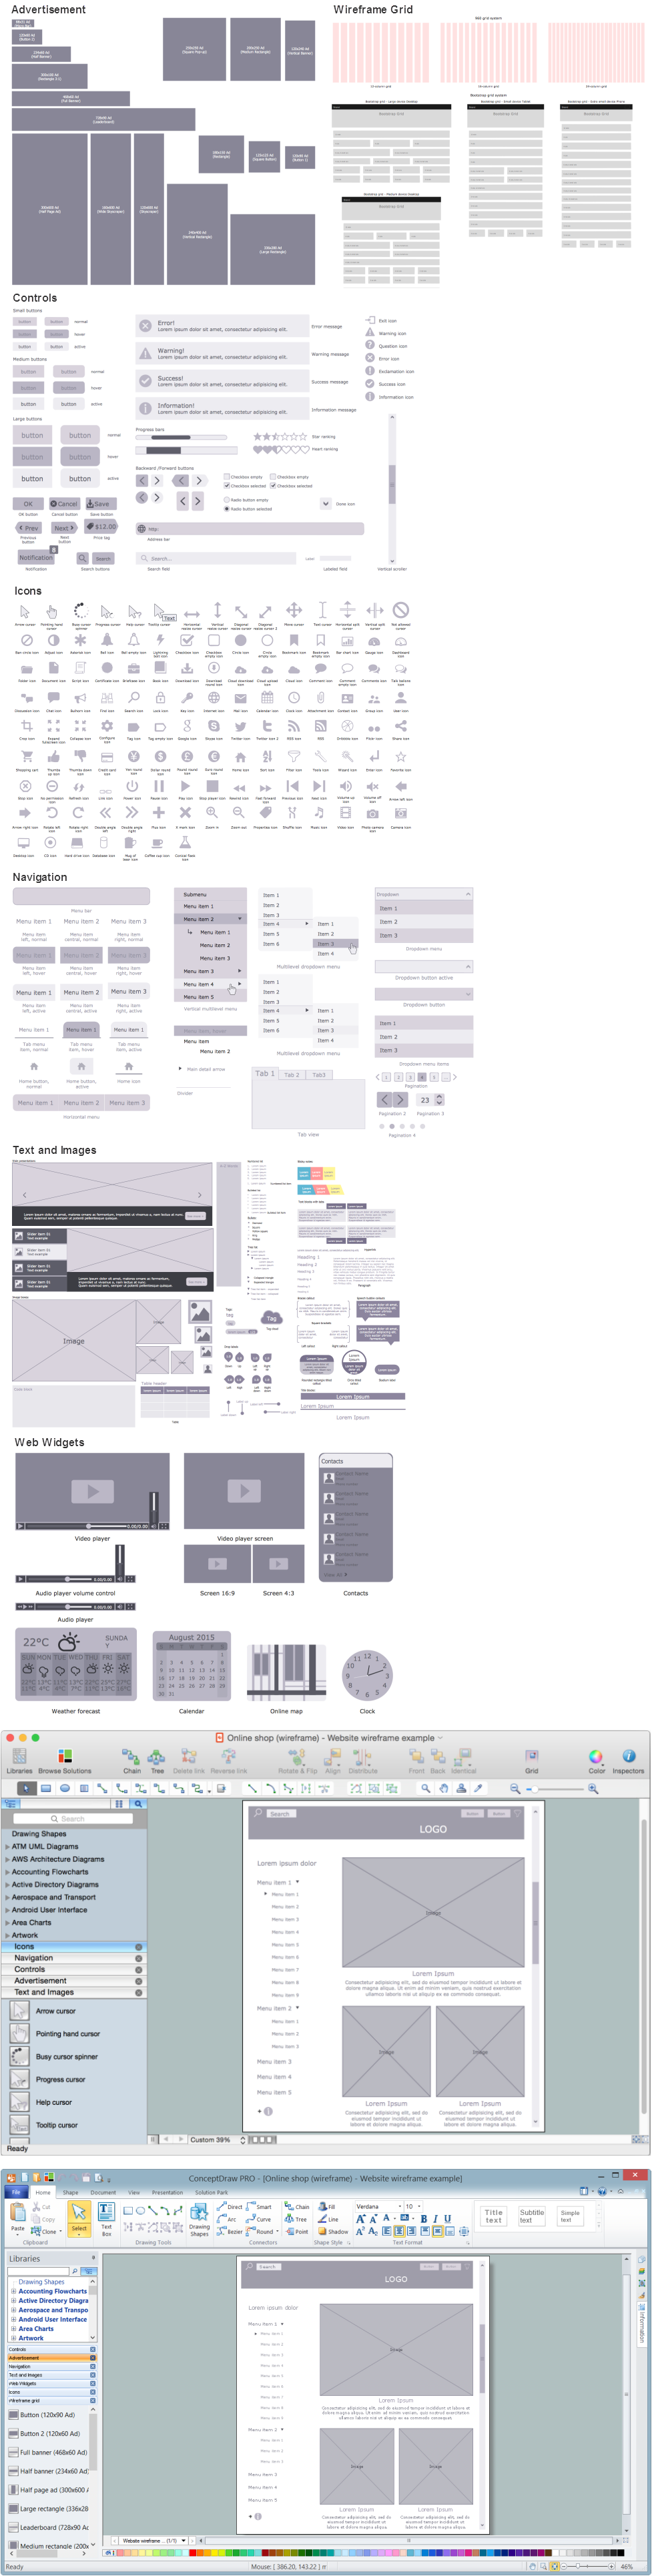
Example 1. Interface Design. Design Elements — Online Shop Wireframe for Apple OS X and Windows
Thanks to Website Wireframe Solution for ConceptDraw DIAGRAM software you can concentrate fully on the development professional site wireframe, effective planning site structure and successful interface design, because now at your disposal are 7 libraries:
- Advertisement
- Controls
- Icons
- Navigation
- Text and Images
- Web Widgets
- Wireframe Grid
All they are included in Website Wireframe solution and contain 275 predesigned vector objects. For creating a wireframe, create a new document, choose desired objects from this diversity and simply drag in it on the needed places.

Example 2. Website Wireframe Solution in ConceptDraw STORE
Another way of drawing in ConceptDraw DIAGRAM is to use the predesigned template or sample as the base. You can find all wireframe examples, samples and template included in Website Wireframe Solution in ConceptDraw STORE.

Example 3. Interface Design - Multi-Author Blog Wireframe
The samples you see on this page were created in ConceptDraw DIAGRAM software using the Website Wireframe Solution for ConceptDraw DIAGRAM Solution Park. An experienced user spent 15 minutes creating each of these samples.
Use the interface design tools of Website Wireframe Solution for ConceptDraw DIAGRAM software to create your own attractive designs of websites fast, easy and effective.
All source documents are vector graphic documents. They are available for reviewing, modifying, or converting to a variety of formats (PDF file, MS PowerPoint, MS Visio, and many other graphic formats) from the ConceptDraw STORE. The Website Wireframe Solution is available for all ConceptDraw DIAGRAM users.
TEN RELATED HOW TO's:
Unfortunately, a man can’t predict the future and no one is safe from natural disasters, such as floods, earthquakes, hurricanes or fires. Nonetheless, what you can do to ensure safety for you and your relatives is to create an emergency plan, so everyone will know what to do if emergency happens. Keep that plan simple and train it several times a year so that no one could forget any details of it.
Fire and emergency plans are important to supply people with a visual safety solution. This diagram presents a set of standard symbols used to depict fire safety, emergency, and associated information. Using clear and standard symbols on fire emergency plans provides the coherence of collective actions , helps to avoid embarrassment, and improves communications in an emergent situation. The fire emergency symbols are intended for the general emergency and fire service, as well as for building plans ,engineering drawings and insurance diagrams. They can be used during fire extinguishing and evacuation operations, as well as trainings. It includes vector symbols for emergency management mapping, emergency evacuation diagrams and plans.
Picture: Emergency Plan
Related Solution:
AWS platform is great to develop reliable applications. If you are already aware of all the benefits that Amazon Web Services diagrams bring, then you'll need also a diagramming tool for architecture to share your vision. Luckily, ConceptDraw DIAGRAM has a special AWS Diagrams solution with vector icons and templates that are easy to edit.
The AWS architecture diagram, you see on this drawing, was designed using ConceptDraw Amazon Web Services Architecture Diagrams (AWS) solution. The 14 libraries, delivered with this solution introduces near 250 vector graphic images used to draw AWS Diagrams. The AWS Architecture Diagrams solution is a valuable tool for programmers, software architects and other IT professionals. It enables them to develop reliable applications with a high stage of interaction with AWS cloud.
Picture: Amazon Web Services Diagrams diagramming tool for architecture
Food courts are one of the most rapidly developing areas of the restaurant business. ConceptDraw DIAGRAM diagramming and vector drawing software offers a Food Court solution from the Food and Beverage area with wide capabilities for planning, design, developing and advertising of a Food Court.
Picture: Food Court
Related Solution:
The arrangement of tables and seating charts near them have great value in many premises and situations. It is often very convenient to draw a plan before the furniture arrangement. ConceptDraw DIAGRAM software offers the Seating Plans solution from the Building Plans area for fast and easy drawing the table seating chart template and samples.
Picture: Table Seating Chart Template
Related Solution:
Software development flourishes nowadays. Students have tons of educational information and courses that would fit every taste. And it's no secret that knowing how to draw data flow diagrams is a useful skill for a future software architect. The diagrams help a lot in understanding how to storage data effectively and how data processes within a system.
This data flow diagram represents the model of small traditional production enterprise. It was created using Yourdon and Coad notation. The data flow diagram include four main objects: entity, process, data store and data flow. Yourdon and Coad notation uses circles to depict processes and parallel lines to represent data stores. Dataflows are shown as arrowed lines. They are labeled with the description of the data that move through them. Dataflow's role is to deliver the pieces of information. A process's function is to transform. the input data flow into output data flow. ConceptDraw Data Flow Diagrams solution contains the data flow diagram symbols of both Yourdon-Coad and Gane-Sarson notations and a set of handy templates to get started with DFD.
Picture: Data Flow Diagrams
Related Solution:
A wireframe is a scheme of a future web page. Wireframe illustrates the web page structure, location and size of the main elements, as well as their interaction with the user. With such scheme designer defines the functionality of the page, not its appearance.
Picture: Wireframe Tools
Related Solution:
Collaboration software for small and medium business allows communicate with partners around the globe via Skype.
Picture: How to Collaborate in Business via Skype
Related Solution:
This sample was created in ConceptDraw DIAGRAM drawing software using the Flowcharts solution.
Picture: Horizontal Flowchart
Related Solution:
ConceptDraw DIAGRAM is a powerful diagramming and vector drawing software. Extended with Website Wireframe solution from the Software Development area, ConceptDraw DIAGRAM became the ideal software for prototype and design professional looking websites wireframes. Website Wireframe solution offers at your disposal wide variety of wireframe examples and samples which confirm this.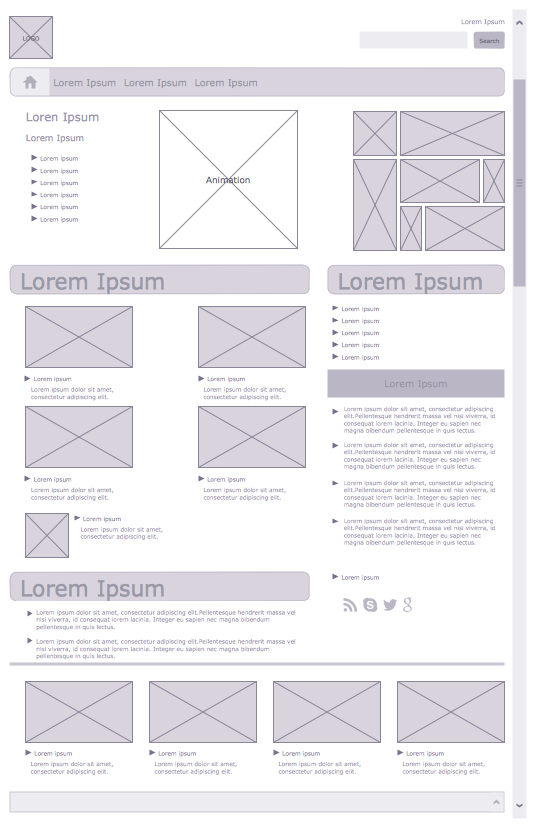
Picture: Wireframe Examples
Related Solution:
ConceptDraw - feature-rich flowchart software allows you create professional looking flowcharts.
Picture: Best Program to Create a Flowchart
Related Solution:

