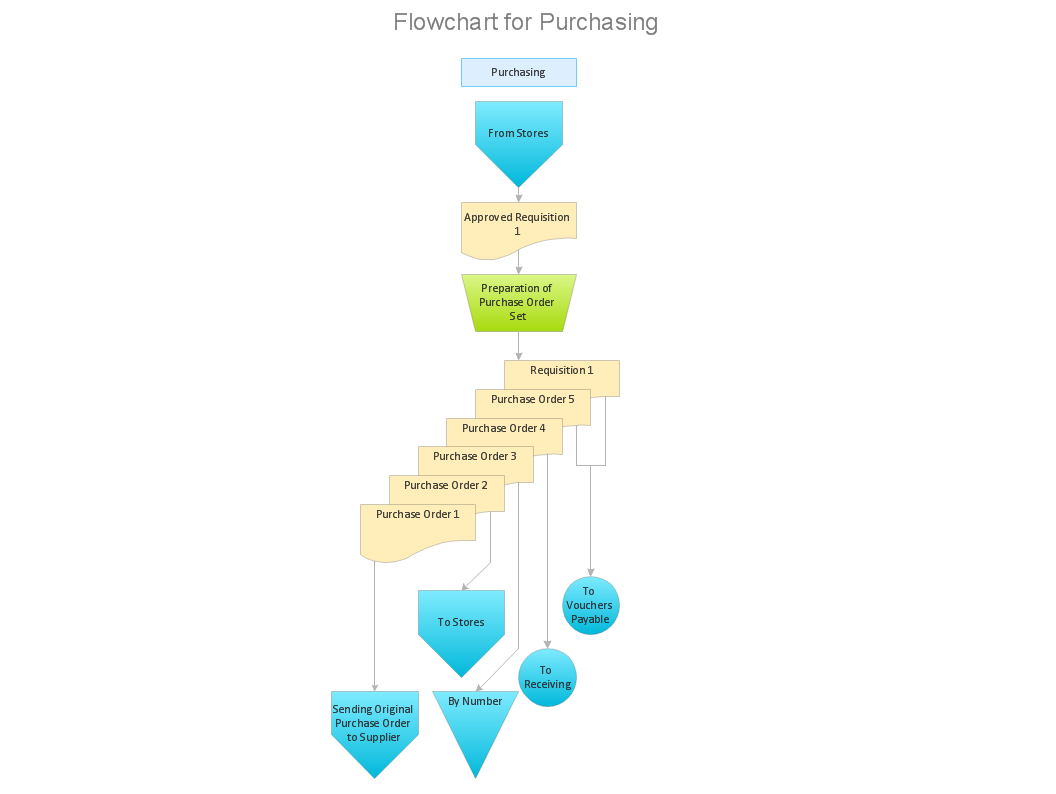
Flowchart Marketing Process.
Flowchart Examples
Marketing Processes Flowcharts are used for planning, design and distribution of print marketing materials by affiliate marketing representatives
This process includes budget creation, firm communications design, brochure approval and the final distribution of the marketing materials.
This sample was created in ConceptDraw DIAGRAM diagramming and vector drawing software using the Flowcharts solution from the "Diagrams" area of ConceptDraw Solution Park.

Example 1. Flowchart Marketing Process Solution
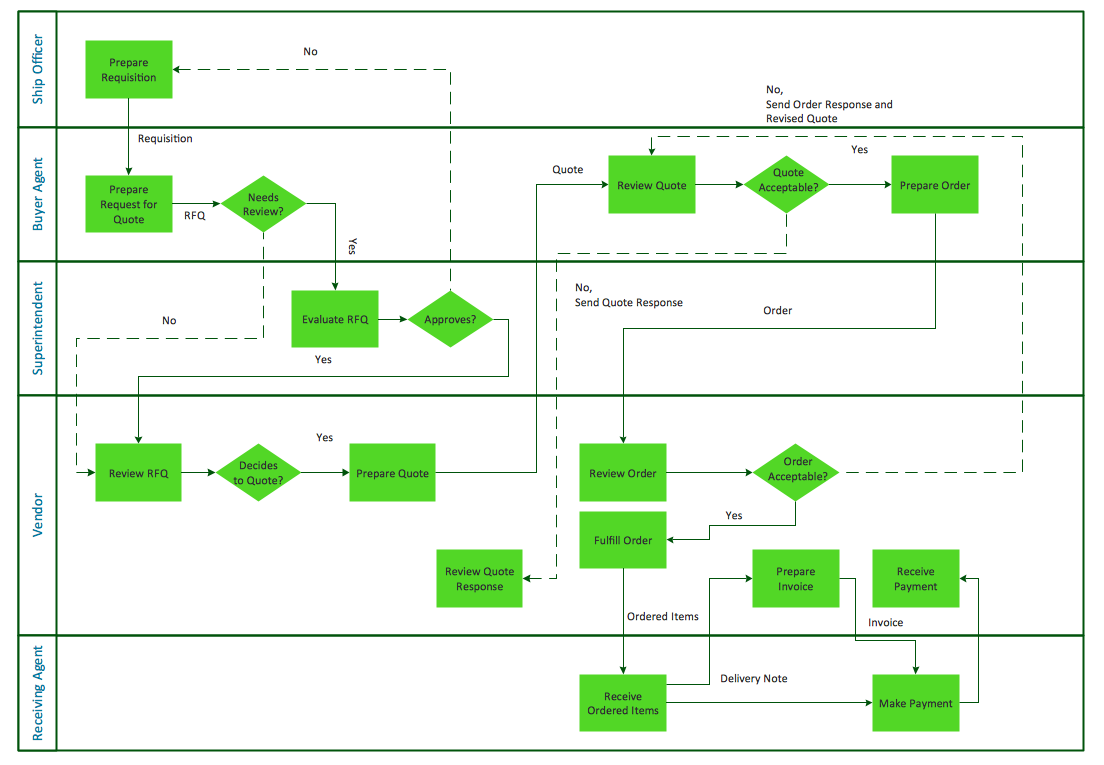
This sample shows the Flowchart that displays the layout and work flow of the cloud marketing platform. This diagram has a style of the marketing brochure. This style displays the central product that is related to the other issues.
The Flowcharts are widely used in:

Example 2. Flowchart Marketing Process. Cloud Marketing Diagram
This example was redesigned from the Wikimedia Commons file [commons.wikimedia.org]
Using the ready-to-use predesigned objects, samples and templates from the Flowcharts Solution for ConceptDraw DIAGRAM you can create your own professional looking Flowchart Diagrams quick and easy.
The Flowcharts produced with ConceptDraw DIAGRAM are vector graphic documents and are available for reviewing, modifying, and converting to a variety of formats (image, HTML, PDF file, MS PowerPoint Presentation, Adobe Flash or MS Visio).
See also Samples:
-
Flowcharts
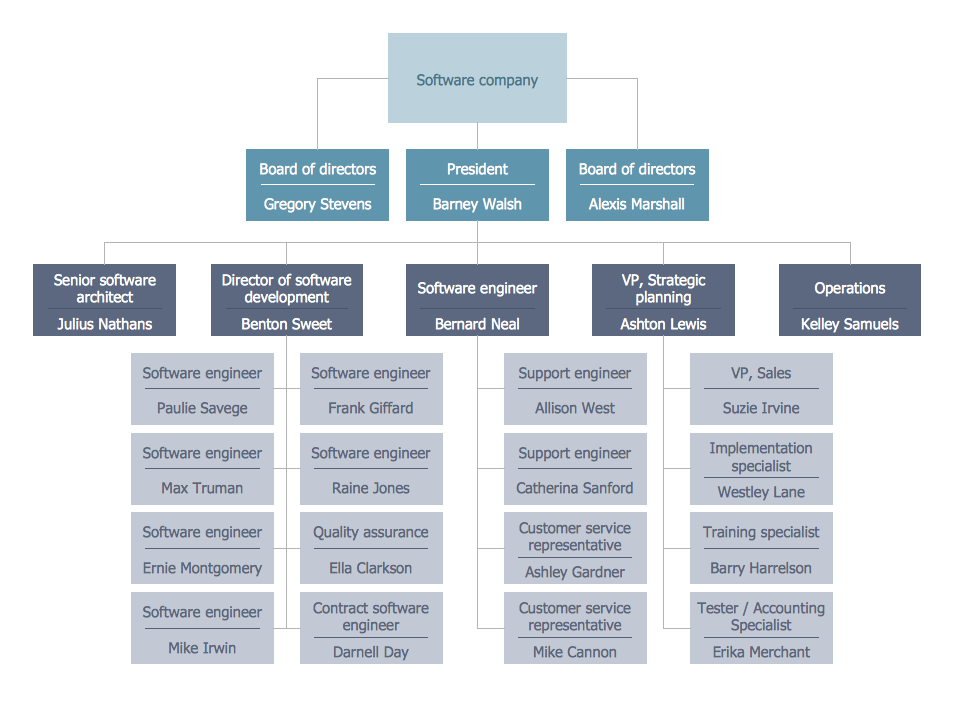
- Orgcharts
- Business Charts — Area, Line and Scatter
- Marketing — Charts & Diagrams
- Quality and Manufacturing Charts
- Business Process Diagrams — Flow Charts
- Marketing — Flowcharts & Process Diagrams
- Business Diagrams — Concept Maps
- Business processes — Flow charts
- Marketing — Flowcharts and Process Diagrams
- Finance and Accounting
- Marketing — Social Media
- Business Diagrams
- Orgcharts