Risk Analysis
Management and Planning tools
ConceptDraw OFFICE suite is a software for decision making. The Seven Management and Planning Tools is a tool for Risks Diagram drawing. This diagram identifies possible risks in accomplishing corrective actions. With the Risks Diagram, one analyzes each action separately in a tree of all actions and develops a preventive action in response of each potential obstacles or circumstances which may be a risk.
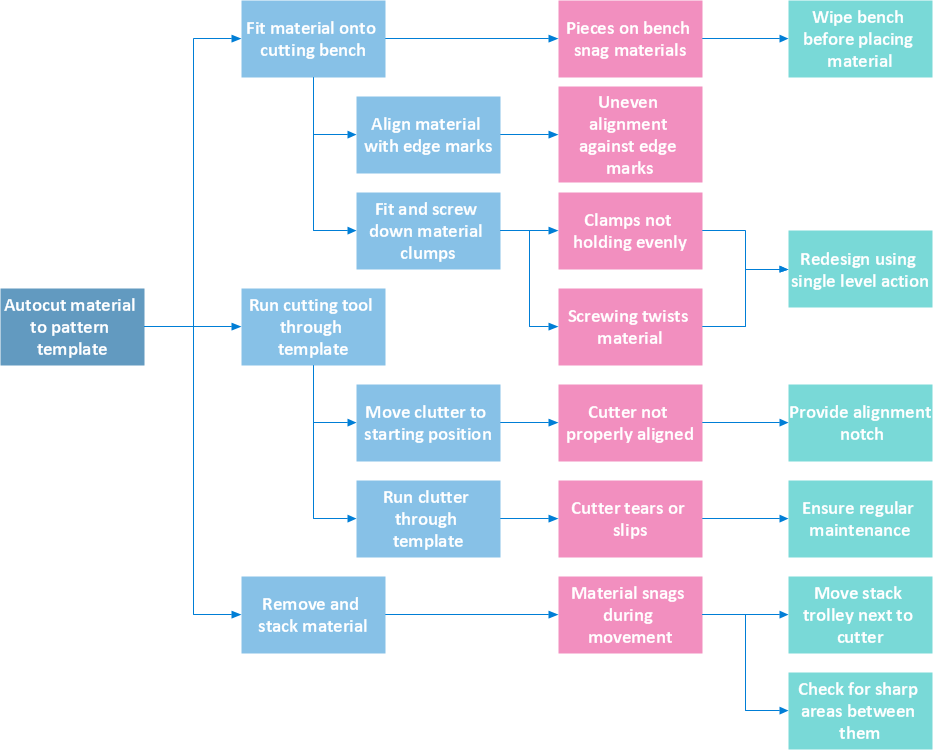
Pic.1 Risk Analysis. Process decision program chart (PDPC) - Minimization of material wastage.
The Risk diagram (Process Decision Program Chart) determines the risks when corrective action is not performed correctly. Also, it helps develop descriptions for preventive actions at the level of execution.
See also:
TEN RELATED HOW TO's:
ConceptDraw DIAGRAM diagramming and vector drawing software extended with Marketing Diagrams Solution from the Marketing Area of ConceptDraw Solution Park is the best software for quick and easy creating Marketing Flow Chart of any complexity and design.
Picture: Marketing Flow Chart
Related Solution:
It doesn’t matter what kind of business you have, a bar or a gym, there are common concepts for any of them. One of those concepts is accounting, and to facilitate the work with the figures, you can use accounting flowchart symbols and create a clear and representative scheme. You can create flowchart for auditing, tax accounting and even for planning your own budget.
A graphical tool for displaying successive processes is flowchart. This method is mostly suited to represent an accounting process. The sequence of steps in the accounting process usually consists of standard accounting procedures, that can be depicted by using a minimal number of symbols, applied for the basic flowcharting. The advanced opportunity to create professional Accounting Flow charts is provided by ConceptDraw Accounting Flowcharts solution. It includes contains a library of accounting flowchart symbols used when drawing the accounting process flow.
Picture: Accounting Flowchart Symbols
Related Solution:
Many of us want to be able to create designs efficiently yet quickly. ConceptDraw DIAGRAM will help you to make awesome drawings without having to design all those Time Elements. These elements include graphs, symbols, cliparts, visual data representation and a whole lot of other stuff.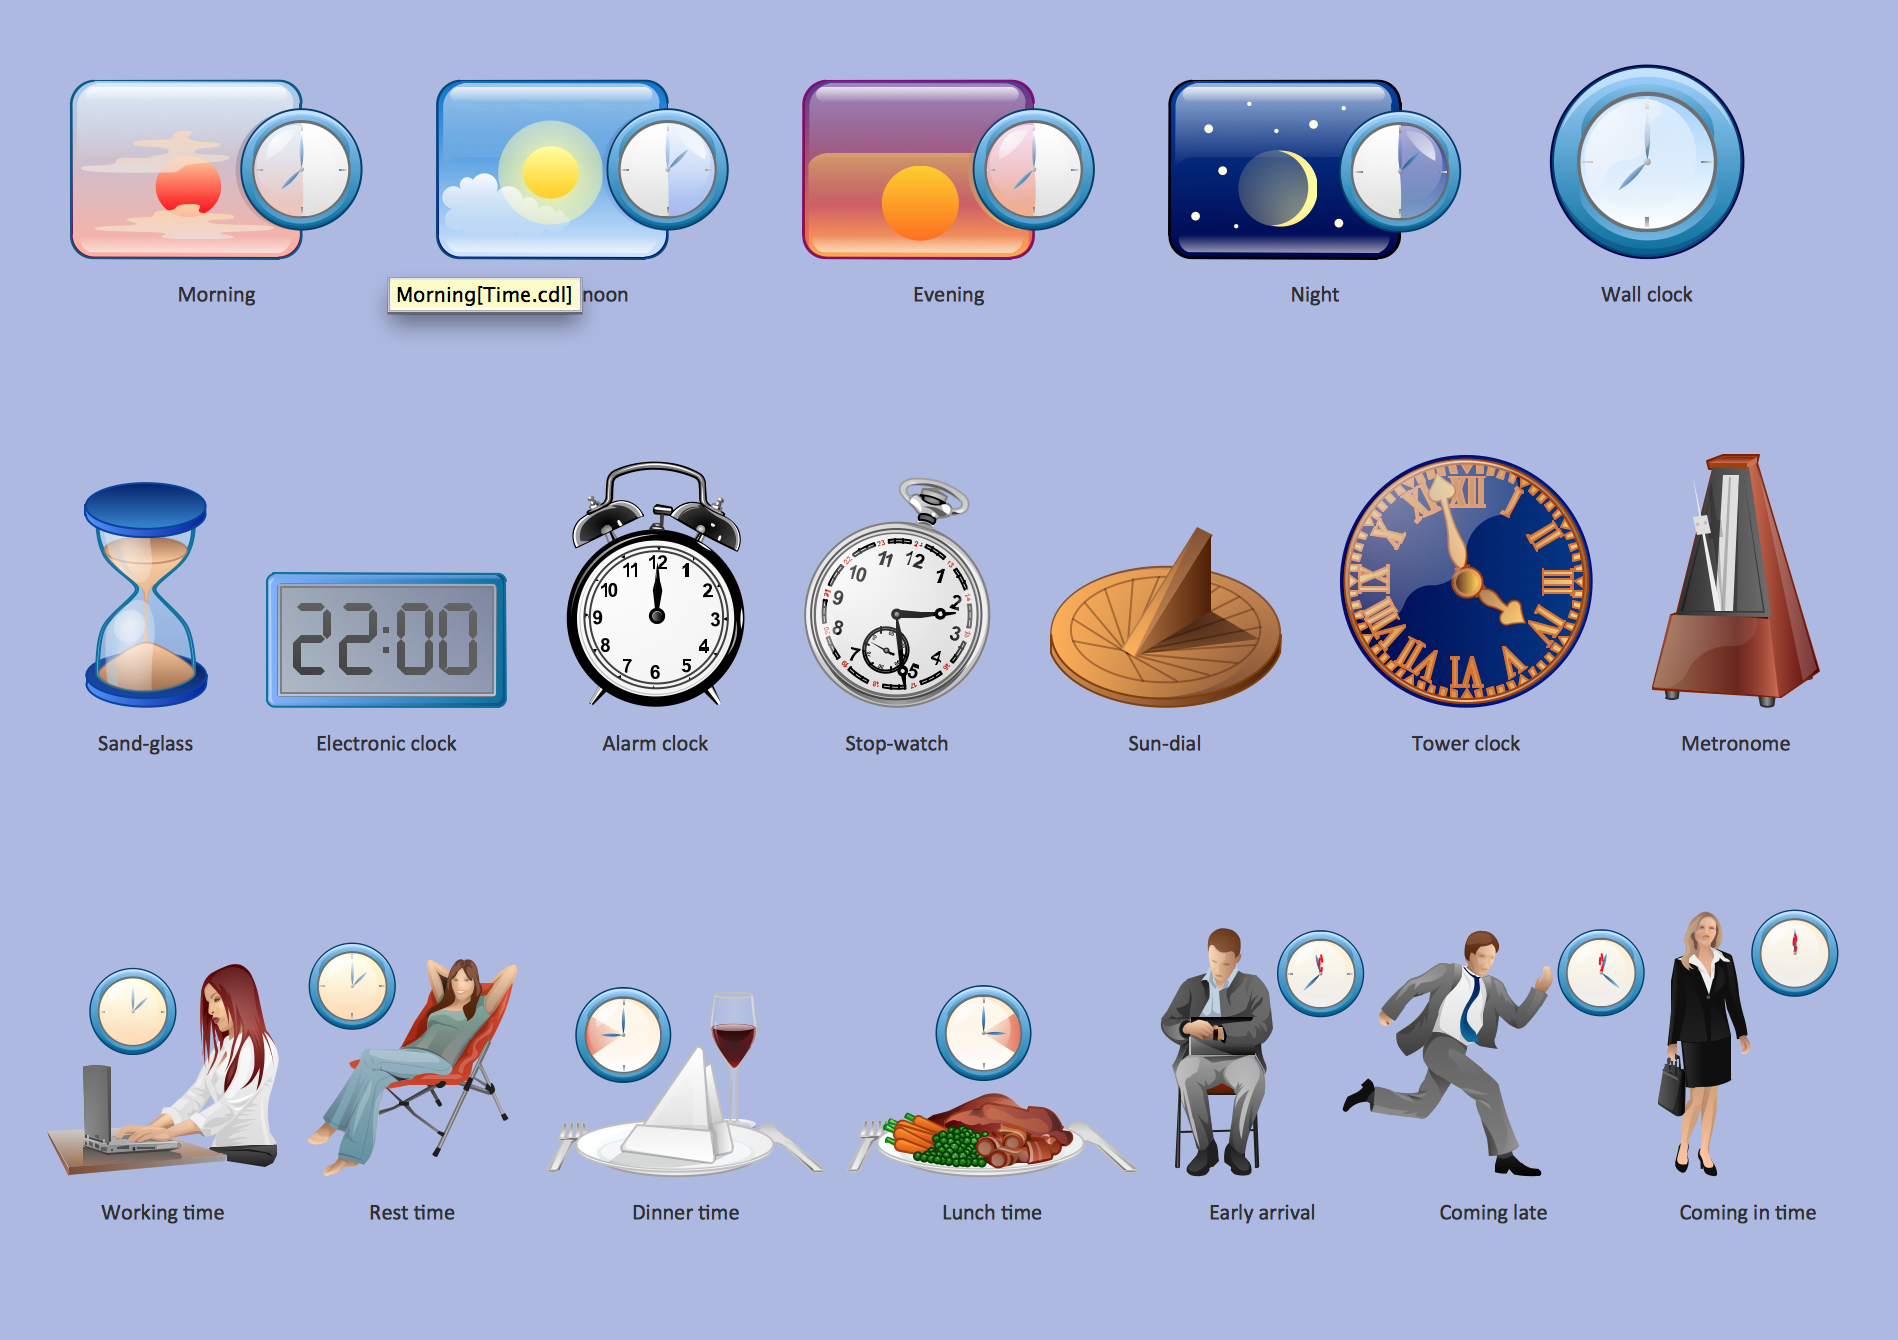
Picture: Time - Design Elements
Related Solution:
A process flowchart is a picture of the separate steps of a process in sequential order.Use ConceptDraw DIAGRAM software and the vector stencils from object libraries are designed objects you can use adding to process flowcharts for the best result.
Picture: Create Process Flowcharts
Related Solution:
Circular Diagram is a type of diagram widely used in marketing and economics for visualization information in a clear and visual form. ConceptDraw DIAGRAM diagramming and vector drawing software offers the useful tools of the Target and Circular Diagrams solution from the Marketing area of ConceptDraw Solution Park for effective drawing a Circular Diagram of any complexity and design.
Picture: Circular Diagram
Related Solution:
VSM symbols are the best for a production process designing. The entire Value Stream Mapping method uses a graphical representation of the manufacturing process, factors' pros and cons, that all stakeholders can easily understand. Value Stream Mapping is a graphical technique that provides possibilities to improve analysis of a manufacturing process, at the stage of the transferring information or materials that required to deliver a product or service to the customer.
Picture: Value Stream Mapping Symbols
Related Solution:
What is a Process Flow Map? It is a chart which visually illustrates a business process and how its steps work together. Process Flow Maps help companies define problem areas, inefficient activities for the purpose of further increasing performance and profitability of businesses. ConceptDraw DIAGRAM diagramming and vector drawing software extended with Flowcharts solution from the Diagrams area of ConceptDraw Solution Park is efficient and productive software for fast and simple creating professional looking Process Flow Map.
Picture: Process Flow Maps
Related Solution:
The Accounting flowchart shows how information flows from source documents through the accounting records. The are based on the accounting procedures or processes.
Picture: What process should be essentially adopted.Accounting Flowchart Example
Related Solution:
PDPC →
ConceptDraw DIAGRAM extended with Seven Management and Planning Tools Solution from the Management Area of ConceptDraw Solution Park is the best software for drawing all types of diagrams from the Seven Management and Planning Tools: Affinity Diagram, Relations Diagram, Prioritization Matrix, Root Cause Analysis Tree Diagram, Involvement Matrix, PERT Chart, and Risk Diagram (PDPC).
Picture: PDPC
Related Solution:
SWOT analysis makes it possible to form a strategy for a company and takes into account its characteristics. To understand the idea, you can view Swot Analysis Examples for Mac OS X and see how this tool can transform the business strategy. The main point is to adapt to the environment, or to try to influence on it.
This matrix of was designed to assist business manager in conducting of SWOT analysis. It will help to determine the position business takes regarding competitors and perspective of the further development. The factors of SWOT are depicted as bubbles on a chart. The coordinate axes are size (X) and importance (Y). The each bubble's diameter shows the strategic influence of the particular SWOT factors. Moreover, the ConceptDraw solution for SWOT Analysis provides the samples of SWOT Analysis matrices Examples for Apple OS X.
Picture: Swot Analysis Examples for Mac OSX
ConceptDraw
DIAGRAM 18