CORRECTIVE ACTIONS PLANNING. Risk Diagram (PDPC)
Management and Planning tools
ConceptDraw OFFICE suite is a software for Risks Diagram making. This diagram identifies possible risks in accomplishing corrective actions.

Pic.1 Management and Planning tool
With the Risks Diagram, one analyzes each action separately in a tree of all actions and develops a preventive action in response of each potential obstacles or circumstances which may be a risk.

Pic.2 Risk diagram (process decision program chart, PDPC) — Health Care
The Risk diagram (Process Decision Program Chart) determines the risks when corrective action is not performed correctly. Also, it helps develop descriptions for preventive actions at the level of execution.
See also:
TEN RELATED HOW TO's:
Design efficiently the technical flow charts in ConceptDraw DIAGRAM software for various fields and provide ✔️ clarity, ✔️ accuracy, ✔️ usability, ✔️ simple communication, analysis, and improvement
Picture: Technical Flow Chart Example
Related Solution:
A flowchart is a powerful tool for examining processes. It helps improving processes a lot, as it becomes much easier to communicate between involved people, to identify potential problems and to optimize workflow. There are flowcharts of different shapes, sizes and types of flowchart vary from quite basic process flowcharts to complex program flowcharts. Nevertheless, all these diagrams use the same set of special symbols like arrows to connect blocks, parallelogram to show data receiving or rectangles for showing process steps.
Basic flowcharts are used to represent a simple process algorithm. A basic flowchart notation consists of rectangles (business processes), arrows (the flow of information, documents, etc.). The same notation is used in items such as the "decision", which allow you to do the branching. To indicate the start of the entire business process and its termination can be used the "Terminator" element. The advantages of Basic Flowchart are simplicity and clarity. With it you can quickly describe the business process steps. Creating of Basic Flowchart does not require any special knowledge, as easily understand by employees with different levels of education and IQ.
Picture: Types of Flowchart: Comprehensive Overview
Related Solution:
The Seven Management and Planning Tools is a tool for Root Cause Analysis Tree Diagram drawing. This diagram is for Root Cause Analysis.
Analyze the root causes for factors that influenced the problem. This diagram is constructed separately for each highly prioritized factor. The goal of this is to find the root causes for the factor and list possible corrective action.
Picture: Root Cause Analysis
The affinity diagram is a business tool used to organize ideas and data. It is one of the Seven Management and Planning Tools. But how design the Affinity Diagram quick and easy? ConceptDraw DIAGRAM diagramming and vector drawing software offers the Seven Management and Planning Tools Solution from the Management Area.
Picture: Affinity Diagram
Related Solution:
The Event - driven Process Chain ( EPC ) allows managers visually present business process models for making decisions for business processes improvement.
Event-Driven Process Сhain Diagrams for improvement throughout an organisation.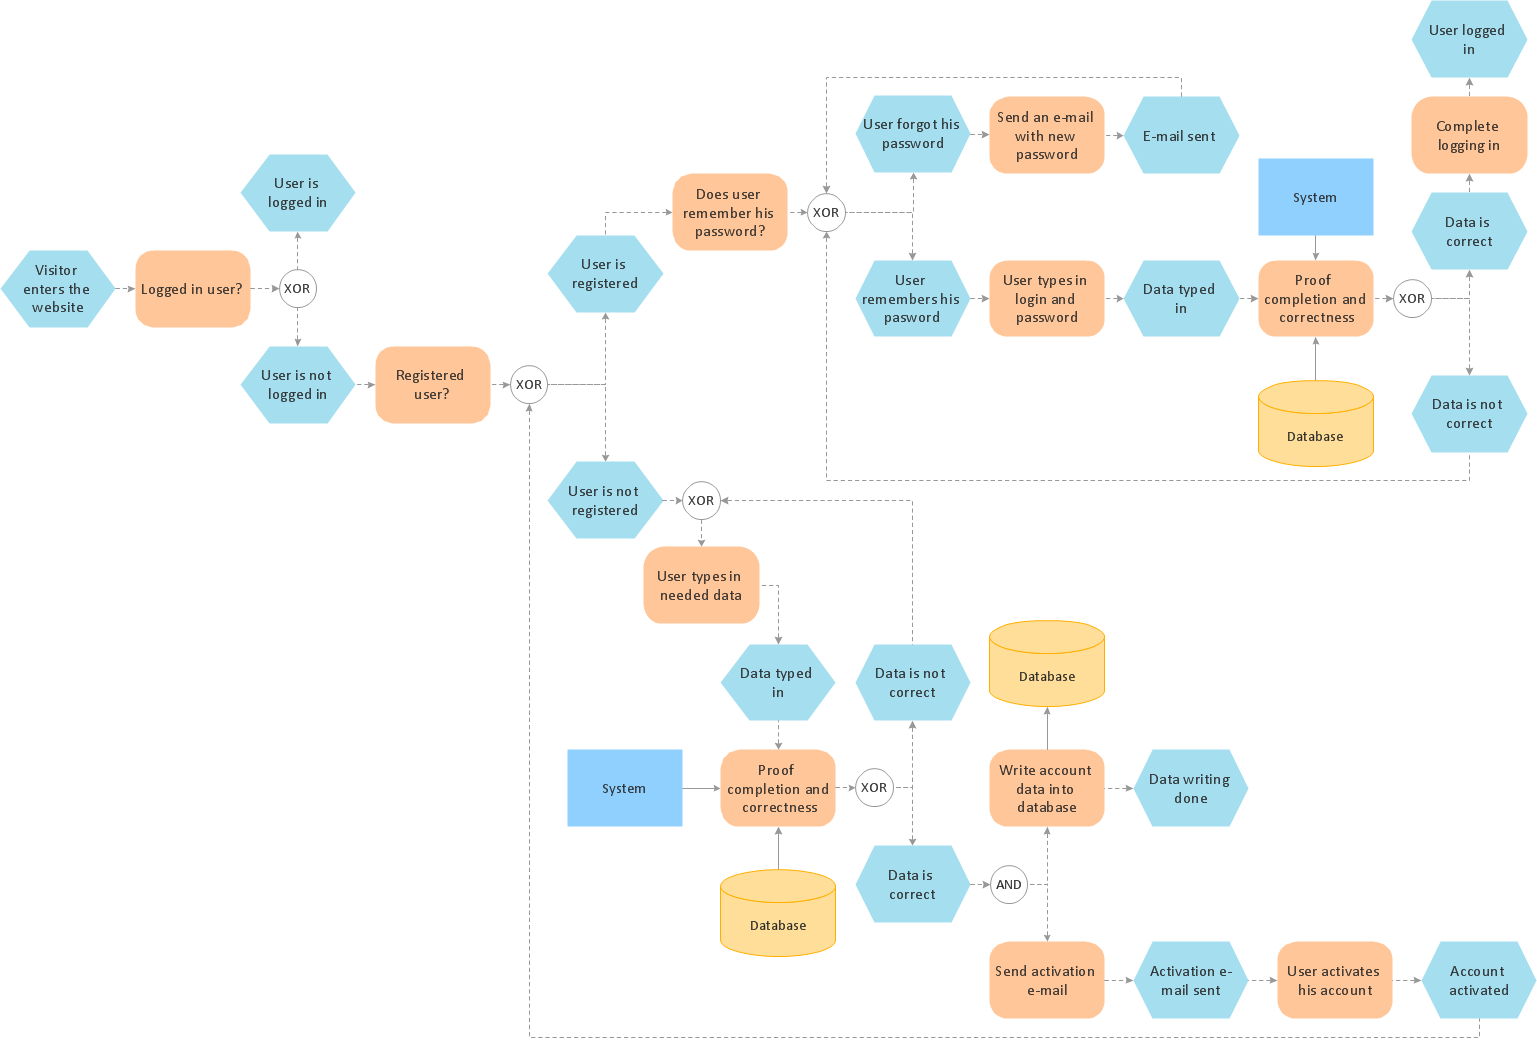
Picture: EPC (Event-driven Process Chain) Flowcharts
Related Solution:
ConceptDraw DIAGRAM extended with Fault Tree Analysis Diagrams Solution from the Industrial Engineering Area of ConceptDraw Solution Park is the best Fault Tree Analysis Software.
First of all, Fault Tree Analysis Diagrams Solution provides a set of samples which are the good examples of easy drawing professional looking Fault Tree Analysis Diagrams.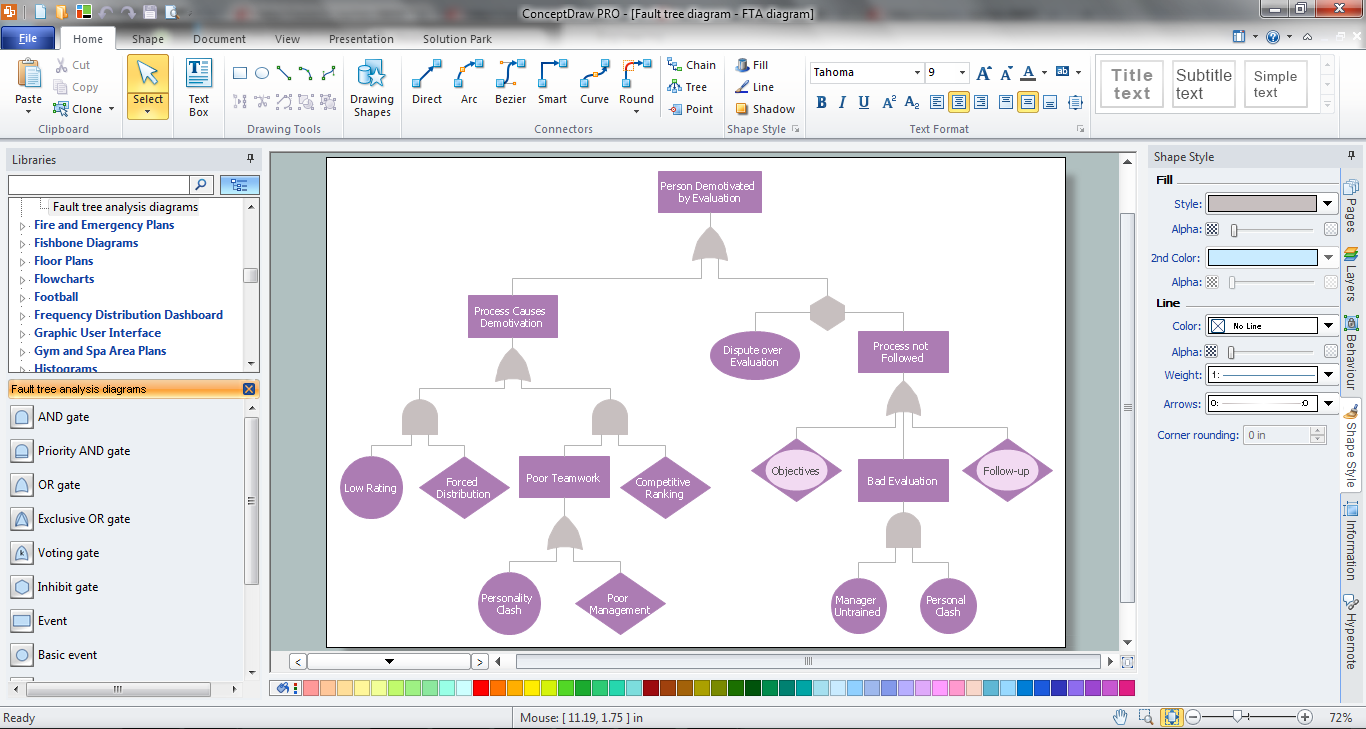
Picture: Fault Tree Analysis Software
Related Solution:
The Total Quality Management Diagram solution helps your organization visualize business and industrial processes. Create Total Quality Management diagrams for business process with ConceptDraw software.
Picture: Probability Quality Control Tools
Related Solution:
Create with our data flow diagram software perfect data flow diagrams. Download data flow diagram software for FREE. Use hundreds of data flow diagram examples.
Picture: Collaboration in a Project Team
ConceptDraw PROJECT is simple project management software for planning projects, it include tools for planning project objectives. This type of project planning software intended for professional who use project terms daily. CoonceptDraw PROJECT can be used as customer project management software to keep on track on-site operations. It often used for planning marketing activity as marketing project management software, also it used as simple project management software for software development projects.
Picture: ConceptDraw PROJECT Project Management Software Tool
ConceptDraw PROJECT contains an extensive tool set to help project managers. The rich data visualization capability that is provided by ConceptDraw products helps you create project dashboards, one-click reports, multi-project views, Gantt charts, and resource views. Let′s learn how to get maximum value using ConceptDraw PROJECT!
Picture: How To Create Project Report
ConceptDraw
DIAGRAM 18