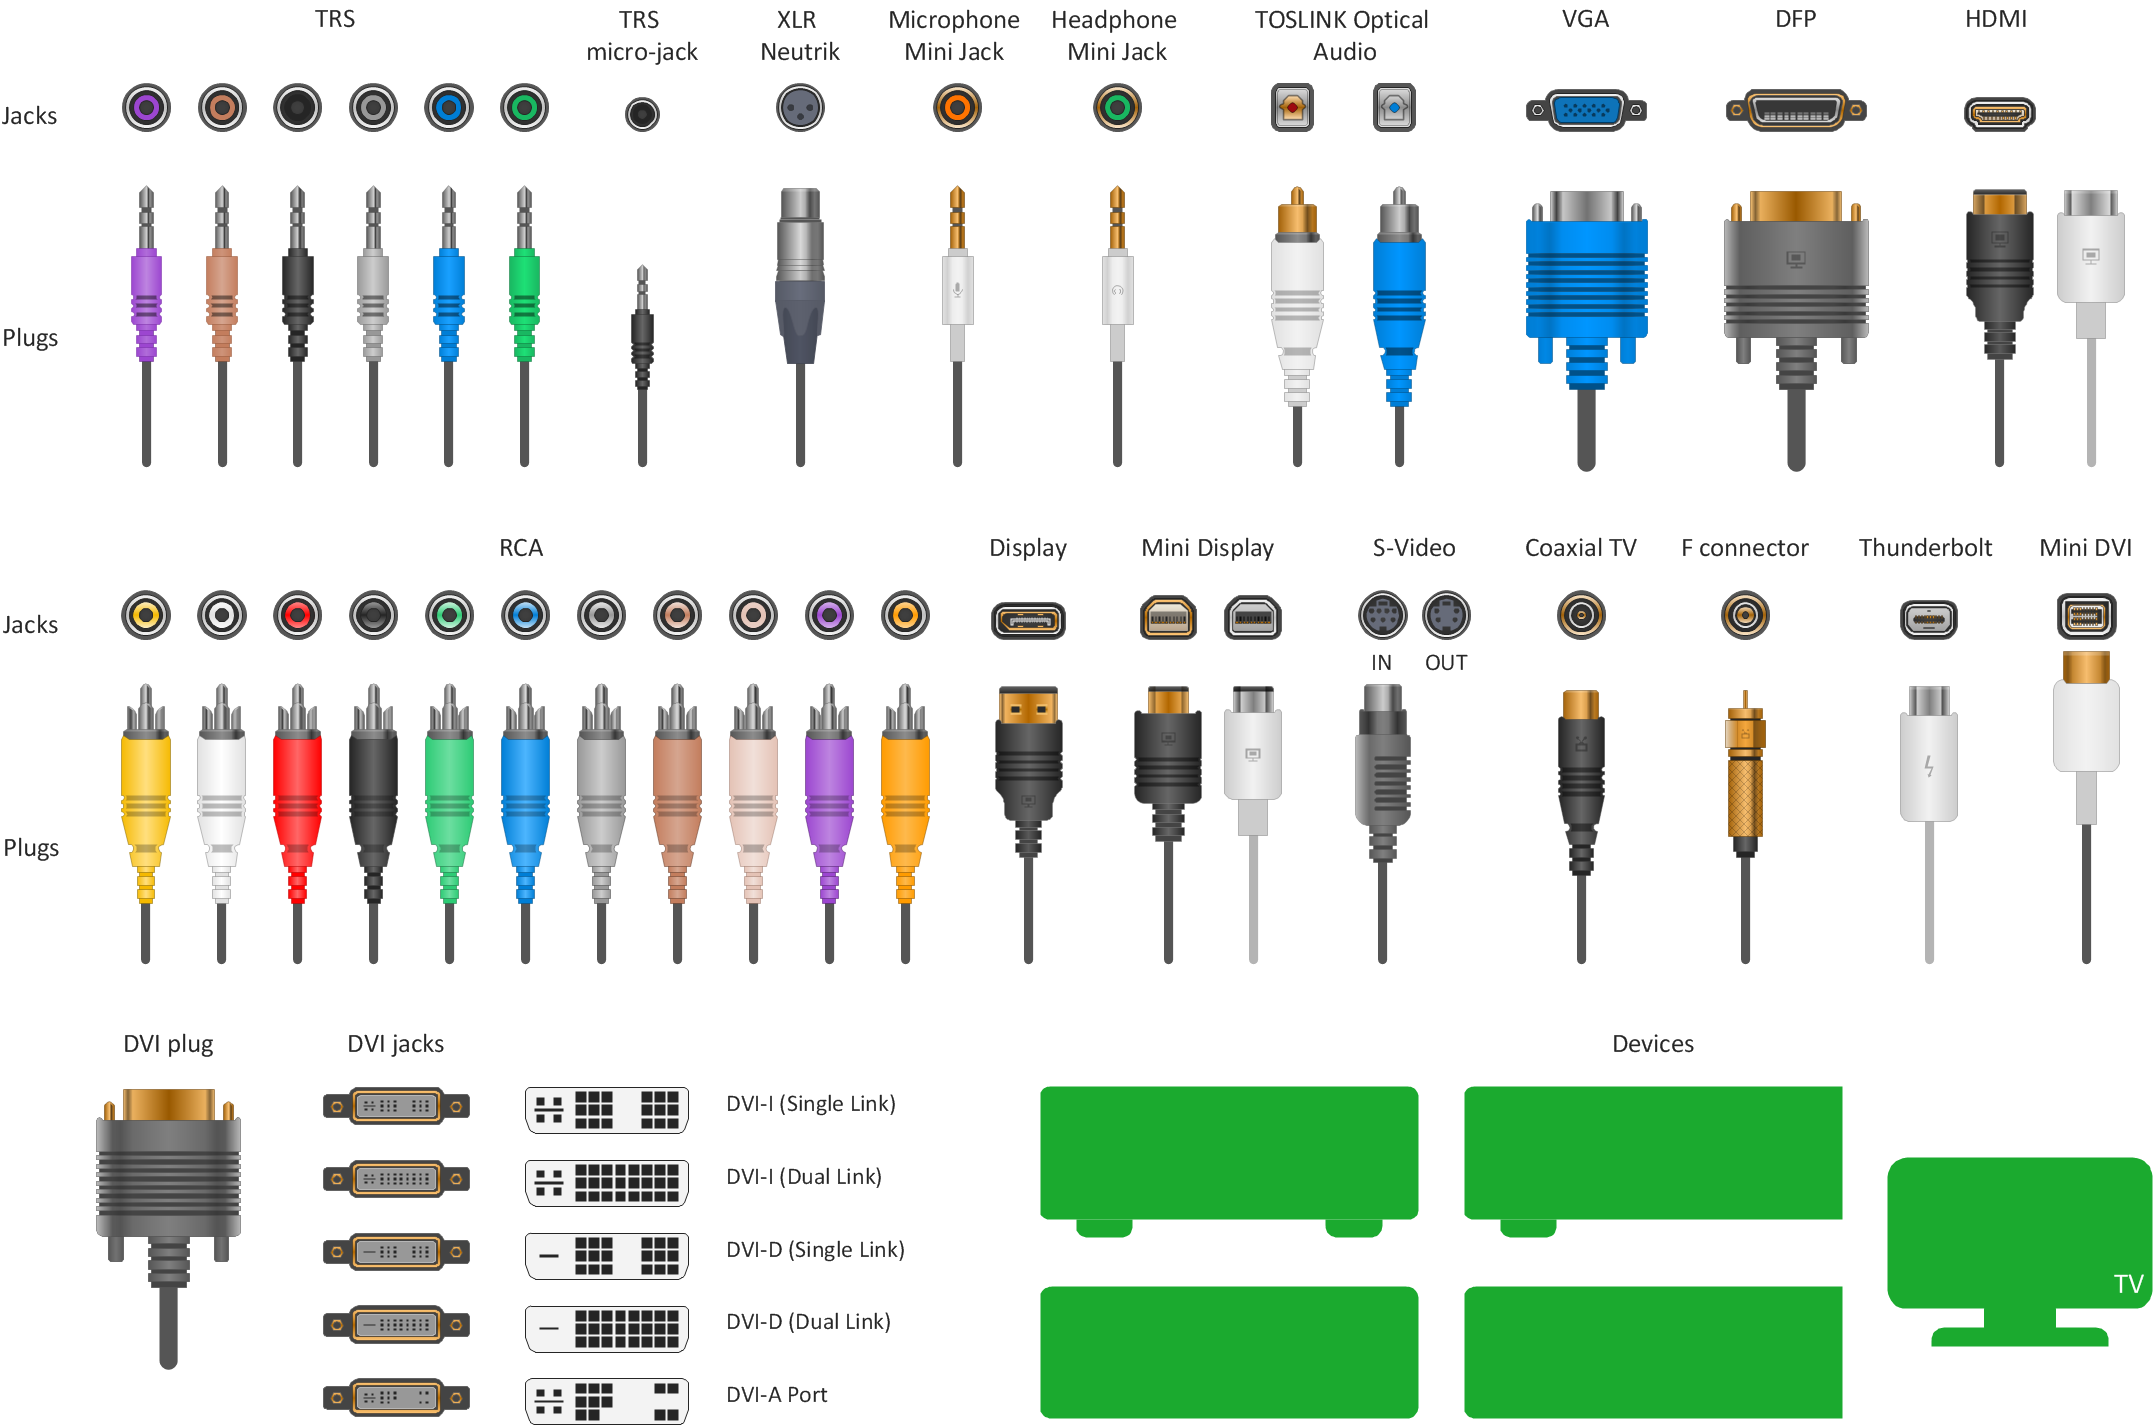
Example 1. Design elements - Audio video connectors
The Audio and Video Connectors solution from ConceptDraw Solution Park contains a library with vector stencils of jacks, plugs and silhouettes of audio and video devices for drawing the hook up diagrams using ConceptDraw DIAGRAM diagramming software.

Example 2. Audio and Video Connections
This sample demonstrates a Home Entertainment System with Surround Sound. Surround sound is a technique for enhancing the audio soundscape, by positioning speakers in a 360° radius around the listener.
The audio and video connection diagrams created in ConceptDraw DIAGRAM using the Audio and Video Connectors solution are vector graphic documents. They are available for reviewing, modifying or converting to a variety of formats: image, HTML, PDF file, MS PowerPoint Presentation, Adobe Flash and MS Visio. The Audio and Video Connectors Solution is available for all ConceptDraw DIAGRAM or later users.
TEN RELATED HOW TO's:
Have you ever needed a flowchart, but did not have the time or tools to build one? Rapid Draw allows you to build a professional flowchart quickly and easily. You have the ability to add your own shapes to Rapid Draw’s built in shape library.
Picture: How To Create a FlowChart using ConceptDraw
Related Solution:
An example flowchart of marketing analysis shows main steps you have to challenge writing a marketing analysis.
Picture: Flowchart Example: Flow Chart of Marketing Analysis
Related Solution:
The critical importance of house electrical plans. 🔸 Learn how to create efficient electrical layouts using the ConceptDraw DIAGRAM app. Enhance ✔️ safety, ✔️ functionality, and ✔️ compliance with electrical codes in your home projects with our comprehensive guide
Picture:
Importance of House Electrical Plans
How to Create Electrical Layouts
with ConceptDraw DIAGRAM App
Related Solution:
Organizing and Selecting Social Media Response Messages.
Interactive Flowcharts can change the way one creates and organizes their social media response process.
Picture: What is Interactive Flowcharts
Related Solution:
ConceptDraw DIAGRAM is a powerful diagramming and vector drawing software. Extended with Chemical and Process Engineering Solution from the Industrial Engineering Area of ConceptDraw Solution Park, it became the best Chemical Engineering software.
Picture: Chemical Engineering
Related Solution:
When trying to figure out the nature of the problems occurring within a project, there are many ways to develop such understanding. One of the most common ways to document processes for further improvement is to draw a process flowchart, which depicts the activities of the process arranged in sequential order — this is business process management. ConceptDraw DIAGRAM is business process mapping software with impressive range of productivity features for business process management and classic project management. This business process management software is helpful for many purposes from different payment processes, or manufacturing processes to chemical processes. Business process mapping flowcharts helps clarify the actual workflow of different people engaged in the same process. This samples were made with ConceptDraw DIAGRAM — business process mapping software for flowcharting and used as classic visio alternative because its briefly named "visio for mac" and for windows, this sort of software named the business process management tools.
This flowchart diagram shows a process flow of project management. The diagram that is presented here depicts the project life cycle that is basic for the most of project management methods. Breaking a project into phases allows to track it in the proper manner. Through separation on phases, the total workflow of a project is divided into some foreseeable components, thus making it easier to follow the project status. A project life cycle commonly includes: initiation, definition, design, development and implementation phases. Distinguished method to show parallel and interdependent processes, as well as project life cycle relationships. A flowchart diagram is often used as visual guide to project. For instance, it used by marketing project management software for visualizing stages of marketing activities or as project management workflow tools. Created with ConceptDraw DIAGRAM — business process mapping software which is flowcharting visio alternative or shortly its visio for mac, this sort of software platform often named the business process management tools.
Picture: Process Flowchart: A Step-by-Step Comprehensive Guide
Related Solution:
A flowchart is a simple but very functional tool when it comes to understanding a workflow or to removing unnecessary stages from a process. When drawing flowcharts, keep in mind that there are four common types of flowcharts, like document flowcharts and data flowcharts that show control over a data or document flow over a system. To show controls on a physical level, use system flowcharts. In addition, to show controls in a program, you can draw a program flowchart.
This flowchart diagram represents the piece of an article editing process, that involves the author and editor. It was created using the Basic Flowchart notation that consists from the basic flowchart symbols. The start and the end of the process are indicated with "Terminator" symbols. The "Process" symbols show the action steps consisting from making edits and searching for a compromise, when the author does not agree with the suggestions of the editor. The "Process" symbol is the general symbol in process flowcharts. The "Decision" symbol indicates a branching in the process flow. There are two branches indicated by a Decision shape in the current flowchart (Yes/No, Disagree/Agree). This basic flowchart can be used as a repeating unit in the workflow diagram describing the working process of some editorial office.
Picture: Types of Flowcharts
Related Solution:
Process Flow Chart is a visual illustration of overall flow of activities in producing a product or service. How do you make a Process Flow Chart usually? Drawing process flow charts, diagrams and maps is quite complex and lengthy process, especially if you draw free-hand. But now thanks to the ConceptDraw DIAGRAM diagramming and vector drawing software extended with Flowcharts solution from the Diagrams area of ConceptDraw Solution Park this process became simple and fast. A confirmation of this can serve many Process Flow Chart examples included in Flowcharts solution.
Picture: Process Flow Chart Examples
Related Solution:
This sample was created in ConceptDraw DIAGRAM diagramming and vector drawing software using the Line Graphs Solution from Graphs and Charts area of ConceptDraw Solution Park.
This sample shows the Line Chart of annual percentage change. The Line Chart allows you to clearly see the changes of data over the time.
Picture: Line Chart Template for Word
Related Solution:
This sample shows the Six Markets Model Chart. It was created in ConceptDraw DIAGRAM diagramming and vector drawing software using the Marketing Diagrams Solution from the Marketing area of ConceptDraw Solution Park.
The six markets model defines six markets that take the central place in the relationship marketing: internal markets, supplier markets, recruitment markets, referral markets, influence markets and customer markets. The six markets model allows the organization to analyze the stakeholders and key market domains that can be important to it.
Picture: Six Markets Model Chart
Related Solution:
