Root cause analysis tree diagram lets identify the root causes for a factor and then list possible corrective action. The diagram displays the structure of causes for a factor and possible corrective actions. The root cause analysis tree diagram is used for further formulation of actions.
TEN RELATED HOW TO's:
Unfortunately, a man can’t predict the future and no one is safe from natural disasters, such as floods, earthquakes, hurricanes or fires. Nonetheless, what you can do to ensure safety for you and your relatives is to create an emergency plan, so everyone will know what to do if emergency happens. Keep that plan simple and train it several times a year so that no one could forget any details of it.
Fire and emergency plans are important to supply people with a visual safety solution. This diagram presents a set of standard symbols used to depict fire safety, emergency, and associated information. Using clear and standard symbols on fire emergency plans provides the coherence of collective actions , helps to avoid embarrassment, and improves communications in an emergent situation. The fire emergency symbols are intended for the general emergency and fire service, as well as for building plans ,engineering drawings and insurance diagrams. They can be used during fire extinguishing and evacuation operations, as well as trainings. It includes vector symbols for emergency management mapping, emergency evacuation diagrams and plans.
Picture: Emergency Plan
Related Solution:
Use ConceptDraw DIAGRAM software with Flowcharts Solution to create Process Flow Charts, Flow Chart Process Maps, and High-Level Process Flow Charts to illustrate ✔️ high-level processes in industrial, chemical, and process engineering, ✔️ major plant processes, ✔️ minor details
Picture: Process Flow Chart
Related Solution:
The vector stencils library IDEF0 Diagram from the solution IDEF0 Diagrams contains specific IDEF0 diagram symbols such as arrow symbols and entity symbols for ConceptDraw DIAGRAM software.
Picture: IDEF0 Diagram
Related Solution:
When designing a network, it is important to take into account the hierarchy of network devices. When you have a root device you should consider a tree network topology that might have any number of lower levels as you might need. This technology is based on star and bus network topologies.
This is a schematic representation of a Tree computer network topology. A tree topology means that some star networks are linked together. A star network is a topology of the local network where a central workstation is connected with each end-user computer or peripherals. A tree structure means that, the central nodes of these star networks are linked to a main cable (the Bus topology). So, a Tree network topology is a few Star networks connected into a Bus topology. This scheme can be applied to draw the particular physical or logical network diagrams using the ConceptDraw Computer and Networks solution.
Picture: Tree Network Topology Diagram
Related Solution:
ConceptDraw PROJECT is the Gantt chart software that implements critical path method to provide the user with a wide set of project management tools.
Picture: How to Discover Critical Path on a Gantt Chart
There are plenty of diagramming tools, the question is to choose the most suitable for your needs. For example, you can choose ConceptDraw DIAGRAM as organizational chart software and get fascinating results in a few minutes. An orgchart is useful for any corporation.
This is an example of a hierarchical organization scheme of the company. It has tree-like structure. Each middle manager is subordinated to a few employees, and he is accountable to one of the top managers. Every type of organizational composition of businesses may be presented in the view of an organizational chart that is supported by ConceptDraw Organisational Charts solution. There are number of ways of building a structure of business organization, establishing how it should function.
Picture: ConceptDraw DIAGRAM - Organizational chart software
Related Solution:
ConceptDraw PROJECT is simple project management software for planning projects, it include tools for planning project objectives. This type of project planning software intended for professional who use project terms daily. CoonceptDraw PROJECT can be used as customer project management software to keep on track on-site operations. It often used for planning marketing activity as marketing project management software, also it used as simple project management software for software development projects.
Picture: ConceptDraw PROJECT Project Management Software Tool
Any hierarchical structure of any company can be represented as a triangle or a pyramid. You can create a pyramid diagram and pyramid chart of any complexity using special libraries included in ConceptDraw DIAGRAM. Actually, any knowledge or chain of facts can also be depicted as a pyramid.
A wide range of graph and chart are utilized in marketing to maintain documentation and various visual issues, that deal with marketing information and data. The marketing value pyramid can be created to illustrate how the value of company, or product is based on its competitiveness. To design this diagram we used ConceptDraw DIAGRAM drawing tools in conjunction with Pyramid solution for Solution Park.
Picture: Pyramid Diagram and Pyramid Chart
Related Solutions:
Have you ever created the fire plans on the base of Fire Evacuation Plan Template? It's incredibly convenient and time-saving way. Let's try to make sure this with Fire and Emergency Plans solution for ConceptDraw DIAGRAM software.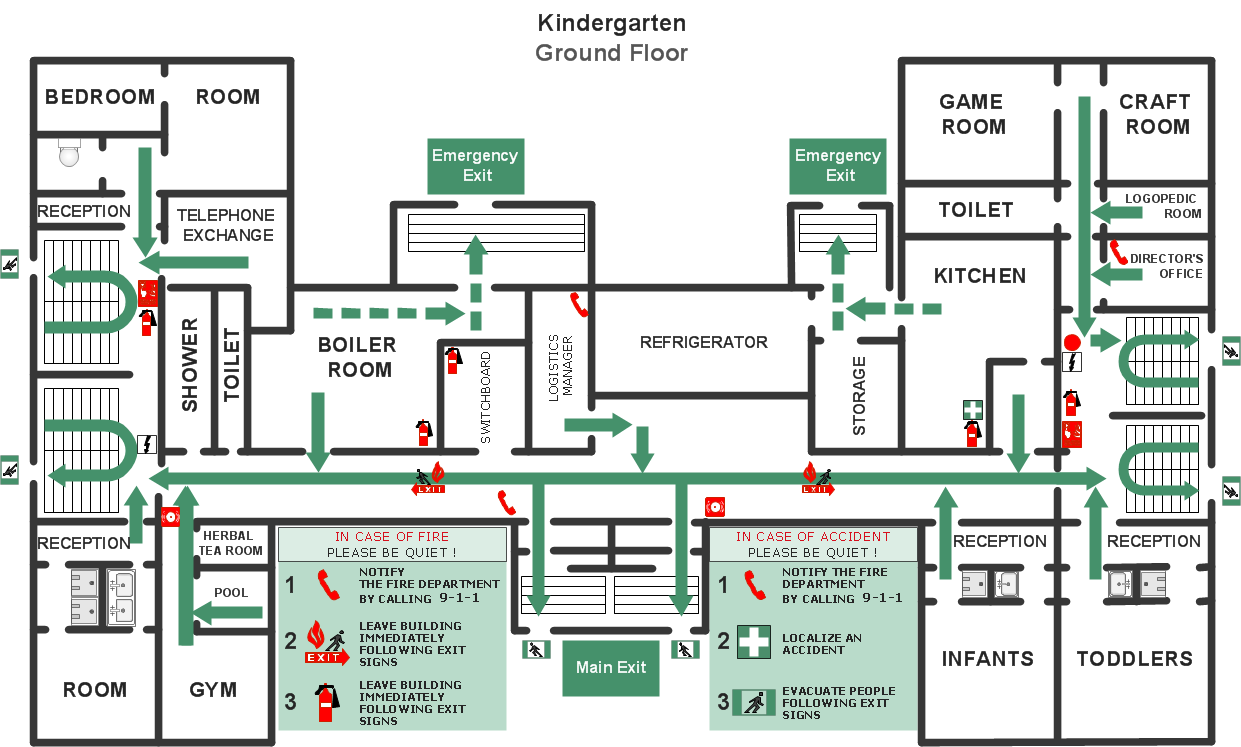
Picture: Fire Evacuation Plan Template
Related Solution:
Activity on Node Network Diagramming Tool - Activity Network and Project Evaluation and Review Technique, or PERT, charts are a way of documenting and analyzing the tasks in a project.
This sample shows the Activity on node network diagramming method. It was created in ConceptDraw DIAGRAM diagramming and vector drawing software using the Seven Management and Planning Tools solution from the Management area of ConceptDraw Solution Park.
Picture: Activity on Node Network Diagramming Tool
Related Solution:
