Total Quality Management Density
Total Quality Management (TQM) includes quality monitoring and analysis using statistical tools like failure rate, hazard function, failure distribution, exponential failure density function.
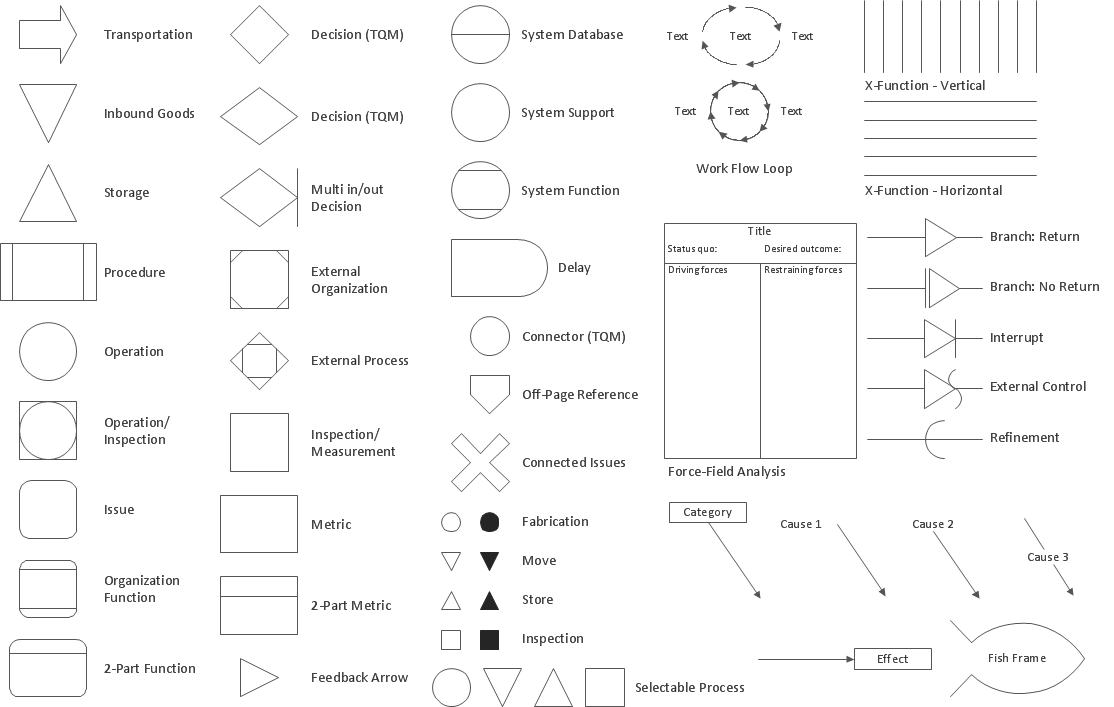
Pic.1 Design elements - Total Quality Management (TQM) flowcharts.
The Total Quality Management (TQM) Diagrams solution in ConceptDraw Solution Park extends ConceptDraw DIAGRAM diagramming and business graphics software with samples, templates, and a library of vector stencils for drawing TQM flowcharts.
See also Samples:
TEN RELATED HOW TO's:
ConceptDraw DIAGRAM is a flowchart creating software. This software includes over 20 vector stencils in libraries. These objects allow you to create well-designed flowcharts.
Put an initial object from library to a page and use RapidDraw technology clicking on direction arrows to add new objects to the flowchart. This way you can make flowchart quickly.
Picture: How To Create a Flow Chart in ConceptDraw
Related Solution:
Total Quality Management (TQM) system is the management method where the confidence in quality of all organization processes is placed foremost. The given method is widely used in production, in educational system, in government organizations and so on.
Picture: Total Quality Management with ConceptDraw
Enjoy the flowcharting process with the intuitive interface and powerful tools of the user-friendly ConceptDraw DIAGRAM software: ✔️ represent algorithms, ✔️ break down complex processes, ✔️ display workflows, ✔️ show procedures, ✔️ succeed in decision-making, ✔️ streamline processes, ✔️ increase productivity, ✔️ enhance efficiency
Picture: Flowcharting Software
Related Solution:
Activity Network Diagram - This sample was created in ConceptDraw DIAGRAM diagramming and vector drawing software using the Seven Management and Planning Tools solution from the Management area of ConceptDraw Solution Park.
This sample shows the PERT (Program Evaluation Review Technique) chart of the request on proposal. A request for proposal (RFP) is a request of the company or the organization to potential suppliers to submit the business proposals for service or goods that it is interested to purchase. The RFP is represented on the initial procurement stage and allows to define the risks and benefits.
Picture: Activity Network Diagram Method
Related Solution:
Affinity Diagram Software - ConceptDraw DIAGRAM is a powerful diagramming and vector drawing software that allows quick, easy and effective create the Affinity Diagrams.
Seven Management and Planning Tools solution from the Business Productivity area of ConceptDraw Solution Park provides templates, samples and ready-to-use vector stencils that will help you design the professional looking Affinity Diagrams in a few moments.
Picture: Affinity Diagram Software
Related Solution:
Use ConceptDraw DIAGRAM diagramming and business graphics software to draw your own flowcharts of business processes.
Picture: How to Draw an Effective Flowchart
Related Solution:
ConceptDraw DIAGRAM software extended with Fishbone Diagrams solution from the Management area of ConceptDraw Solution Park is perfect for Cause and Effect Diagram creating. It gives the ability to draw fishbone diagram that identifies many possible causes for an effect or a problem. Causes and Effects are usually grouped into major categories to identify these sources of variation. Causes and Effects in the diagram show relationships among various factor. Fishbone diagram shows factors of Equipment, Process, People, Materials, Environment and Management, all affecting the overall problem.
Picture: Cause and Effect Diagram
Related Solution:
Any project is a complex system which rarely goes without some problems, even the most minor. But the success of the project mostly depends from the ability effectively solve appearing problems. There are many methods for problem solving, one of the most effective is the use a Fishbone diagram to attack complex problems.
Use ConceptDraw DIAGRAM diagramming software with Fishbone Diagrams Solution to attack any complex problems with fishbone diagrams graphic method. Construct Fishbone diagram to help users brainstorm and break down a complex problem.
Picture: Use a Fishbone Diagram to Attack Complex Problems
Related Solution:
There are several basic topologies including bus, star, point-to-point, ring and a hybrid. Two computers can form a fully connected network topology, and as the number of network nodes increases, the network diagram gets more complicated. This type of topology is also called a full mesh.
This is a visual example of a computer network built using a mesh topology. This diagram presents the schematic structure of the full mesh network topology. A common mesh network topology means that each network device is connected with several points in the network, so if the one node of the network goes down, it does not cause an issue with an operability of the entire computer network. In a full mesh network topology, every computer or device in the network is interconnected with each of the other devices in the network.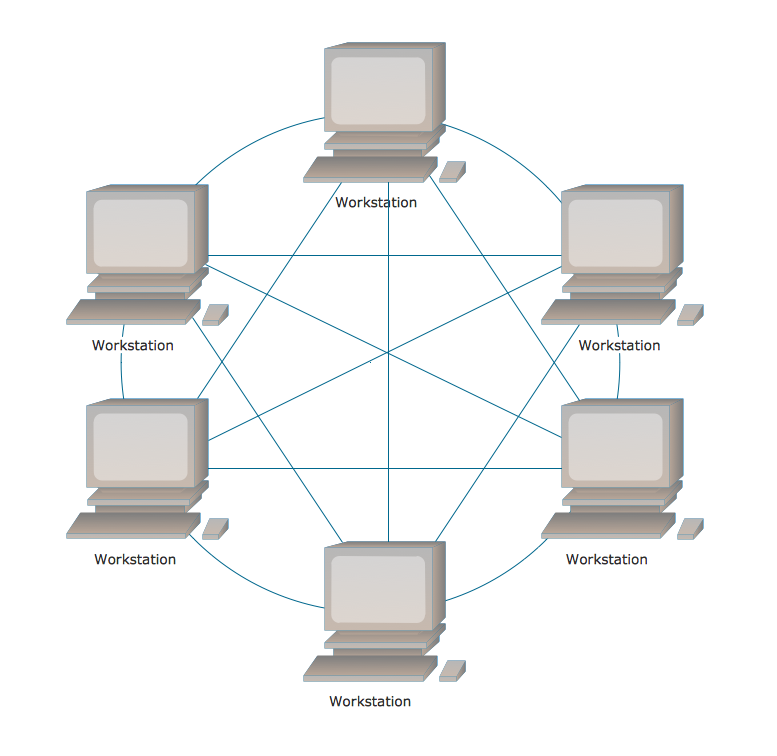
Picture: Fully Connected Network Topology Diagram
Related Solution:
The ConceptDraw Flowchart component includes a set of samples and templates. This geathered as flowchart maker toolbox which focused on drawing flowcharts of any industry standards.
Picture: Flowchart Components
Related Solution:
ConceptDraw
DIAGRAM 18