Example 1. Audit Procedures
Audit Flowcharts Solution offers the Audit Flowcharts library with set of predesigned symbols for illustration the audit procedures, and includes variety of samples, among them are also the samples representing different audit procedures.

Example 2. Audit Flowcharts Solution in ConceptDraw STORE
All samples are available from ConceptDraw STORE. They are bright and beautiful, colorful and attractive, interesting and easy to remember, so they will have a great success when using in a work activity.

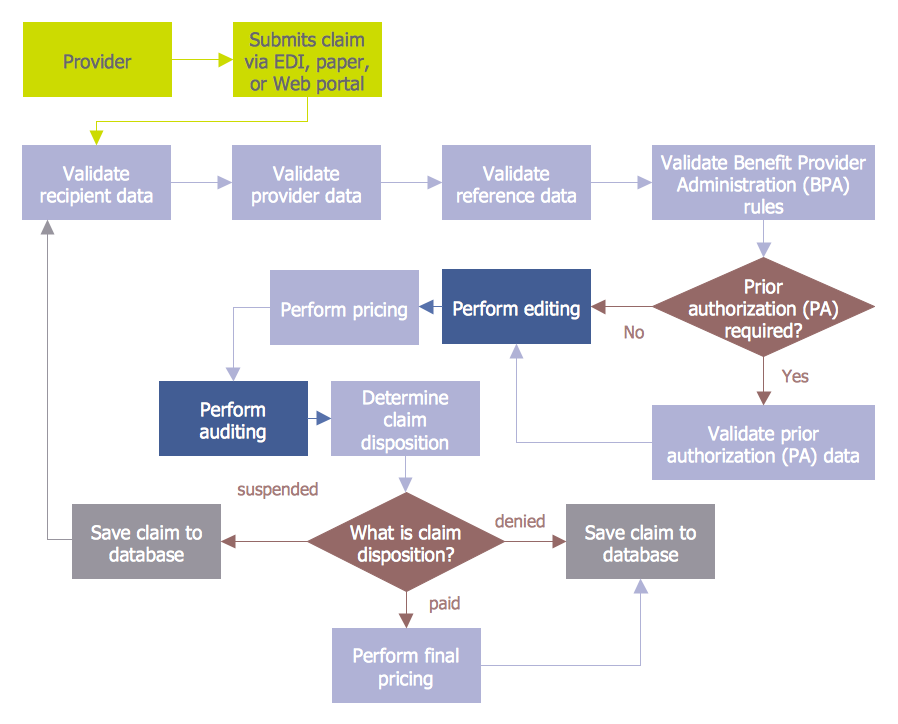
Example 3. Audit Planning Flowchart
The samples you see on this page were created in ConceptDraw DIAGRAM software using the Audit Flowcharts Solution for ConceptDraw DIAGRAM and shows the audit procedures. An experienced user spent 10 minutes creating every of these samples.
Use the Audit Flowcharts Solution for ConceptDraw DIAGRAM Solution Park to illustrate the audit procedures quick, easy and effective.
All source documents are vector graphic documents. They are available for reviewing, modifying, or converting to a variety of formats (PDF file, MS PowerPoint, MS Visio, and many other graphic formats) from the ConceptDraw STORE. The Audit Flowcharts Solution is available for all ConceptDraw DIAGRAM or later users.
TEN RELATED HOW TO's:
Use ConceptDraw DIAGRAM diagramming and business graphics software for drawing your own PM life cycle flow charts.
Picture: Program to Make Flow Chart
Related Solution:
Mind map describing the various approaches to take when dealing with difficult people.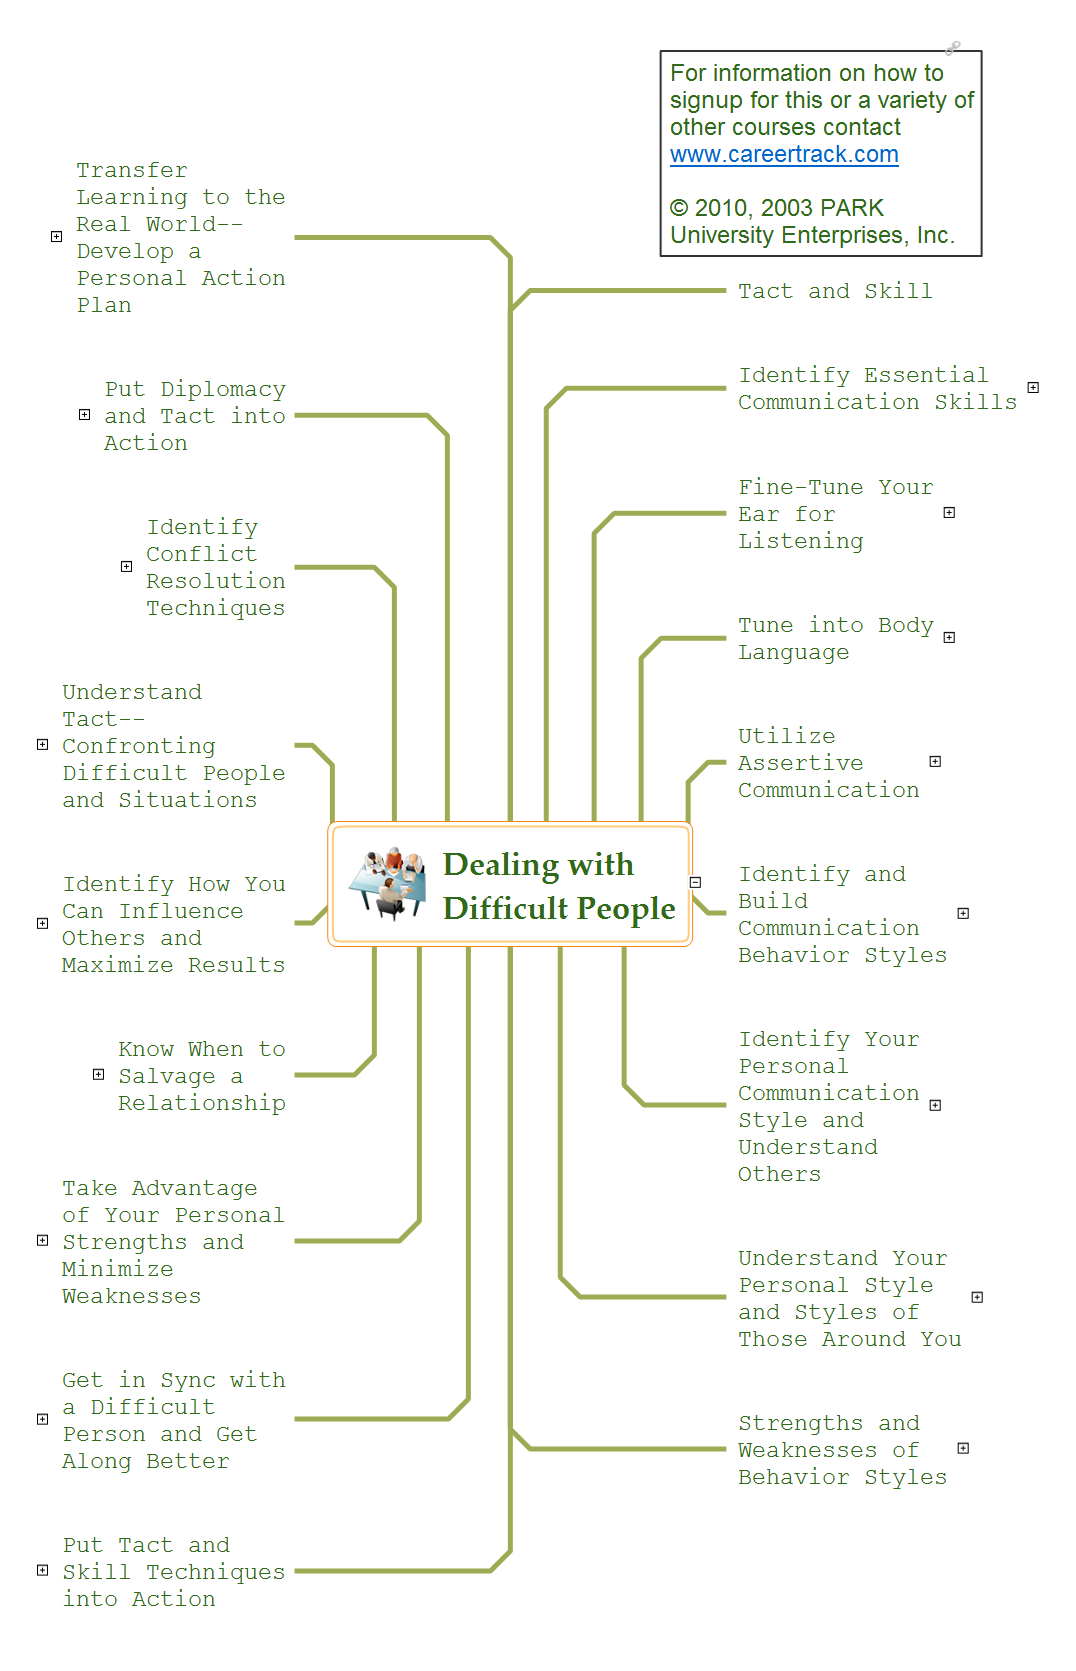
Picture: Dealing with Difficult People
Related Solution:
Enjoy the flowcharting process with the intuitive interface and powerful tools of the user-friendly ConceptDraw DIAGRAM software: ✔️ represent algorithms, ✔️ break down complex processes, ✔️ display workflows, ✔️ show procedures, ✔️ succeed in decision-making, ✔️ streamline processes, ✔️ increase productivity, ✔️ enhance efficiency
Picture: Flowcharting Software
Related Solution:
This sample shows the Flowchart that displays the solid-state welding processes, the types of welding.
Picture: Types of Welding in Flowchart
Related Solution:
The new Value Stream Mapping solution found in the ConceptDraw Solution Park continues to extend the range of ConceptDraw DIAGRAM into a business graphics tool.
Picture: Value Stream Diagram
Related Solution:
This sample shows the Six Markets Model Chart. It was created in ConceptDraw DIAGRAM diagramming and vector drawing software using the Marketing Diagrams Solution from the Marketing area of ConceptDraw Solution Park.
The six markets model defines six markets that take the central place in the relationship marketing: internal markets, supplier markets, recruitment markets, referral markets, influence markets and customer markets. The six markets model allows the organization to analyze the stakeholders and key market domains that can be important to it.
Picture: Six Markets Model Chart
Related Solution:
ConceptDraw RapidDraw technology is a simple point-and-click design that helps create professional, presentation-ready business process diagrams quickly and efficiently.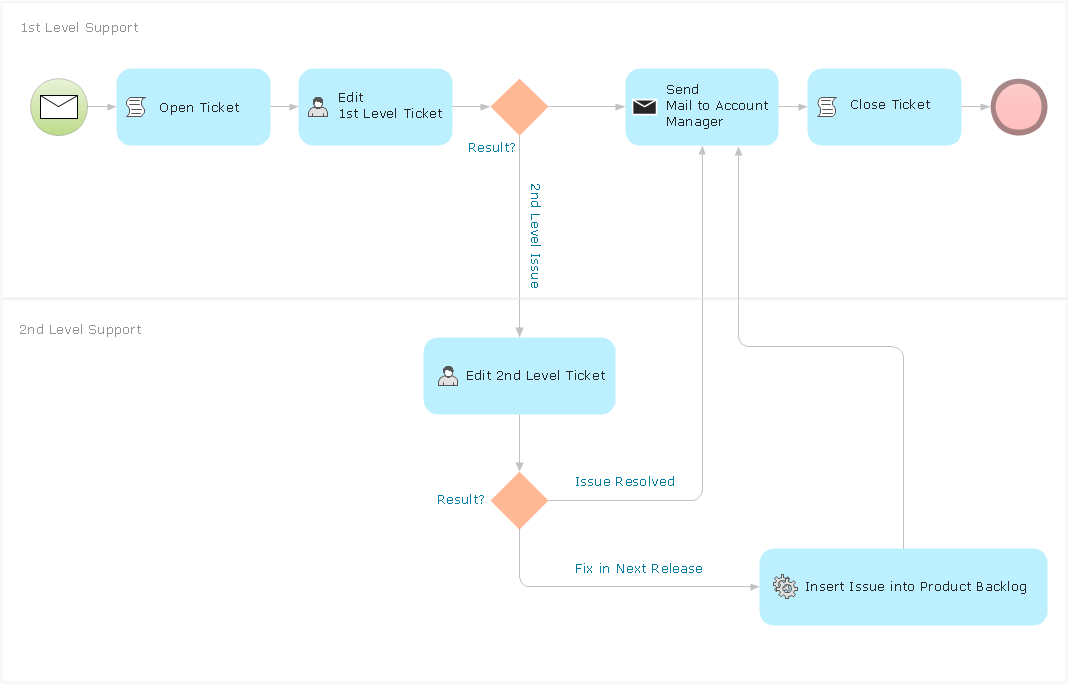
Picture: Business Process Management
Flow diagrams is a diagram used for structuring complex system and visually representing a flow and interactions of elements in a system.
ConceptDraw DIAGRAM diagramming and vector drawing software enhanced with Flowcharts Solution from the Diagrams Area of ConceptDraw Solution Park is perfect for easy drawing professional looking Flow Diagrams.
For drawing Flow Diagrams the Flowcharts Solution provides: 2 libraries with commonly used predesigned vector objects - Flowchart library and Flowcharts Rapid Draw library; collection of Flow Diagrams samples; Basic Flowchart template.
Picture: Flow Diagrams
Related Solution:
Activity Network Diagram - This sample was created in ConceptDraw DIAGRAM diagramming and vector drawing software using the Seven Management and Planning Tools solution from the Management area of ConceptDraw Solution Park.
This sample shows the PERT (Program Evaluation Review Technique) chart of the request on proposal. A request for proposal (RFP) is a request of the company or the organization to potential suppliers to submit the business proposals for service or goods that it is interested to purchase. The RFP is represented on the initial procurement stage and allows to define the risks and benefits.
Picture: Activity Network Diagram Method
Related Solution:
You need develop a business model? It’s very easy! All what you need is a powerful Business Process Diagram software. Never before creation of Business Models wasn’t so easy as now with Business Process Diagram Solution for ConceptDraw Solution Park.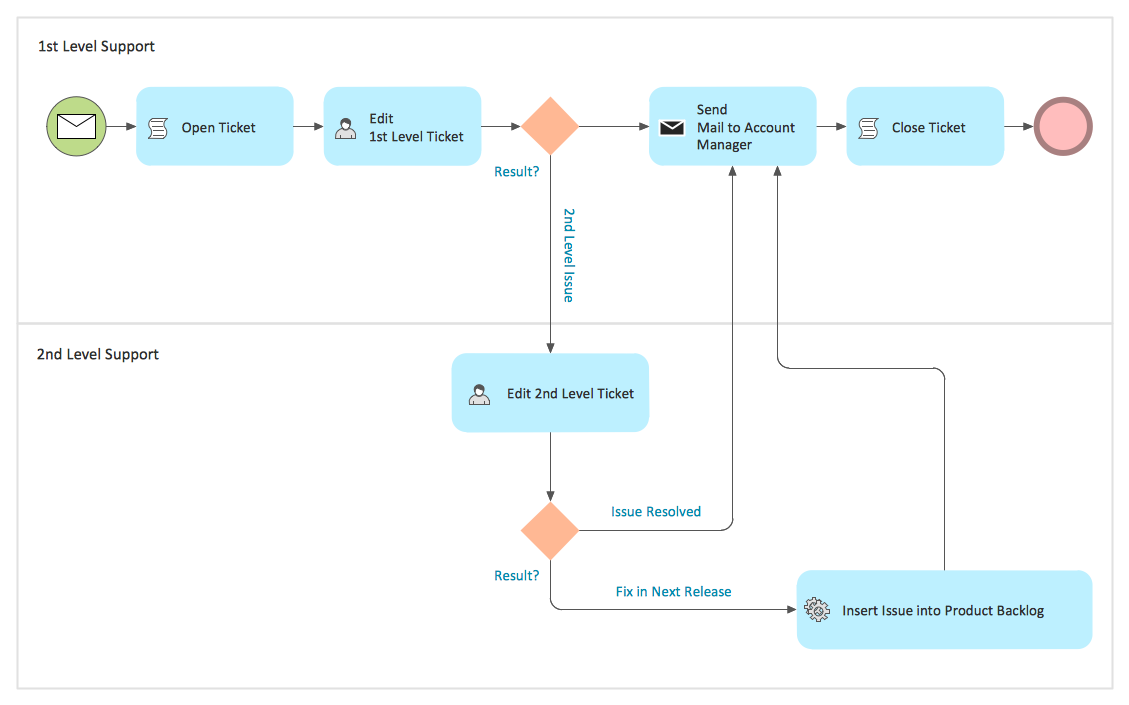
Picture: Business Models
Related Solution:

