HR Flowchart Symbols
Human resources is the term given to the people who make up the employee workforce of an organization or company. It was initially used simply as a synonym for manpower or labour; latterly, with the advent of globalization, a cottage industry has grown regarding human resource strategy, as a way of enhancing business value through management of the workforce.
Human resource management has four basic functions:
- Staffing,
- Training and development,
- Motivation,
- Maintenance.
The ability to create flowcharts representing various HR processes and workflows is made possible with ConceptDraw’s HR Flowcharts solution. A comprehensive selection of predesigned vector stencils libraries allow you to create eye-catching infographics relating to any human resource management process. Also included are standardized flowchart notation symbols, meaning your diagrams will be relevant and understood by all business associates. We try to make things easy for you at ConceptDraw, so you will also find flowchart and workflow templates inside the solution to help you get started with your own design. Using the HR Flowcharts solution, you can create professional looking HRM business process diagrams in a matter of moments.
This solution includes incredibly large collection of hr flowchart symbols libraries:
- HR Arrows library contains 57 arrows shapes
- HR Department library contains 49 department symbols
- HR Flowchart library contains 62 flow chart symbols
- HR Professions library contains 81 professions pictograms
- HR Steps library contains 32 workflow step symbols
- HR Symbols library contains 45 HR process pictograms
- HR Workflow library contains 60 workflow symbols

Example 1. HR Flowchart Symbols
Follow the next steps for design any HR Flowchart:

Example 2.
- add the required symbols from the HR Flowcharts libraries (example 3.),

Example 3.
- arrange the shapes and connect them with arrows (example 4.),

Example 4.
- type the text (example 5.),

Example 5.
- add pictograms (example 6.),

Example 6.
- result - human resources flowchart (example 7.).

Example 7.
The HR Flowcharts solution is an incredibly powerful tool for those who need to analyze or present human resource process flows in a visually effective manner.
TEN RELATED HOW TO's:
The ConceptDraw vector stencils library Cisco LAN contains symbols for drawing the computer local area network diagrams.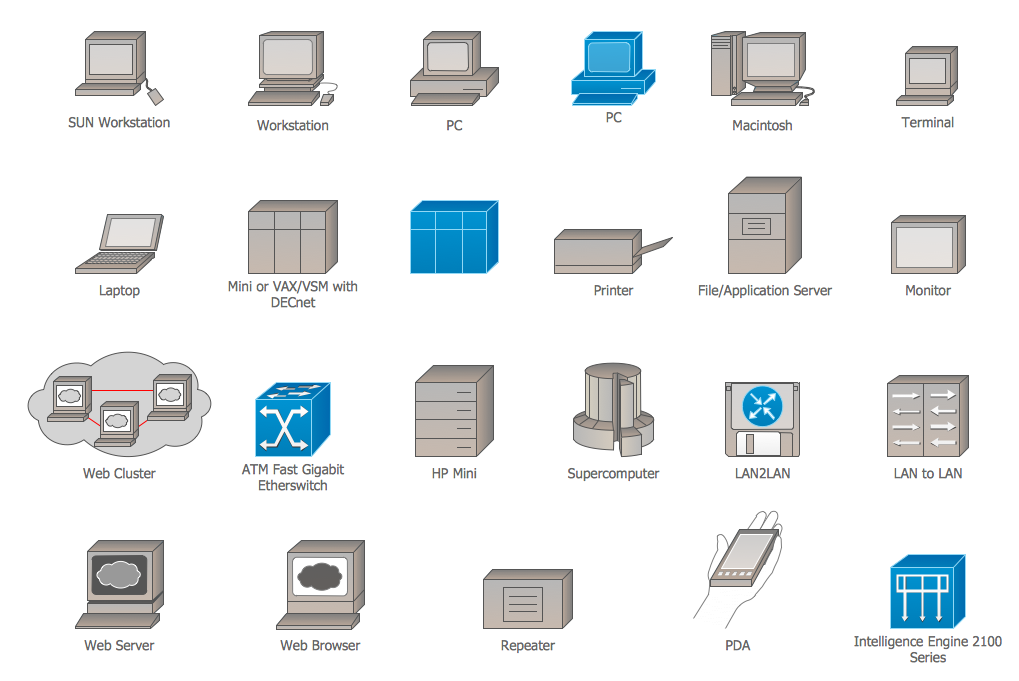
Picture: Cisco LAN. Cisco icons, shapes, stencils and symbols
Related Solution:
Working with personnel might be difficult if you are not prepared enough. To explain your workers all the details of communication with customers, you can draw an order process flowchart which will describe every step of the process and answer all the questions that might appear. You can view a lot of business process mapping diagram examples here, in ConceptDraw Solution Park.
This business process flow chart is created to illustrate the sample work order process. Before an organization can make some work for a person, the customer work order request must be completed. It is needed for tracking and accountability objectives. We used this business process flowchart to show a certain tasks and actions assumed by an organization. This flowchart depicts the outside inputs that are needed to launch a process, and ways the organization delivers its outputs. This business process flowchart was created with a help of ConceptDraw Business Process Mapping solution.
Picture: Work Order Process Flowchart. Business Process Mapping Examples
Related Solution:
ConceptDraw is your tool for driving social integration and managing change across and streamline social media processes of your organisation.This tool keeps the entire team on the same page allowing you to realize your social media strategy, improve the quality of your answers, and minimize the time it takes to respond.
Picture: Social Media Response Management DFD Charts - software tools
Related Solution:
Data visualization is an important part of any software design. To understand how diagrams can improve your work, you can use examples of flowcharts that can be easily found on Internet. Flowcharts represent processes as sequences of steps written in appropriate symbols.
Launching a website is a complex process. There’s a lot to accomplish, and multiple people who need to participate. This flowchart can be helpful in planning and prioritizing tasks, making the process well-organized and clear for both developers and customers. This example flowcharts was build using ConceptDraw Flowcharts solution. It is really handy and helpful for starting any website project. It includes the set of milestones, and activities that can be easily customized and applied to any individual project.
Picture: Flowchart Design: Contoh Flowchart
Related Solution:
Use the set of special professionally developed swim lane flowchart symbols - single, multiple, vertical and horizontal lanes from the Swimlanes and Swimlanes BPMN 1.2 libraries from the Business Process Diagram solution, the Swim Lanes library from the Business Process Mapping solution as the perfect basis for your Swim Lane Flowcharts of processes, algorithms and procedures.
Picture: Swim Lane Flowchart Symbols
Related Solution:
Flowcharts can be used in designing and documenting both simple and complex processes or programs and, similar to the other types of diagrams, they can help visualize what happens and so help understand some definite process, and, as a result, find flaws, bottlenecks and other features within it.
Picture: Flowchart Programming Project. Flowchart Examples
Related Solution:
Acquaintance with flowcharting starts from getting into basic terms. First of all, flowchart definition is quite clear – a flowchart is a graphical representation of a process or an algorithm made of special symbols. Secondly, flowcharting is an irreplaceable tool for IT specialists, project managers, and anyone who wants a clear understanding of any imaginable process.
Picture: Flowchart Definition: A Complete Guide
Related Solution:
ConceptDraw DIAGRAM vector charting software enhanced with HR Flowcharts solution is a suitable tool to create the HR org structure, onboarding model, design HR organizational chart for a company of any size without efforts.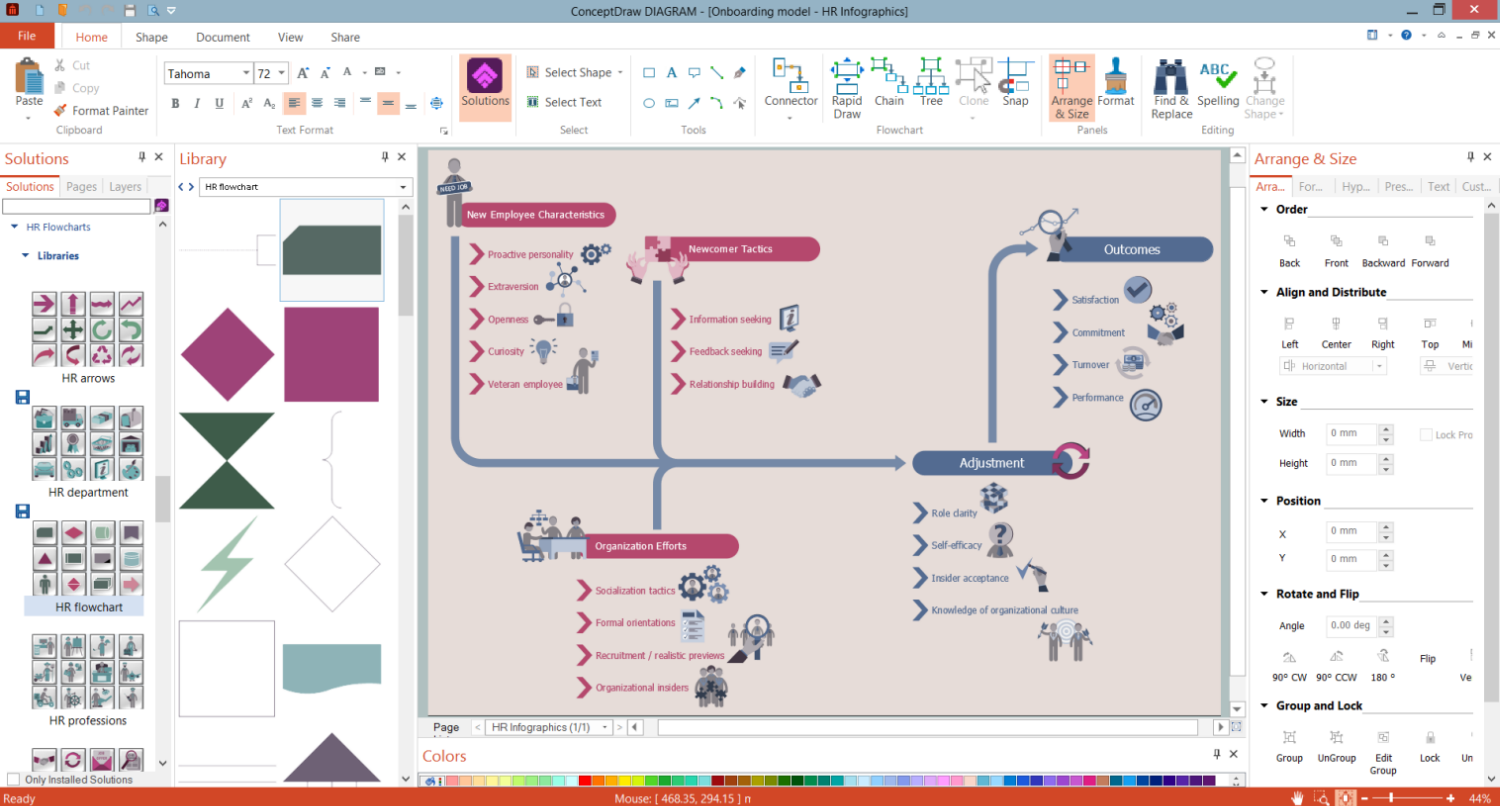
Picture: HR Org Structure
Related Solution:
The Office Layout Plans Solution contains a large quantity of vector objects that will make your creating of the office design plans easy, quick and effective. It also provides templates and samples that will help you create the office designs of any difficulty in one moment.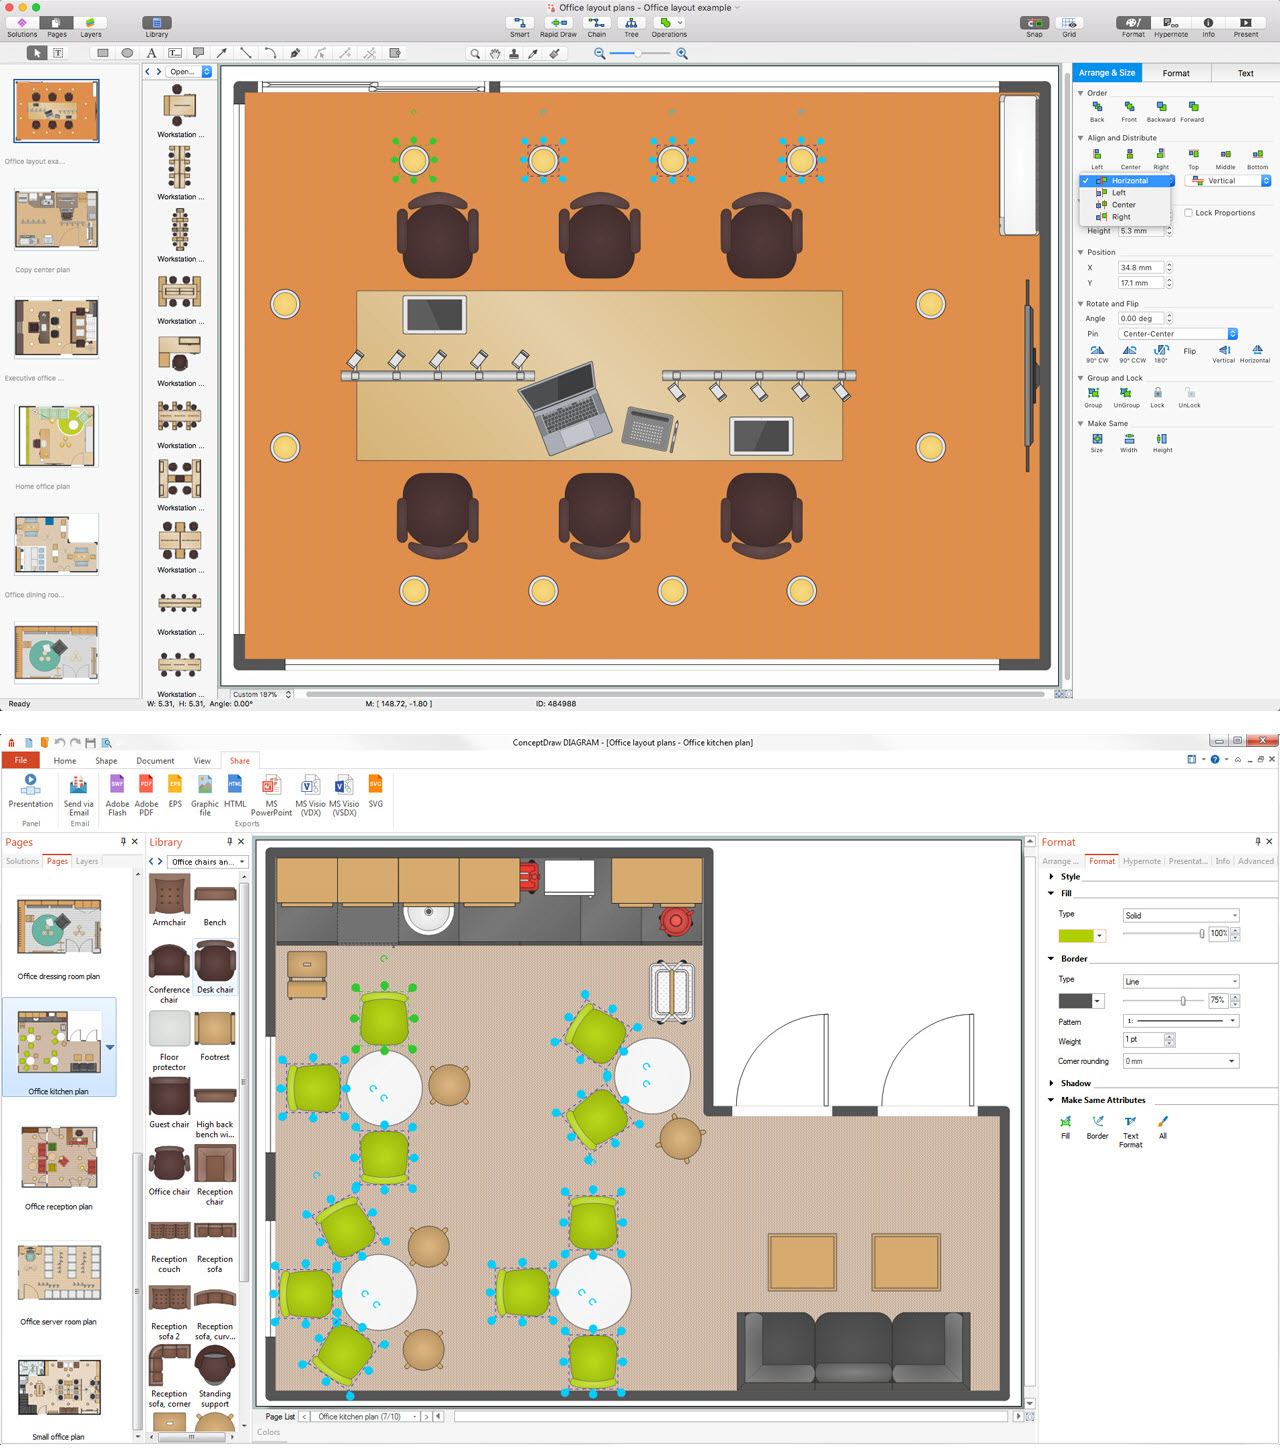
Picture: Office Design Software
Related Solution:
Design efficiently the technical flow charts in ConceptDraw DIAGRAM software for various fields and provide ✔️ clarity, ✔️ accuracy, ✔️ usability, ✔️ simple communication, analysis, and improvement
Picture: Technical Flow Chart Example
Related Solution:


