Made with
ConceptDraw
DIAGRAM 18

Process Flow Maps

What is a Process Flow Map

What is a Process Flow Map? It is a chart which visually illustrates a business process and how its steps work together. Process Flow Maps help companies define problem areas, inefficient activities for the purpose of further increasing performance and profitability of businesses.

Process Flow Map is an important tool for the improvement of processes, it can be also used to gather information about a process as an aid in decision making and performance evaluation.

An important fact is also that Process Flow Maps and Process Flow Charts are many and many years very popular in programming field.

Process Flow Maps *

Example 1. Process Flow Maps - Driving to a Goal


Process Flow Maps Design Software

It is convenient to use special flowcharting software for drawing Process Flow Maps. ConceptDraw DIAGRAM diagramming and vector drawing software extended with Flowcharts solution from the "Diagrams" area of ConceptDraw Solution Park is efficient and productive software for fast and simple creating professional looking Process Flow Map.

Invoice Payment Process Flow Map in ConceptDraw DIAGRAM  title=

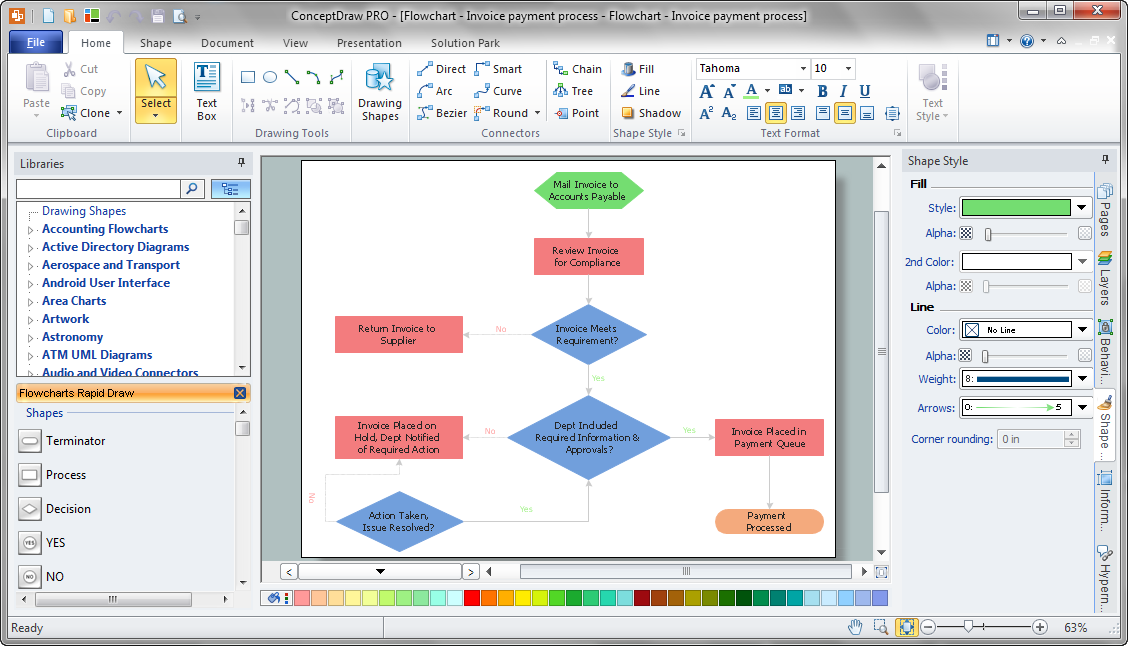
Example 2. Invoice Payment Process Flow Map in ConceptDraw DIAGRAM /p>

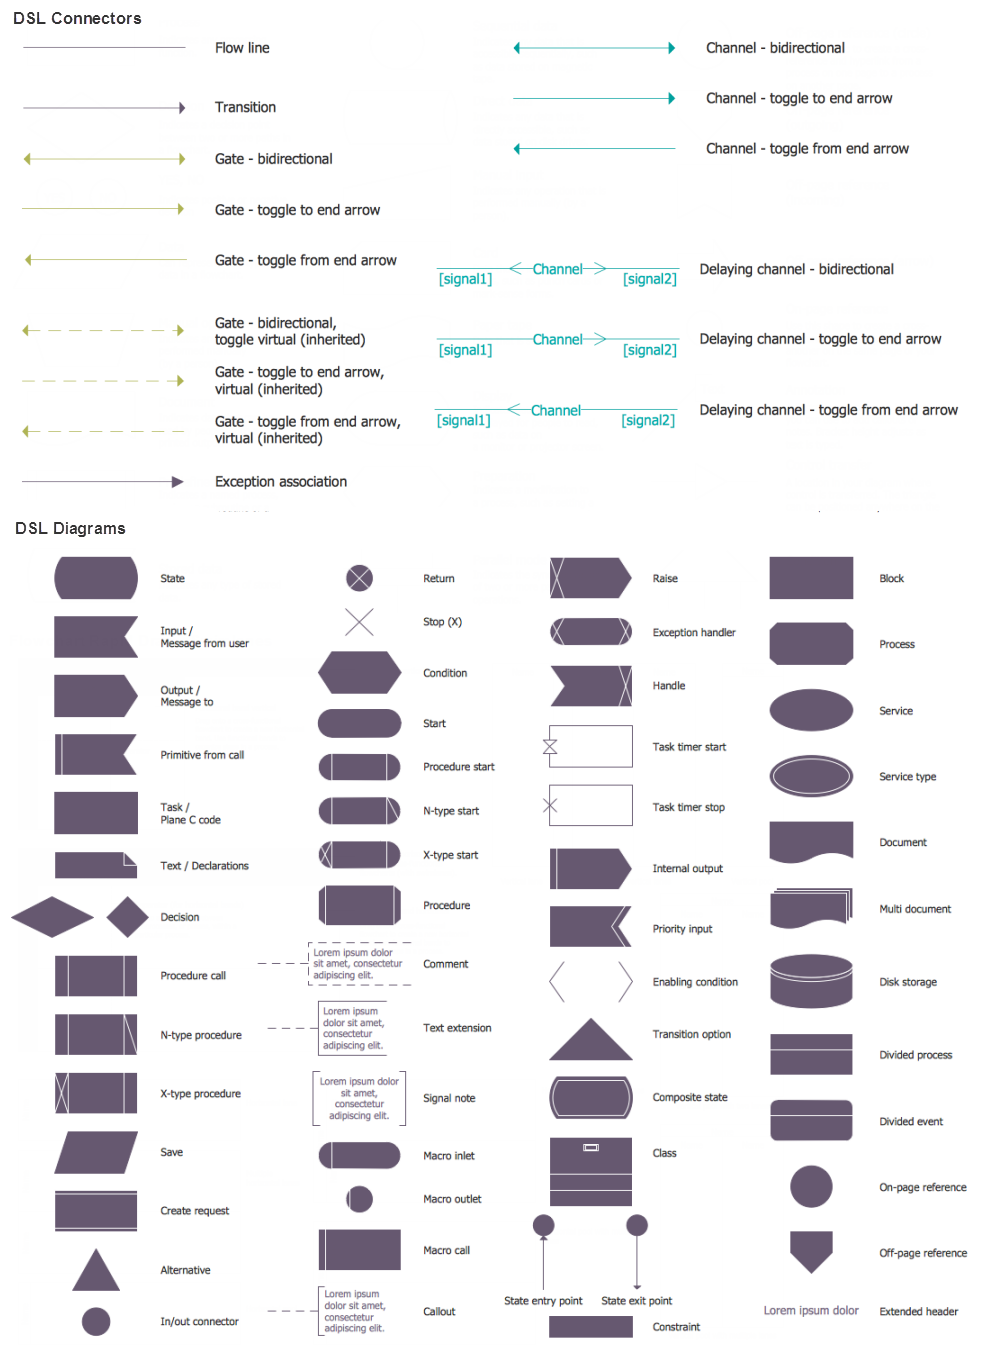
When designing Process Flow Maps are used rectangular boxes for representing steps of the processes, ovals for starting or ending points, arrows for illustrating order of the steps, and several other symbols.

Flowcharts Solution offers 2 libraries - Flowchart and Flowcharts Rapid Draw with all needed shapes for easy drawing Process Flow Maps and large collection of flow map and process flow map samples, and predesigned template for drawing in mere minutes. Use ConceptDraw STORE to receive access to them.

Flowcharts Solution in ConceptDraw STORE

Example 3. Flowcharts Solution in ConceptDraw STORE


Benefits of Process Flow Map

The Process Flow Map has a wide set of benefits:

  • gives a clear documentation of a process;
  • allows to define and offers common understanding of processes;
  • helps to build a process visual representation for analysis, discussion, and communication;
  • allows to identify the scope of the process;
  • allows to trace and analyze the process steps;
  • helps to standardize and find areas for monitoring, improvement and increased efficiency in a process;
  • allows to find and detach the steps of the process that are not essential;
  • helps in understanding the logic of complex problems;
  • offers a guidance for managers overseeing operations;
  • shows the plant design basis, the arrangement of major equipment, process lines, main control loops;
  • indicates feedstock, product, main streams flow rates and operating conditions;
  • facilitates communication between programmers and business people;
  • helps programmers to write the programs of any complexity and on the any high level language;
  • helps in debugging process and provides efficient program maintenance;
  • helps to understand and explain to other people the logic of the complex problems and their solution;
  • assists to improve teamwork effectiveness.

Process Flow Maps - Approval Process

Example 4. Process Flow Maps - Approval Process

The Process Flow Maps you see on this page were created in ConceptDraw DIAGRAM software using the tools of Flowcharts Solution for ConceptDraw Solution Park. An experienced user spent 10 minutes creating each of these samples.

Use the Flowcharts Solution for ConceptDraw DIAGRAM software to create your own process flow maps, process flow graph, process flow sheet diagram, and other types of process diagrams of any complexity quick and easy.

All source documents are vector graphic documents. They are available for reviewing, modifying, or converting to a variety of formats (PDF file, MS PowerPoint, MS Visio, and many other graphic formats) from the ConceptDraw STORE. The Flowcharts Solution is available for all ConceptDraw DIAGRAM or later users.


NINE RELATED HOW TO's:
The 7 Management and Planning Tools solution implements well-known methodologies for problem analysis and solving. Different products from the ConceptDraw Office suite can be used as a complete solution for any of the methodologies in this solution. ConceptDraw Office provides visual communication during every stage of work.7 Management & Planning Tools *
Picture: 7 Management & Planning Tools
Related Solution:
The Total Quality Management Diagram solution helps your organization visualize business and industrial processes. Create Total Quality Management diagrams for business process with ConceptDraw software.Best Value — Total Quality Management *
Picture: Best Value — Total Quality Management
Related Solution:
There are many tools to manage a process or to illustrate an algorithm or a workflow. Flowcharting is one of those tools. However, it may be difficult to show complex processes that require multiple attributes or several people in a simple flowchart, so a cross-functional flowchart would be a solution for that situation. To create such flowchart, group processes and steps to labeled rows or columns, and divide those groups with horizontal or vertical parallel lines. It is worth mentioning that there are different types of cross-functional flowcharts, like opportunity or deployment flowchart. This diagram shows a cross-functional flowchart that was made for a trading process. It contains 14 processes, distributed through 5 lines depicting the participants who interact with the process. Also there are connectors that show the data flow of information between processes. The cross-functional flowchart displays a detailed model of the trading process, as well as all participants in the process and how they interact with each other. The lines in the flowchart indicates the position, department and role of the trading process participants.Cross-Functional Flowchart
Picture: Cross-Functional Flowchart
Related Solution:
Also included are standardized hr flowchart symbols, meaning your diagrams will be relevant and understood by all business associates.HR Flowchart Symbols
Picture: HR Flowchart Symbols
Related Solution:
The ConceptDraw DIAGRAM is a good flow chart app for Mac. Numerous vector stencils, samples and templates created by designers allows you to draw any type of flowchart.Good Flow Chart app for Mac *
Picture: Good Flow Chart app for Mac
Related Solution:
UML Communication diagramming software with rich examples and template. ConceptDraw is ideal for software designers and software developers who need to draw UML Communication Diagrams.Communication Diagram UML2.0 / Collaboration UML1.x *
Picture: Communication Diagram UML2.0 / Collaboration UML1.x
As restaurant industry is growing rapidly nowadays, researches show that almost half of the adults have worked in a restaurant or a cafe. Moreover, many of them dream to start their own someday. Unfortunately, it takes a lot of time to write a business plan and to find a great location, although some know how to create a restaurant floor plan in minutes or how to plan budget effortlessly. Hiring employees can also cause a lot of headache, but this is crucial for further success, because every guest comes to restaurant for a good service and delicious food. It is also worth noting that restaurant concept is also important, because it defines target audience and influences the menu. This diagram represents the floor plan of an ongoing sports-theme establishment - restaurant, cafe, or other food service. A number of widescreen monitors installed along the perimeter provide visitors the opportunity to follow the course of a match from anywhere in the dining room of restaurant or cafe. The most of sports fans believe that food and alcohol is a big part of any sports show. That is why the dining room takes the most space - almost 60% of the total establishment space. Nearly all sports fans consume beverages while watching sports - beer, soda or water at least. Thus, the restaurant floor plan designers added a large lavatory there. Moreover, project developers considered unnecessary the gender division of such delicate place - perhaps they guess that only men are watching football, or believe that alcohol will eliminate the most of gender differences.Restaurant Floor Plan
Picture: How To Create Restaurant Floor Plan in Minutes
Related Solution:
A flowchart is a picture of the separate steps of a process in sequential order. ConceptDraw DIAGRAM is a Process Flowcharts software. This software includes basic package of process flow examples. The software contains object libraries with vector stencils that allows you use RapidDraw technology. By clicking on direction arrows you can add a new object to the flowchart.Example Process Flow *
Picture: Example Process Flow
Related Solution:
It doesn’t matter what kind of business you have, a bar or a gym, there are common concepts for any of them. One of those concepts is accounting, and to facilitate the work with the figures, you can use accounting flowchart symbols and create a clear and representative scheme. You can create flowchart for auditing, tax accounting and even for planning your own budget. A graphical tool for displaying successive processes is flowchart. This method is mostly suited to represent an accounting process. The sequence of steps in the accounting process usually consists of standard accounting procedures, that can be depicted by using a minimal number of symbols, applied for the basic flowcharting. The advanced opportunity to create professional Accounting Flow charts is provided by ConceptDraw Accounting Flowcharts solution. It includes contains a library of accounting flowchart symbols used when drawing the accounting process flow.Accounting Flowchart Symbols
Picture: Accounting Flowchart Symbols
Related Solution:
ConceptDraw
DIAGRAM 18