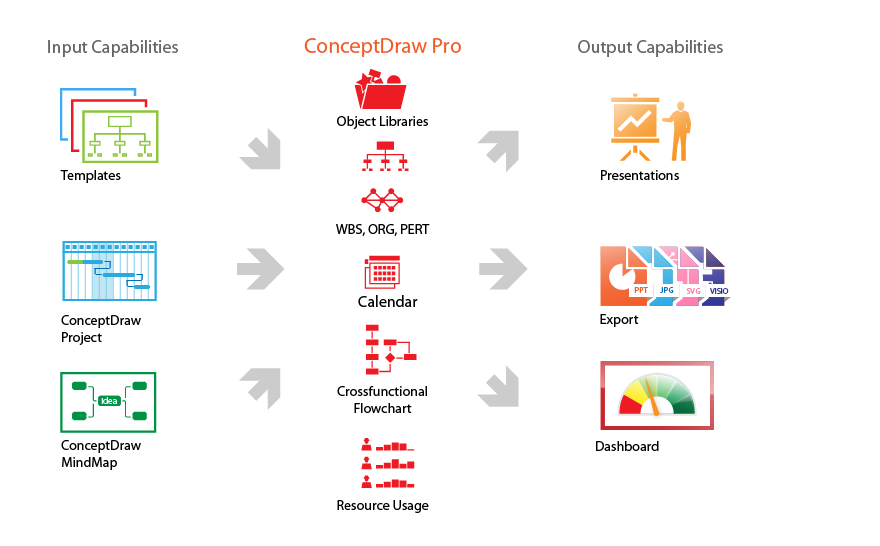
Gantt charts for planning and scheduling projects
|
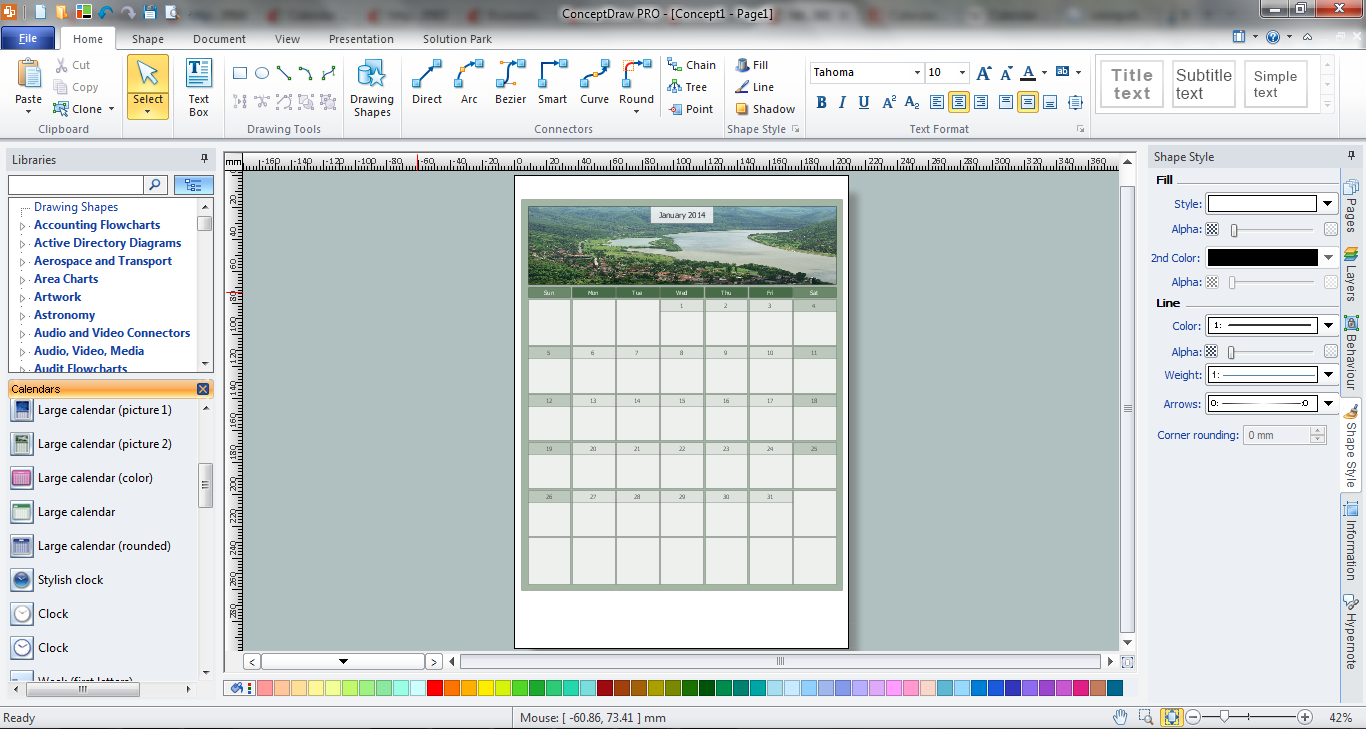
is simple project scheduling software which provide full range of professional project reports with project statuses and resorces usage. Here we explain very common thing - how project gantt charts works in scheduling software. A Gantt chart is a graphical representation of task segments within a given time scale. The Gantt chart helps project managers in planning and monitoring project development or resource allocation. The left hand column in a Gantt chart is a list of all the tasks that pertain to the project at hand. The horizontal axis is a time scale that is expressed either in absolute or relative time. In a Gantt chart, each task takes up one row with dates running across the horizontal axis in increments of days, weeks or months. The bars in the Gantt chart visually show the start and end dates of each task in a project. Tasks may run sequentially, in parallel or overlap each other. Each tasks indicate resources assigned to tasks. This is common approach of how every simple project scheduling software operates with tasks. |

Example of Gantt chart
(Picture made with use of simple project scheduling software, ConceptDraw PROJECT )