Network Visualization Guide.How to Use ConceptDraw Network Visualization Tool
Network directors, system administrators, automatic control system-specialists, specialists on electronic document exchange. People of these professions, by the nature of their occupation, need information on the enterprise network in various representations. As in many other cases, it is visualization of information that helps a specialist to simplify the process of decisionmultilateral parametrization of objects-making. And that's where such a network visualization tool as ConceptDraw DIAGRAM network graph maker comes to aid.
Understanding Network Visualization
Network graph visualization is the process of graphical displaying of networks, network devices and dependencies, network metrics, physical and logical data flows in the form of entities or nodes and links connecting them. Network diagram data visualization gives a quick and intuitively understood overview of the networks and allows monitoring and analyzing them, identifying dependencies and trends, planning capacity, troubleshooting, and resolving outages or bottlenecks.

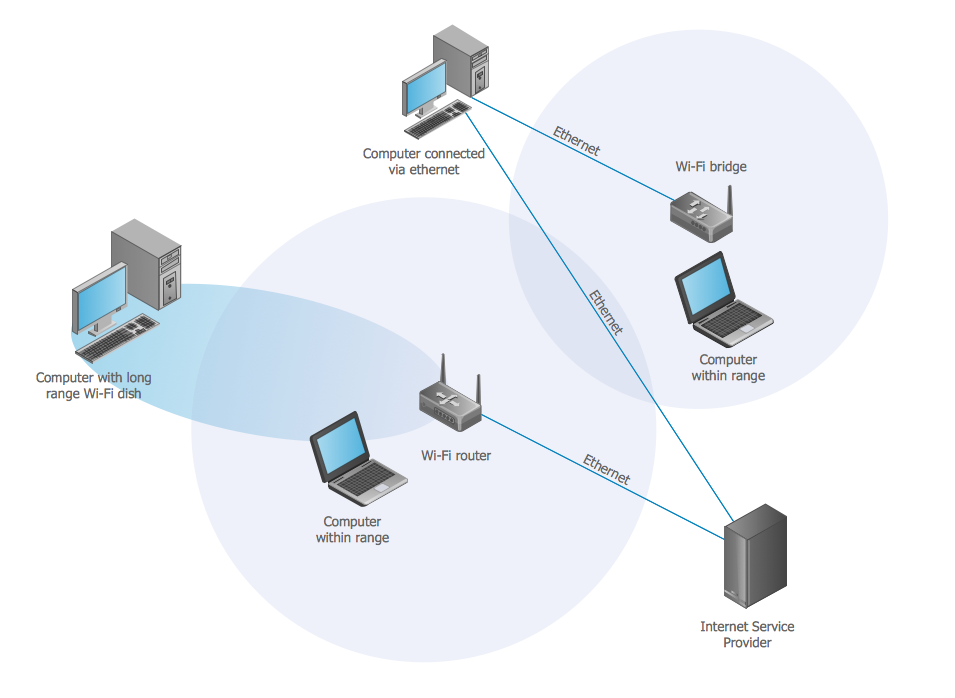
Example 1. Network Graph Visualization
The Basics of Network Visualization
Use it for:
- graphics for Internet traffic statistics
- calculation of network cost
- diagrams on available network resources
- organizational diagrams
- domain maps
- visualization of any other data;
- network floor plan layout
- rack shemes illustration
- structure cloud or local storages
Benefits of Visualizing Network Structures
Key benefits of network data visualization:
- improves network visibility
- simplifies complex data
- ensures more informed network planning
- reveals patterns and trends
- accelerates troubleshooting
- improves retention and engagement
- increases accessibility
- improves communication
- streamlines onboarding
- provides real-time monitoring
- assists in predictive analysis
- helps in decision-making
- simplifies identification areas that need attention or improvement

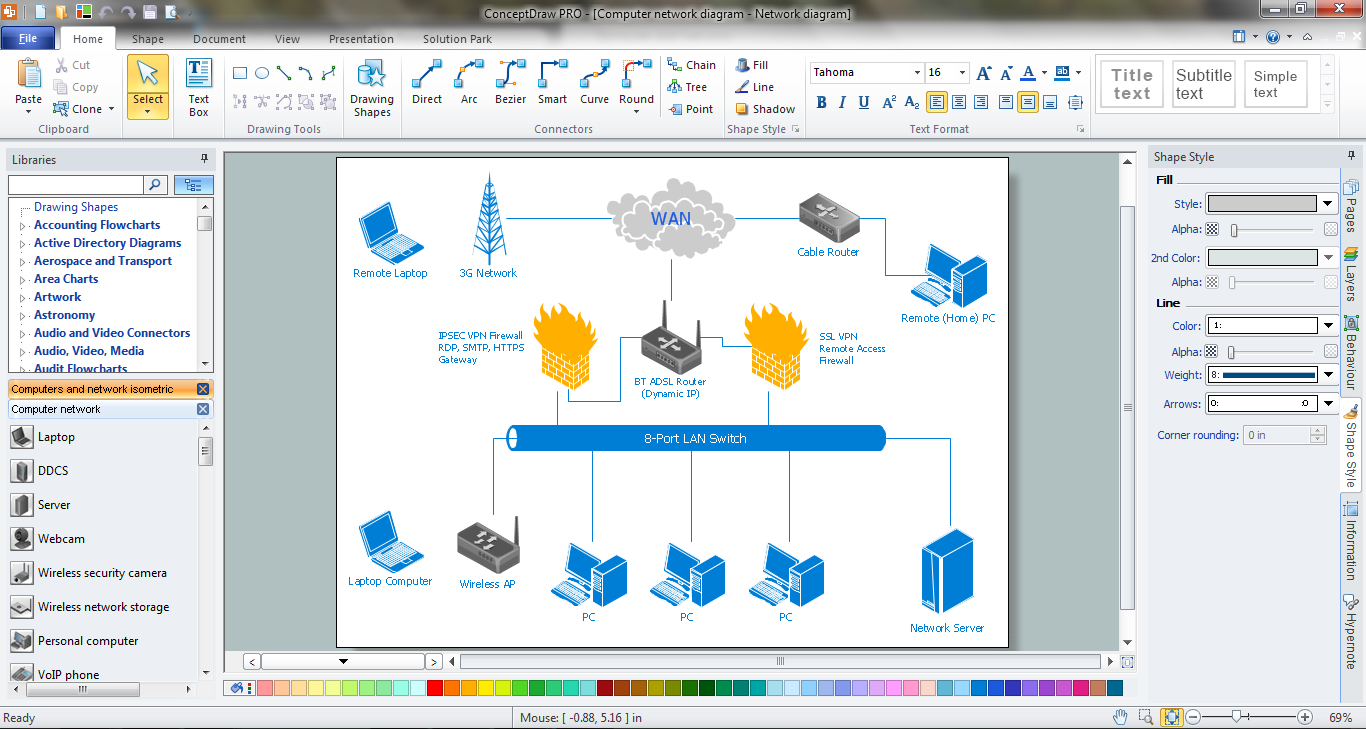
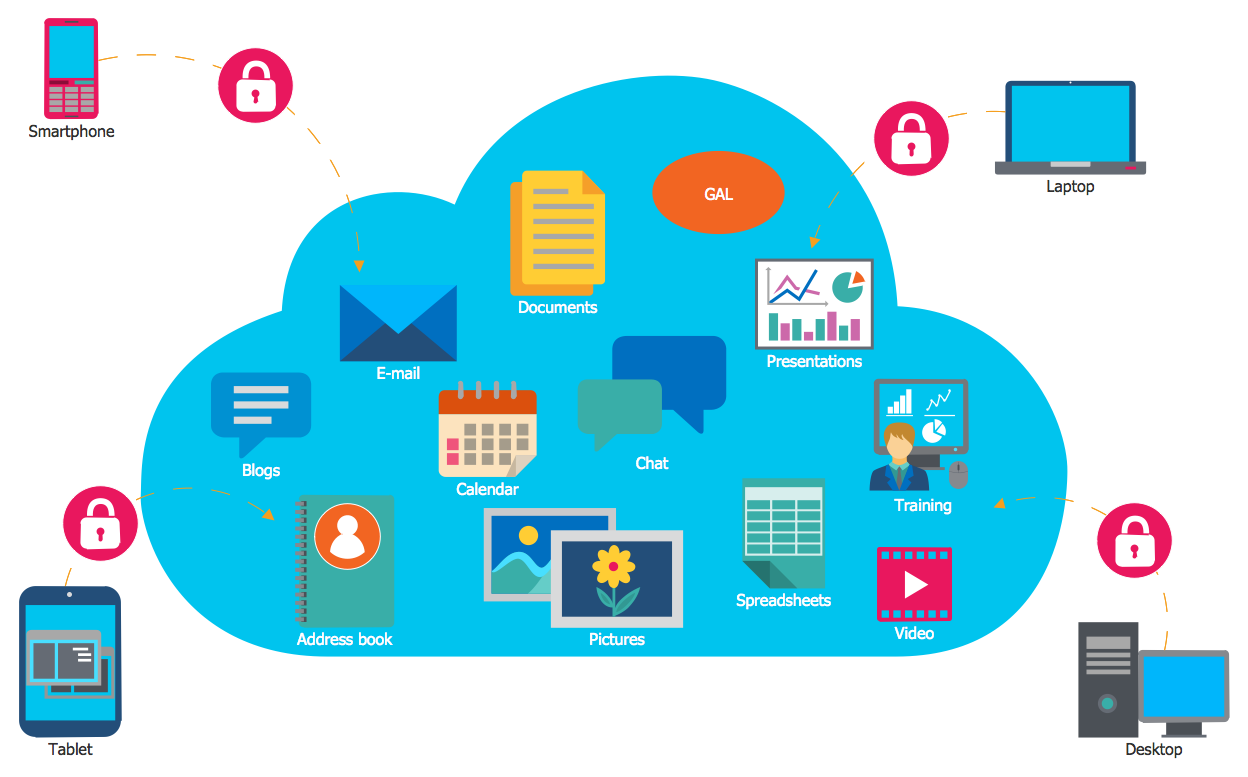
Example 2. Computer Network Diagram
Correctly constructed documentation is a powerful assistant in reliable network development and establishment. The enormous variety of pre-made vector objects included in ConceptDraw DIAGRAM solutions libraries helps to create attractive and comprehensive network content intuitively and quickly.
Importance of Visualization in Network Management
Network management refers to the process of configuring, monitoring, and managing the performance of a network, and completing ongoing tasks. It helps IT teams to operate efficiently, well-coordinated, in more agile ways, and optimize network performance. Visualization in network management is especially useful and important. Network graph visualization additionally enhances its efficiency because helps to make the structure and processes more visual and simplifies their comprehension and analysis.

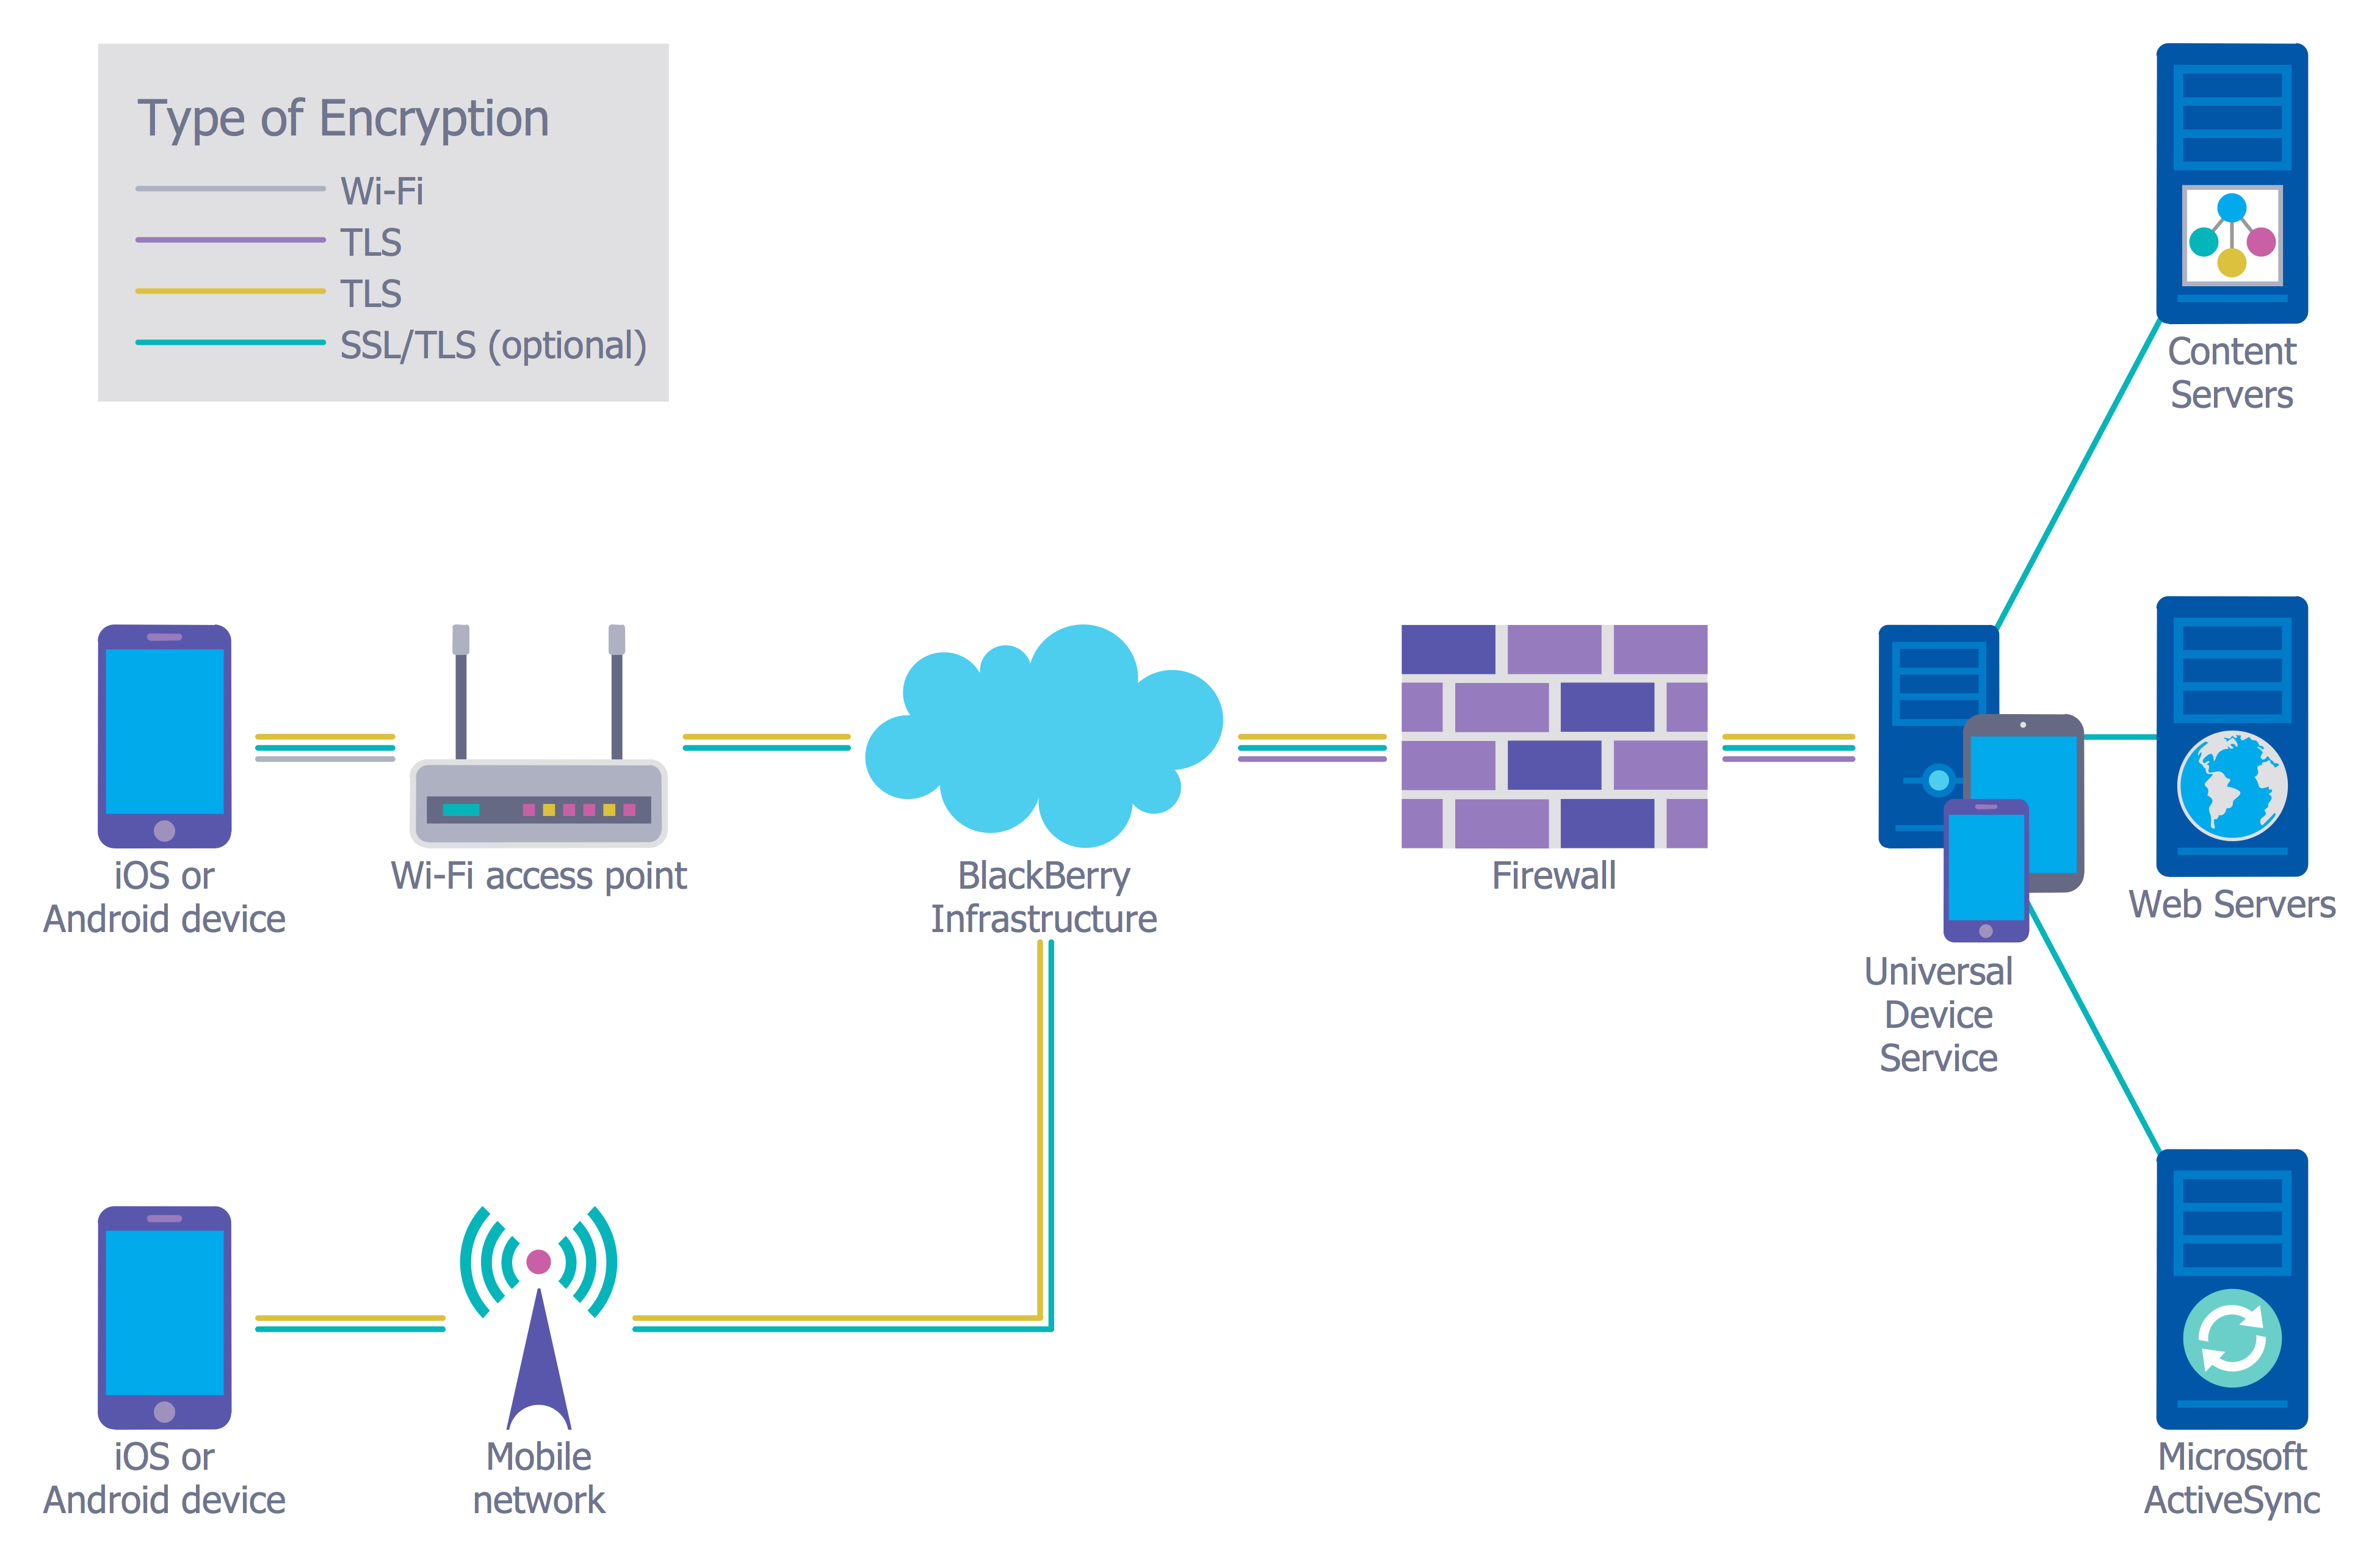
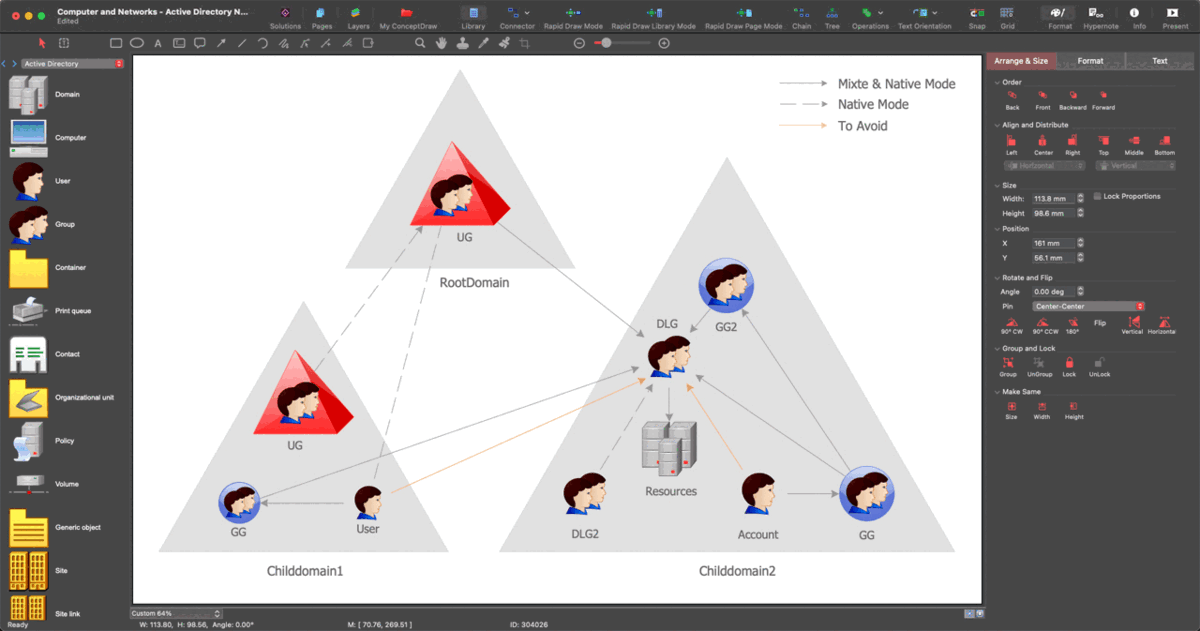
Example 3. Network Management in ConceptDraw DIAGRAM
Overview of ConceptDraw Network Graphing Software
ConceptDraw DIAGRAM network graphing software makes the entire process of network visualization easier thanks to the numerous ready-to-use objects included in the package for presentation of network equipment, LDAP directory symbols and many other objects that symbolize resources in most various representations.
ConceptDraw DIAGRAM possibilities
Smart connectors simplify displaying of interconnections among the network graph elements: once you have interconnected the symbols of the devices, they will remain connected even if you shift any of them.
Benefits:
- a set of templates and libraries with ready-to-use objects
- powerful graphic capabilities (2D-graphics)
- support for hyperlinks
- numerous export formats
- scripting language ConceptDraw Basic
- possibility to use external shared libraries
- XML support
- multilateral parametrization of objects
- cross-platform (Apple macOS, Microsoft Windows)
To display different network levels you can draw diagram or network graph on several layers and show or hide layers according to your needs. Another variant of layer division that can be realized in ConceptDraw DIAGRAM is creation of a multi-page document connected by hyperlinks.
ConceptDraw objects allow to save arbitrary detailed information on the equipment in the user's properties of the object (Custom Properties).
Rich possibilities for setting text properties, and ready-to-use background objects allow to beautifully design diagrams; the set of supported export formats (various vector and raster formats: PNG, JPG, BMP and other. Vector formats: PDF (layers support on Windows), MS Power Point. Hyperlinks support not only HTML export, but PDF too simplify the process of information exchange with your colleagues and business partners.
A great step in (the degree of utility) of ConceptDraw DIAGRAM was made after the appearance of ConceptDraw Basic — the in-built scripting language of ConceptDraw. The typical task for ConceptDraw Basic is to automate visualization of some data. This data can be obtained in the result of work of an arbitrary application (including ConceptDraw-script) and it can be saved in a text file. In the first two cases further on data will be read and outlined with the help of ConceptDraw Basic. In case you use a ConceptDraw open format (XML for ConceptDraw or XML for Visio) can open the obtained document in ConceptDraw DIAGRAM, add design details and get a presentable diagram. Possibilities of ConceptDraw Basic greatly increase at using the script functions, which are exported by the shared libraries.
Here are several examples on the ideas of automation that may attract specialists who plan and track functioning of computer networks.
Target Audience and Use Cases

|
Planning a network for tracking information traffic with the aim of traffic localization you need information on the company structure visually displayed. It can be presented, for example, as an organizational chart. |

|
Having created the network diagram on the level of the devices used and having assigned the cost of the devices in the object custom properties you can, with the help of simple CDBasic-script evaluate the cost of the solution obtained. Such a script can accelerate planning of the equipment for the future network or upgrading the existing one. For users' convenience ConceptDraw DIAGRAM library objects, representing the network equipment are already supplied with many typical characteristics (producer, serial number, premises...), but you can always add new ones, needed for a specific task. Note that in such a case there is no need in interaction between ConceptDraw Basic with the external libraries, as well as in temporary storing of information in some file or DB. |
Tips and Best Practices for Network Visualization
Support of a number of open formats, the possibility of interaction with files and the ability of ConceptDraw Basic to call the functions exported by the external shared libraries opens wide opportunities for building most various solutions in the field of data visualization and network data visualization. Moreover, such subject field as planning and management of networks are capable of presenting a large number of tasks, awaiting to be solved within the given technology.
Example 4. Network Graph Design with Network Graph Maker
Managing Large and Complex Networks
Networks play a central role in today's society. They are used for numerous purposes in numerous sectors: communication, business, mobility, transport, etc. Therefore, numerous algorithms, network graph and diagram types were developed to manage networks, including large and complex networks. They help to display the strategies for the management of networks and choose the best one for you, manage and control everything connected to your network, reduce the complexity of the large-scale network configuration, and simplify managing transaction flows and substantial amounts of data in a network.
Optimizing Performance for Smooth Visualization
Good performance is critical to success in many areas including networks. The smoothed analysis is one of the ways to optimize performance, reveal patterns in the network, and balance the traffic on input and output wires. It helps to study dynamic and static networks, detect and eliminate gaps efficiently, make adjustments, avoid distortion, optimize assets, and improve performance metrics.
Conclusion
The Computer and Networks area of Solution Park for ConceptDraw DIAGRAM network graphing software includes 16 solutions useful for network visualization. Use a desired network visualization tool from the listed ones to simplify network diagram design:
- Active Directory Diagrams — Document the structure of Microsoft Windows networks, Active Directory domains, Organizational Units (OU), and Exchange Server organization. Manage the controlled access to printers and files, access and security, network equipment maintenance and repair, and data backup, storage, and recovery.
- Azure Architecture — ConceptDraw teams up with Microsoft to bring the Azure Diagrams solution, a selection of Azure-themed graphics and templates, allowing you to create effective Azure architecture diagrams.
- AWS Architecture Diagrams — The solution includes the icons Amazon notation suggests to be used when creating architecture diagrams describing your use of Amazon Web Services or Amazon Cloud Services.
- Cisco Network Diagrams — The Cisco Network Diagrams solution contains Cisco network symbols and icons to help you visualize computer network topology, equipment connections, and arrangement.
- Cisco Networking — Use Cisco Networking solution to succeed in designing network configurations using the Cisco network equipment and devices, in modeling networks, in installing Cisco equipment, managing networks and ensuring their security.
- Cloud Computing Diagrams — Succeed in design Cloud Computing Diagrams, visually represent how cloud computing works and depict professionally Cloud Computing Architecture.
- Computer Network Diagram — A comprehensive set of graphics covering all elements of computer networking. Create diagrams containing computer hardware, user inputs, and communication devices.
- Google Cloud Platform — This solution with numerous predesigned Google Cloud Platform icons the best suits for designing Google Cloud Platform (GCP) architectural diagrams and drawings, to illustrate best features and services of Google Cloud Platform.
- Internet of Things — Implement efficiently the automation in homes, enterprises and industries with Internet of Things (IoT) and Web of Things (WoT) diagrams and infographics. Clipart, pictograms and symbols of IoT sensors, IoT devices, smart appliances, retail, industrial, agricultural and other IoT devices are beneficial for the development process.
- Interactive Voice Response Diagrams — Create a diagram that visualizes the logical structure of an interactive voice response system. A complex IVR system may have many different options available through voice recognition or button-pressing responses - map them out with the help of this solution.
- Network Layout Floor Plans — This solution allows you to create a computer network blueprint of your home or business. Create an overview of the connections between computers, modems and routers with a workspace.
- Network Security Diagrams — Depict and illustrate useful knowledge about network security, cyber security degrees, secure wireless network, represent the network security tips, develop new effective network security devices and IT security solutions, and share them easily with your colleagues and friends.
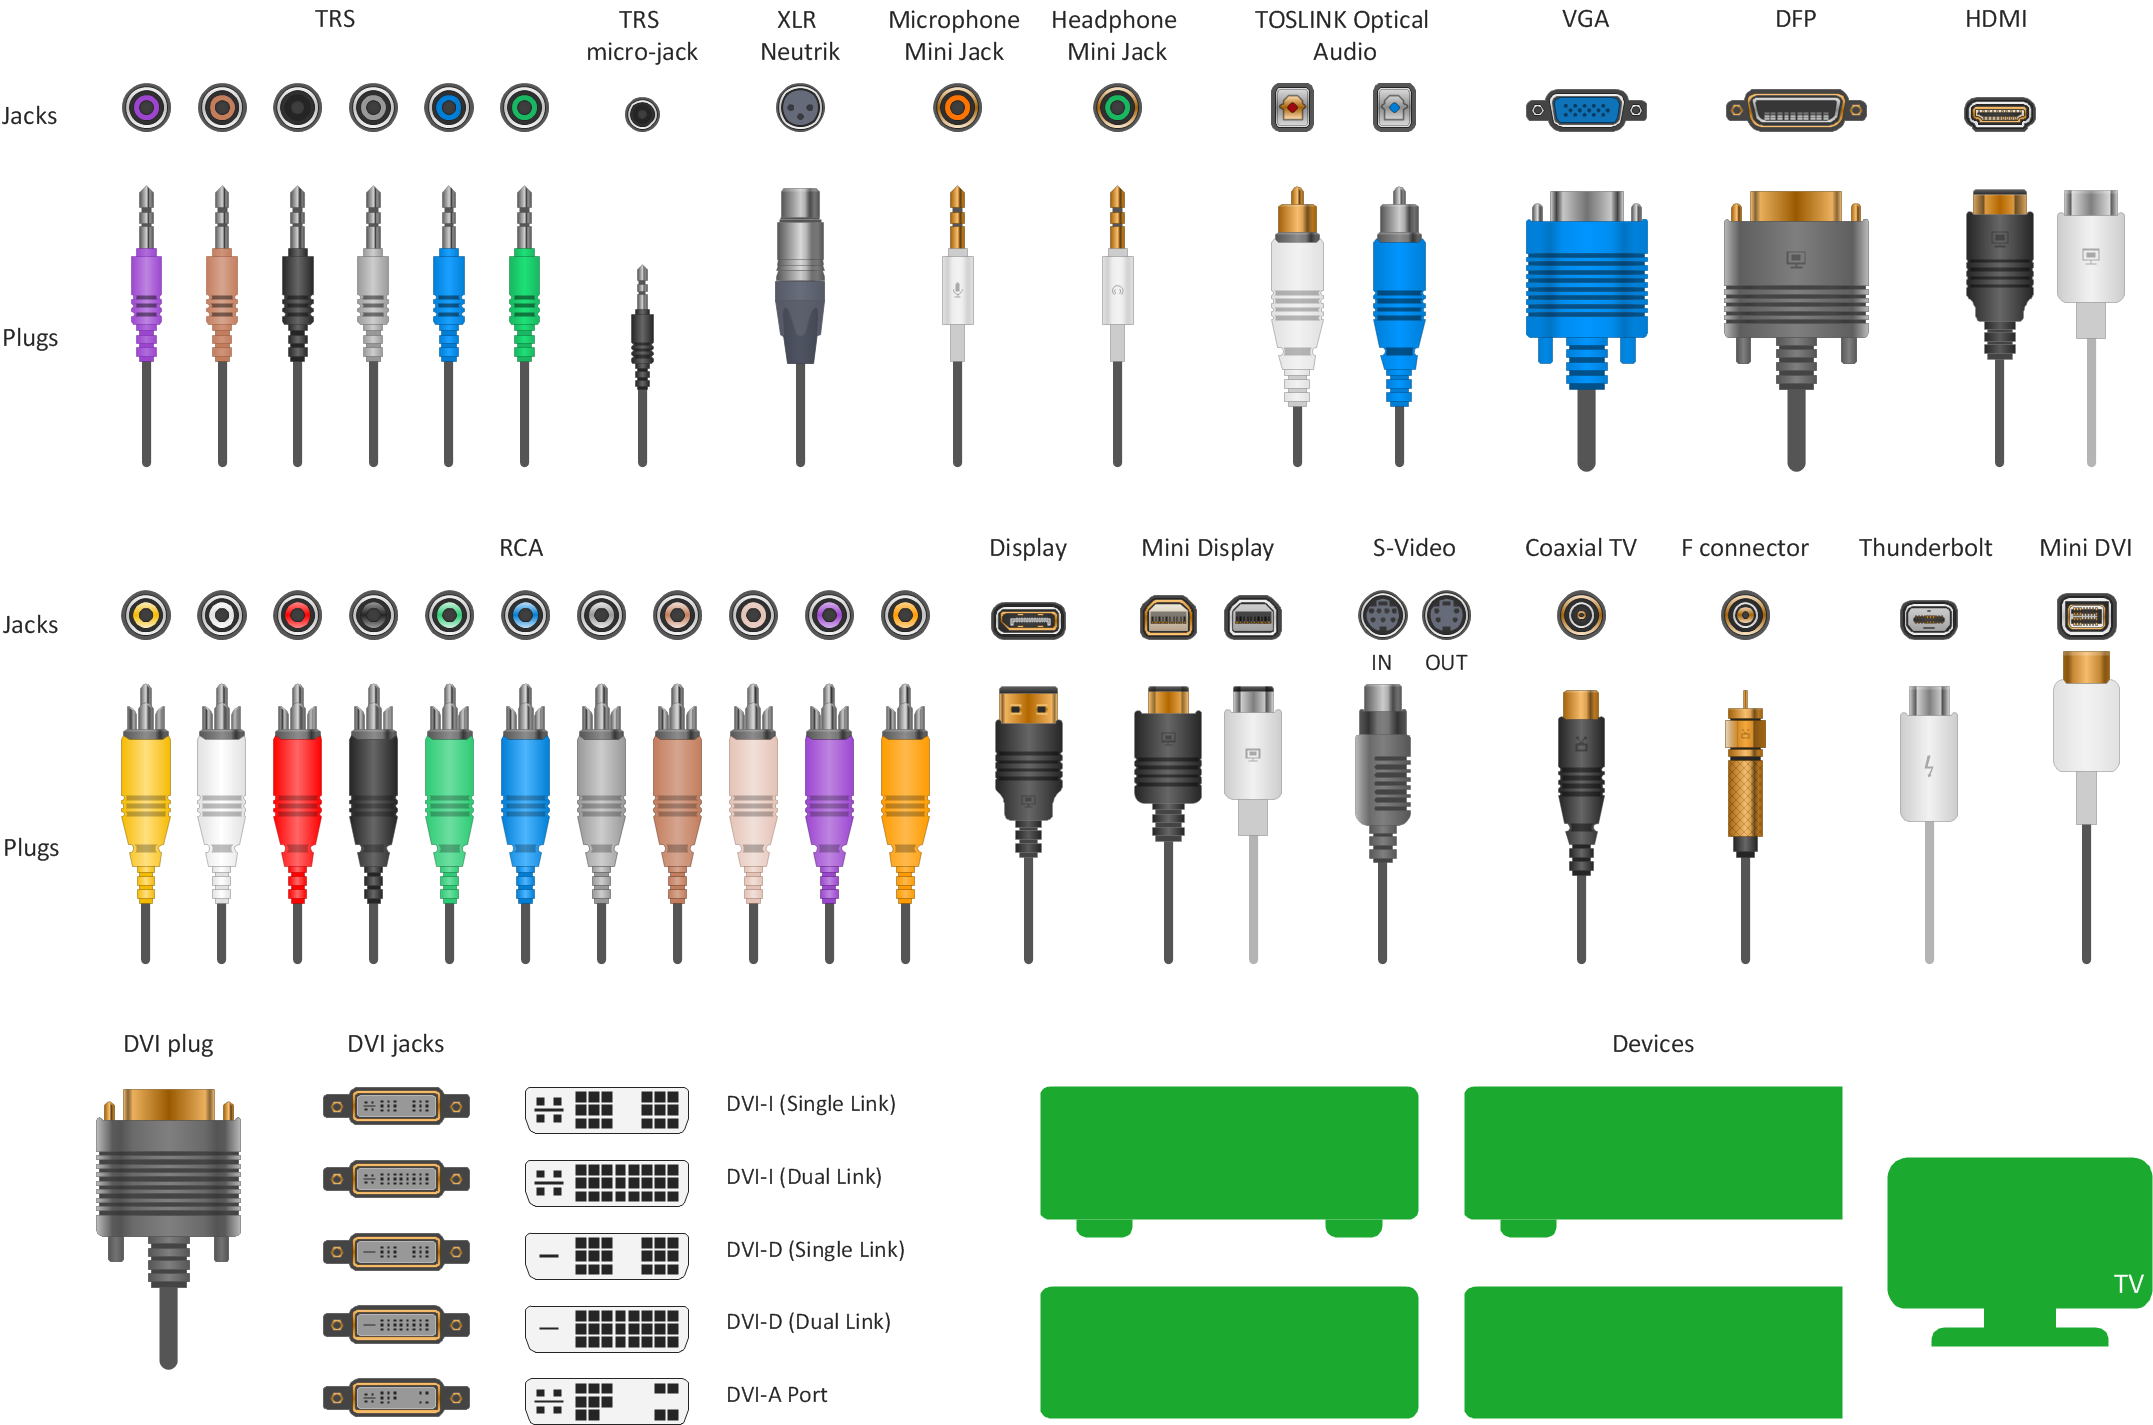
- Rack Diagrams — A rack diagrams can visualize the rack mounting of computer and network equipment as a frontal view of the rack, with the equipment installed. You can decide the best configuration before beginning the physical task.
- Telecommunication Network Diagrams — Create a diagram depicting telecommunication on any scale. From call centers to GPS navigation systems, TV networks to satellite communication, wireless broadband to radio linking.
- Vehicular Networking — Show a variety of transportation networks and their connections on a local or global scale. By boat, by air or by land; your drawing has no bounds.
- Wireless Networks — A solution with graphics relating to all aspects of wireless networking. Design or document the wireless network from your home or business.